| Param | Original file | Final file |
|---|---|---|
| Filename | modeM0/AS1G02_021T08_9000000302_01827cztM0_level2.evt | modeM0/AS1G02_021T08_9000000302_01827cztM0_level2_quad_clean.evt |
| Size (bytes) | 1,307,419,200 | 76,775,040 |
| Size | 1.2 GB | 73.2 MB |
| Events in quadrant A | 9,401,322 | 450,194 |
| Events in quadrant B | 11,885,921 | 455,922 |
| Events in quadrant C | 8,992,916 | 452,141 |
| Events in quadrant D | 8,813,759 | 438,114 |
| Mode M9 | |||
|---|---|---|---|
| Quadrant | BADHDUFLAG | Total packets | Discarded packets |
| A | 0 | 1 | 0 |
| B | 1 | 1 | 0 |
| C | 1 | -1 | -1 |
| D | 1 | -1 | -1 |
| Mode M0 | |||
|---|---|---|---|
| Quadrant | BADHDUFLAG | Total packets | Discarded packets |
| A | 0 | 33339 | 2 |
| B | 0 | 40720 | 18 |
| C | 0 | 32077 | 2 |
| D | 0 | 31652 | 11 |
| Mode SS | |||
|---|---|---|---|
| Quadrant | BADHDUFLAG | Total packets | Discarded packets |
| A | 0 | 152 | 0 |
| B | 0 | 152 | 0 |
| C | 0 | 152 | 0 |
| D | 0 | 152 | 0 |
| Quadrant | Total seconds | Saturated seconds | Saturation percentage |
|---|---|---|---|
| A | 7594 | 57 | 0.750593% |
| B | 7592 | 240 | 3.161222% |
| C | 7594 | 52 | 0.684751% |
| D | 7592 | 93 | 1.224974% |
Noise dominated data is calculated using 1-second bins in cleaned event files. If a bin has >2000 counts, and if more than 50% of those come from <1% of pixels, then it is considered to be noise-dominated and hence unusable.
| Quadrant | # 1 sec bins | Bins with >0 counts | Bins with >2000 counts | High rate bins dominated by noise | Noise dominated (total time) | Noise dominated (detector-on time) | Marked lightcurve |
|---|---|---|---|---|---|---|---|
| A | 8014 | 7595 | 373 | 373 | 4.65% | 4.91% | 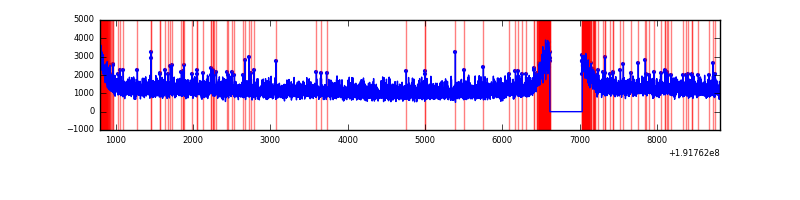 |
| B | 8014 | 7594 | 1513 | 1513 | 18.88% | 19.92% | 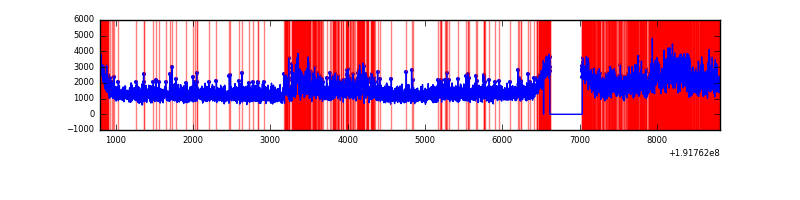 |
| C | 8014 | 7595 | 307 | 307 | 3.83% | 4.04% | 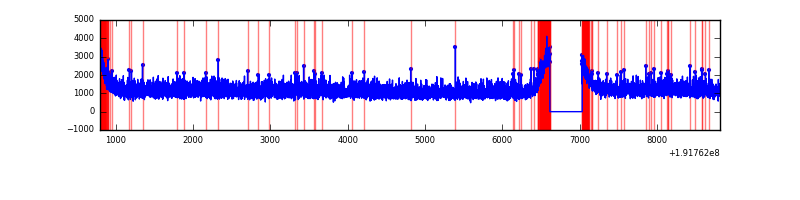 |
| D | 8014 | 7594 | 379 | 379 | 4.73% | 4.99% | 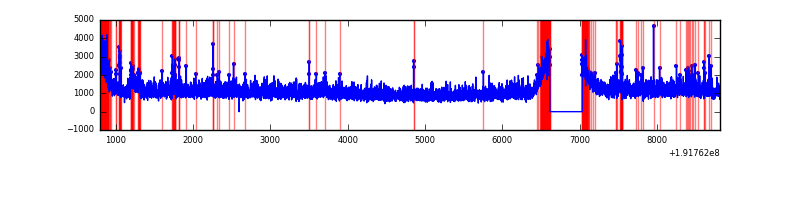 |
Top three noisy pixels from each quadrant. If the there are fewer than three noisy pixels in the level2.evt file, extra rows are filled as -1
| Pixel properties | Quadrant properties | ||||||
|---|---|---|---|---|---|---|---|
| Quadrant | DetID | PixID | Counts | Sigma | Mean | Median | Sigma |
| A | 15 | 236 | 11820 | 15.63 | 2456 | 2470 | 598.2 |
| A | -1 | -1 | -1 | -1.0 | 2456 | 2470 | 598.2 |
| A | -1 | -1 | -1 | -1.0 | 2456 | 2470 | 598.2 |
| B | 8 | 3 | 2281601 | 3794.15 | 2525 | 2538 | 600.7 |
| B | 0 | 220 | 19858 | 28.83 | 2525 | 2538 | 600.7 |
| B | 4 | 48 | 9988 | 12.4 | 2525 | 2538 | 600.7 |
| C | 12 | 4 | 9347 | 10.71 | 2302 | 2384 | 650.2 |
| C | -1 | -1 | -1 | -1.0 | 2302 | 2384 | 650.2 |
| C | -1 | -1 | -1 | -1.0 | 2302 | 2384 | 650.2 |
| D | 7 | 34 | 142959 | 200.63 | 2250 | 2336 | 700.9 |
| D | 2 | 54 | 113944 | 159.23 | 2250 | 2336 | 700.9 |
| D | 7 | 85 | 38969 | 52.26 | 2250 | 2336 | 700.9 |
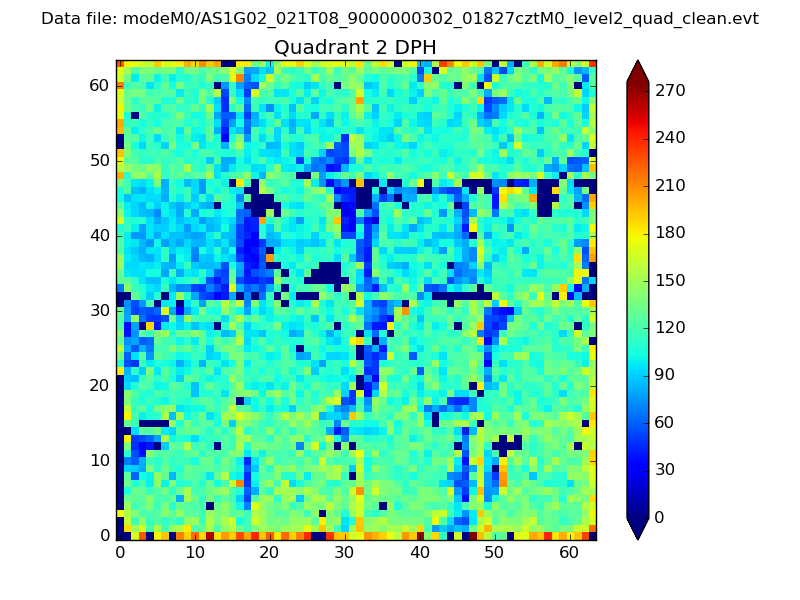
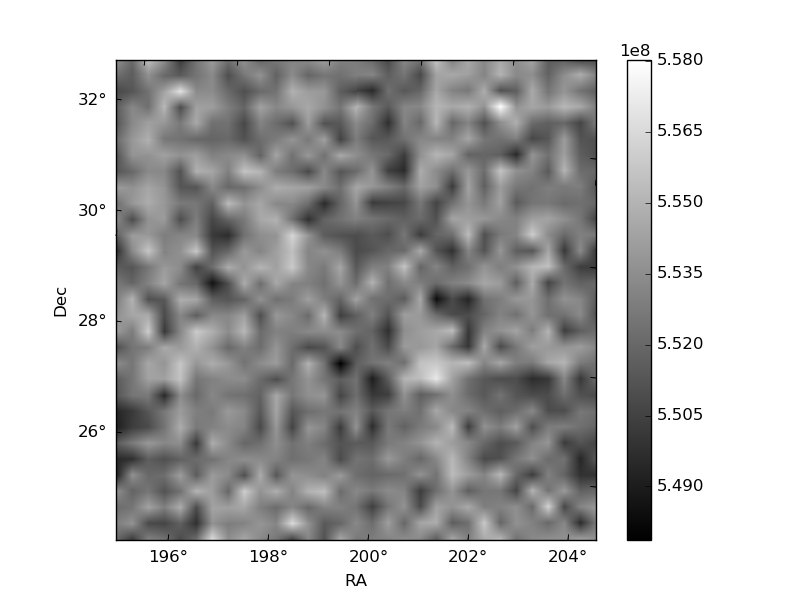
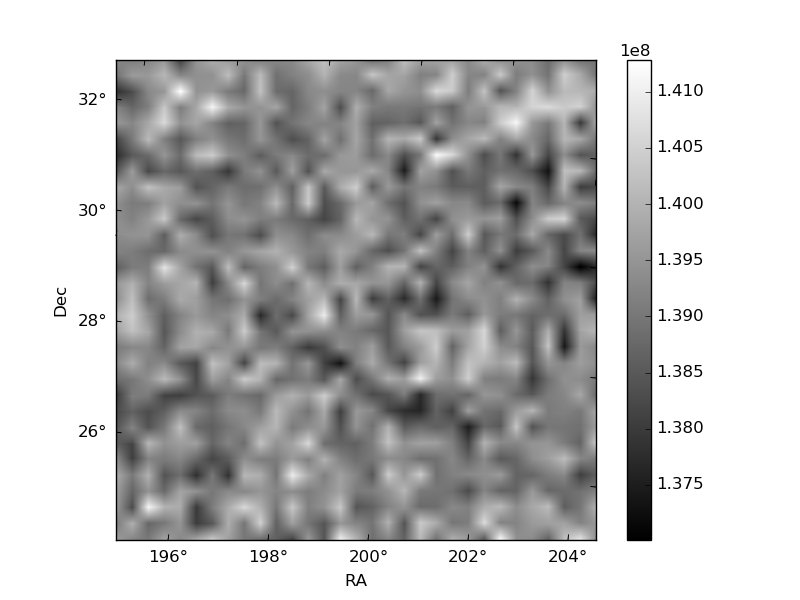
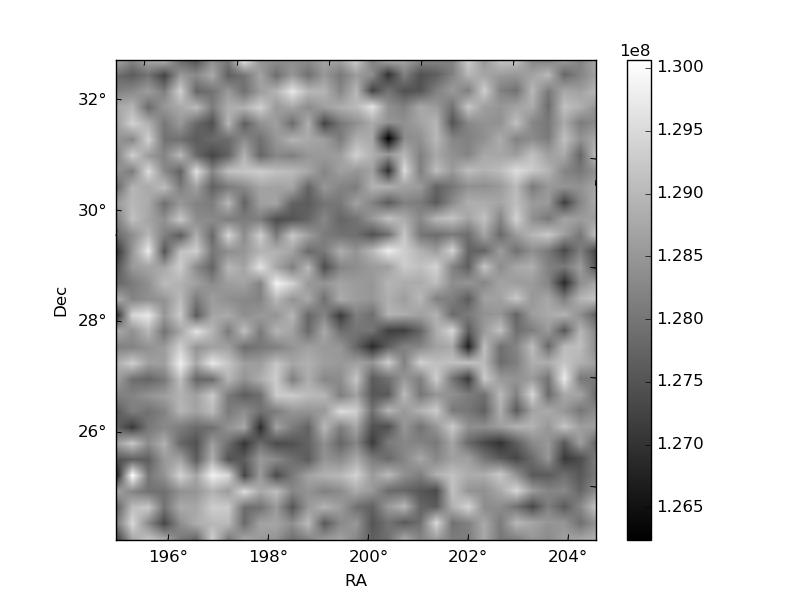
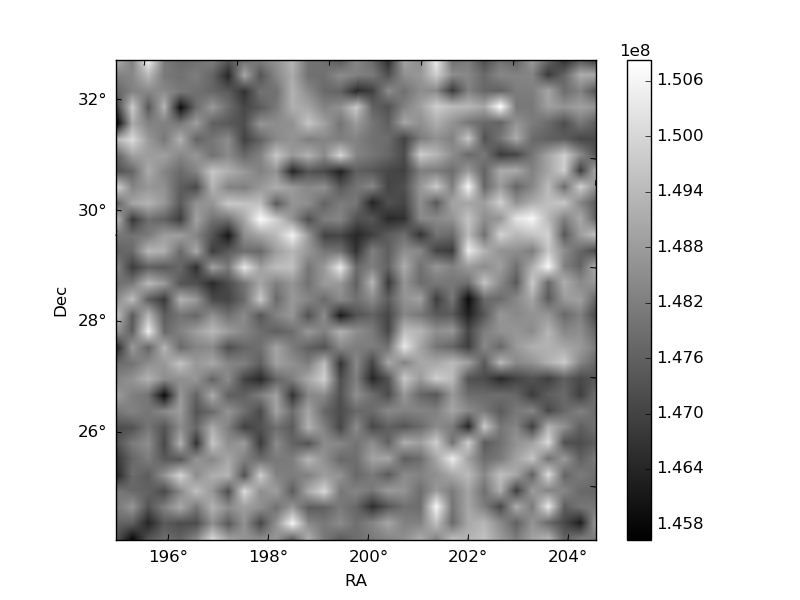
Histogram calculated using DETX and DETY for each event in the final _common_clean file
| Quadrant A | 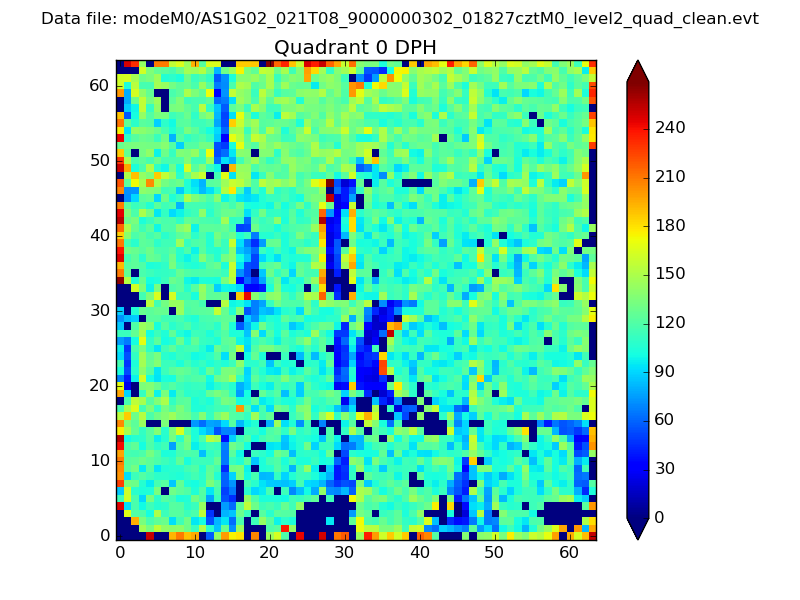 |
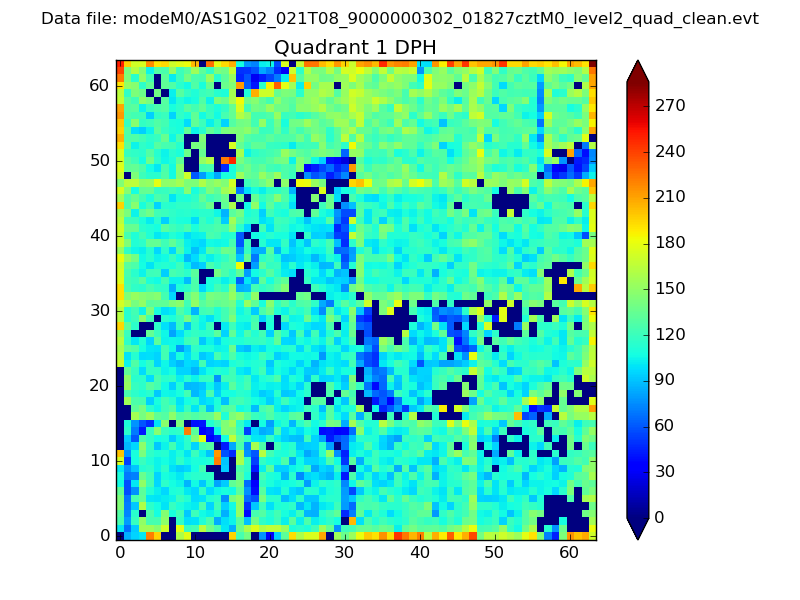 |
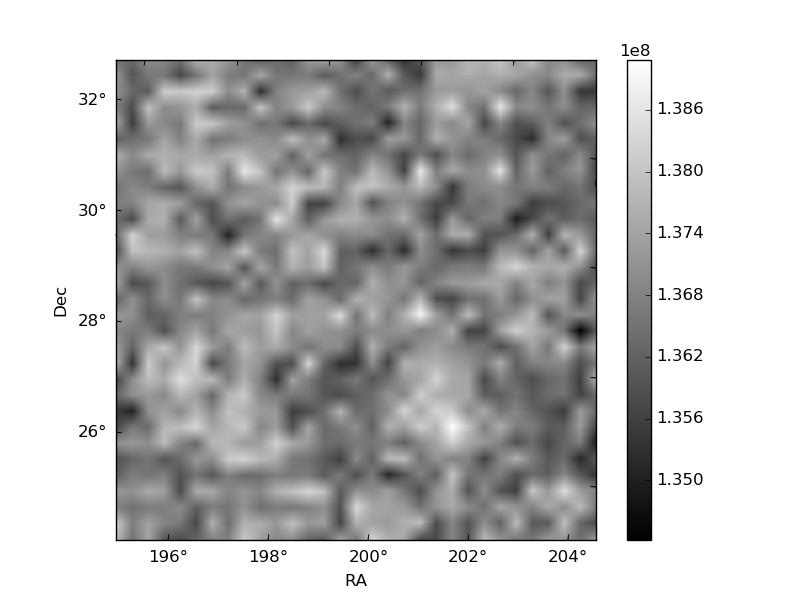
Quadrant B |
|---|---|---|---|
| Quadrant D | 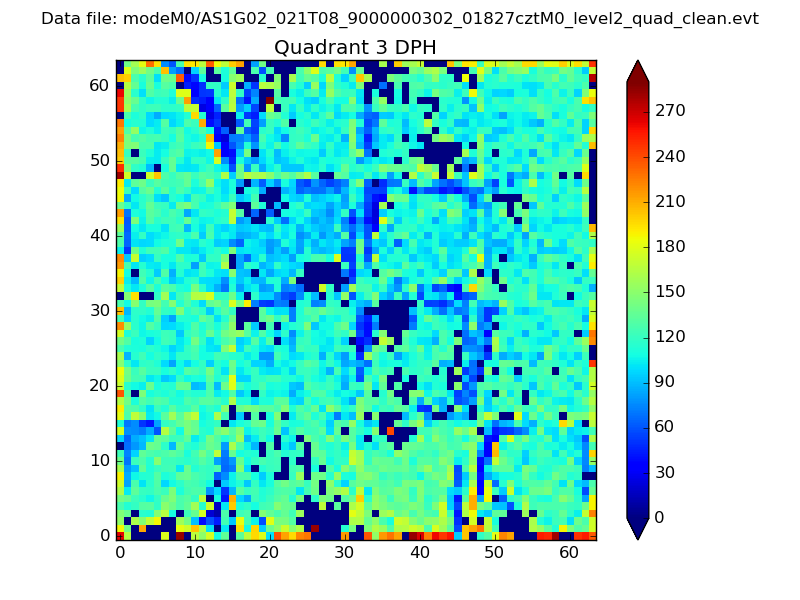 |
 |
Quadrant C |
| Plot type | Count rate plots | Images |
|---|---|---|
| Comparison with Poisson distribution Blue bars denote a histogram of data divided into 1 sec bins. Red curve is a Poisson curve with rate = median count rate of data. |
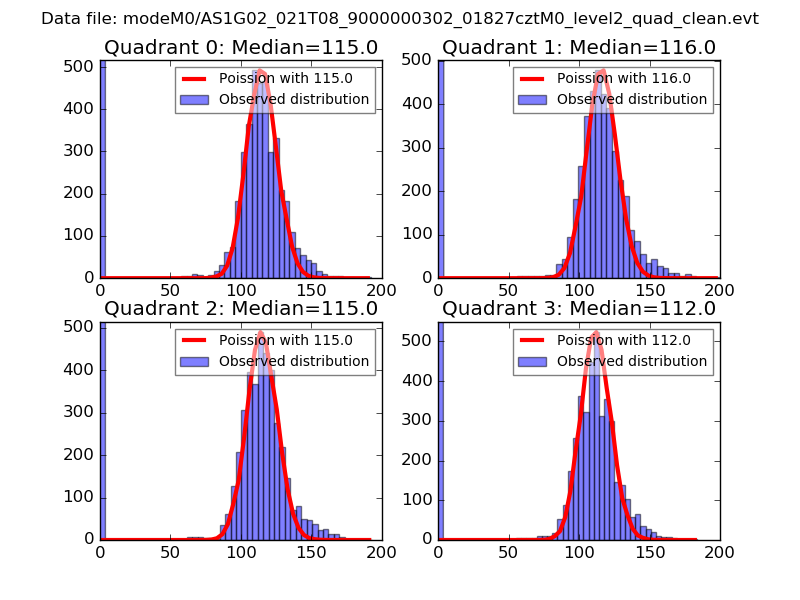 |
 |
| Quadrant-wise count rates Data is divided into 100 sec bins |
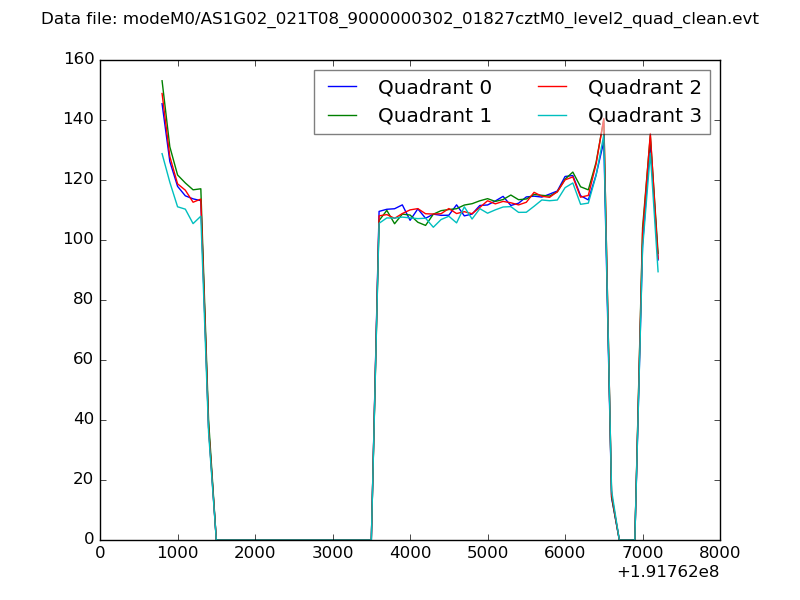 |
|
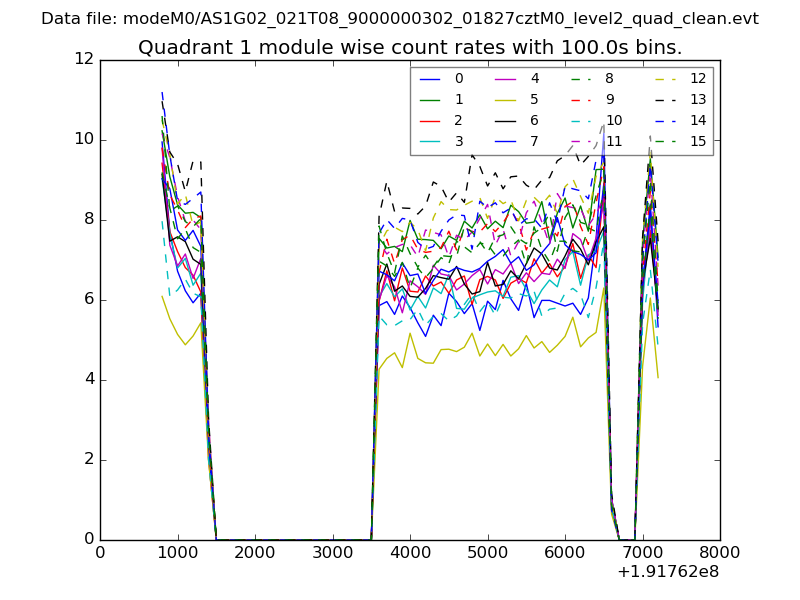
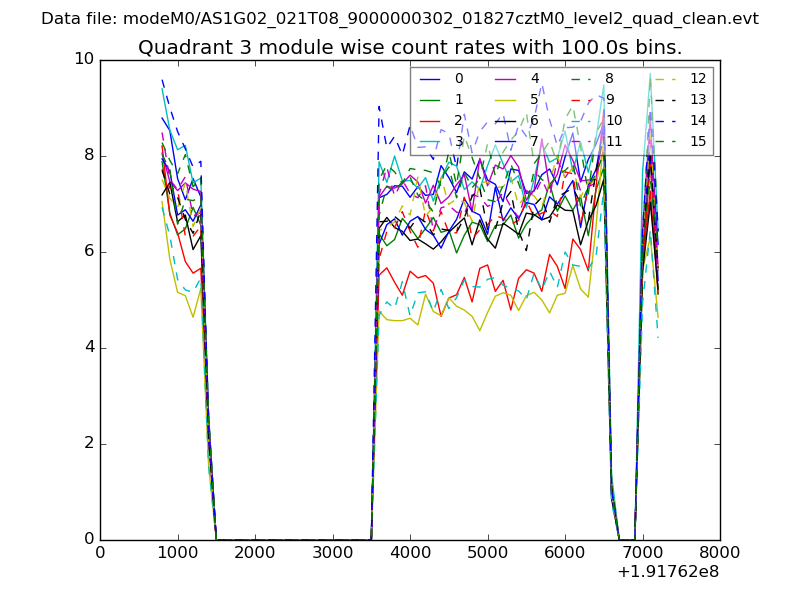
| Module-wise count rates for Quadrant A Data is divided into 100 sec bins |
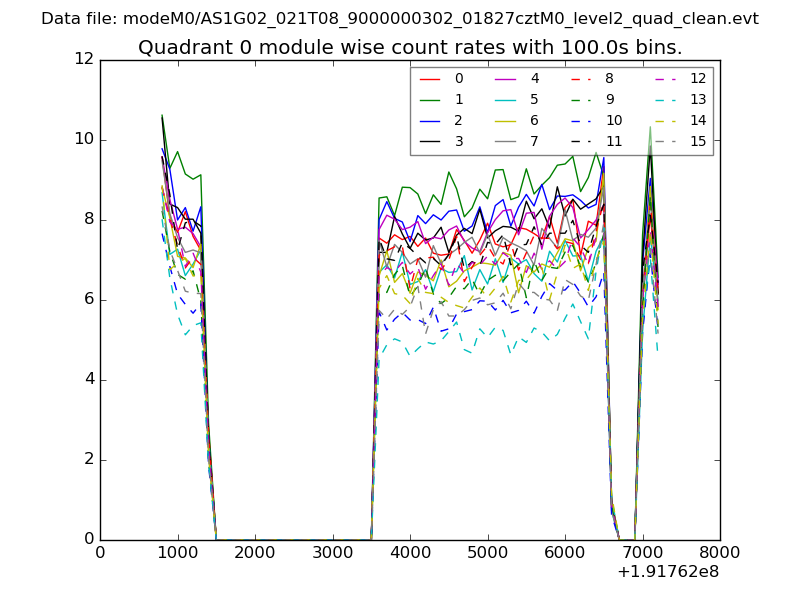 |
 |
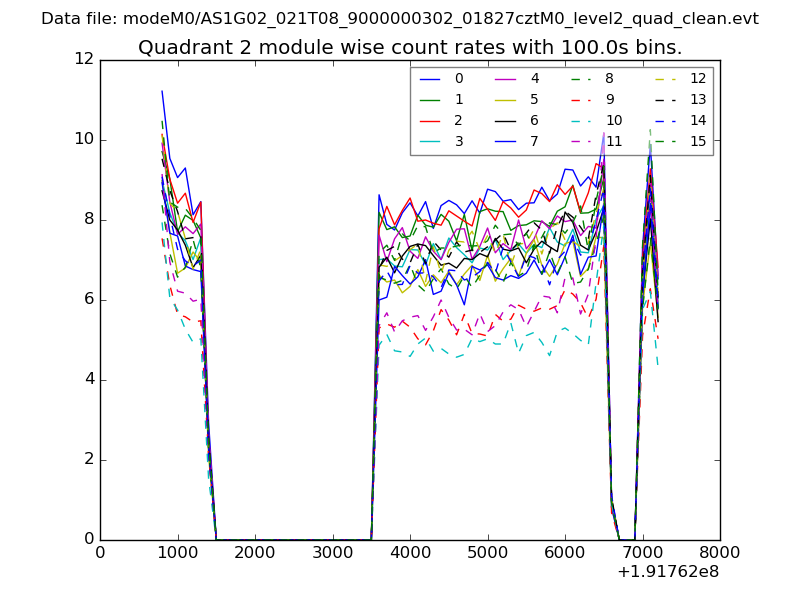
| Module-wise count rates for Quadrant B Data is divided into 100 sec bins |
 |
 |
| Module-wise count rates for Quadrant C Data is divided into 100 sec bins |
 |
 |
| Module-wise count rates for Quadrant D Data is divided into 100 sec bins |
 |
 |
| Parameter | Plot |
|---|---|
| CZT HV Monitor | 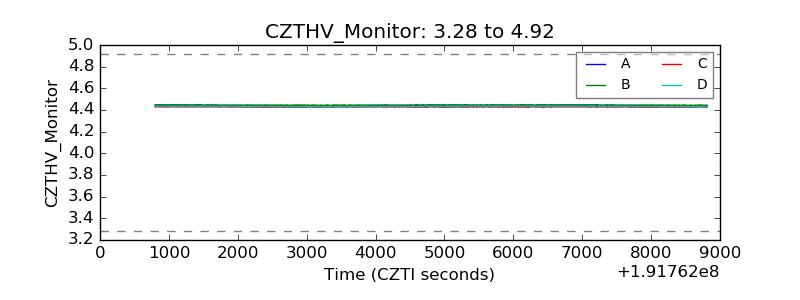 |
| D_VDD | 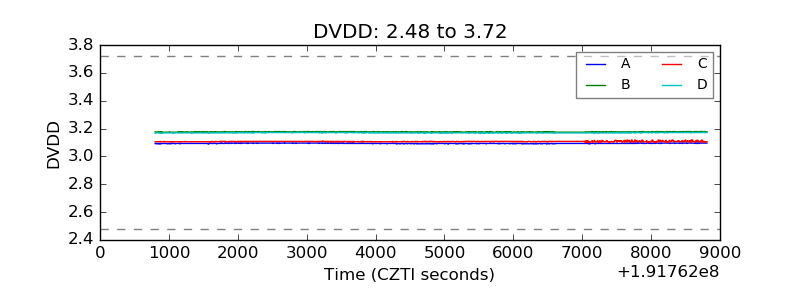 |
| Temperature 1 | 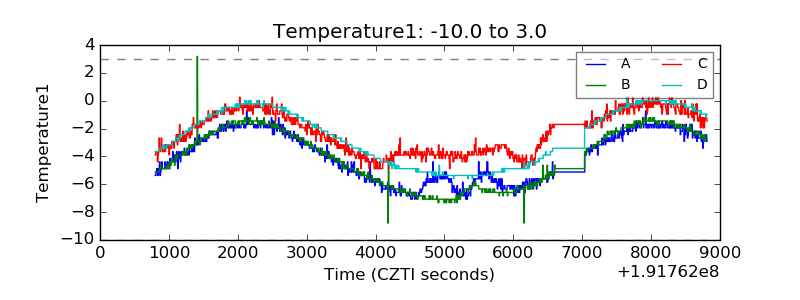 |
| Veto HV Monitor | 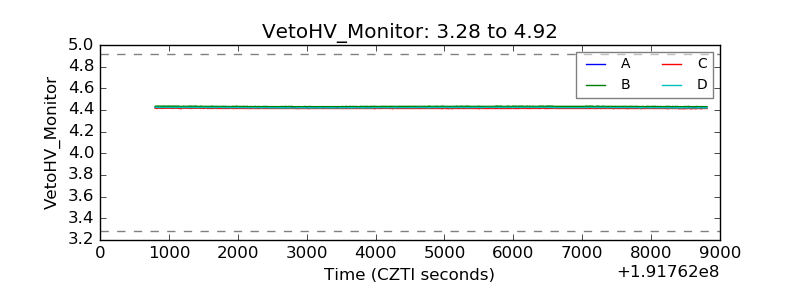 |
| Veto LLD | 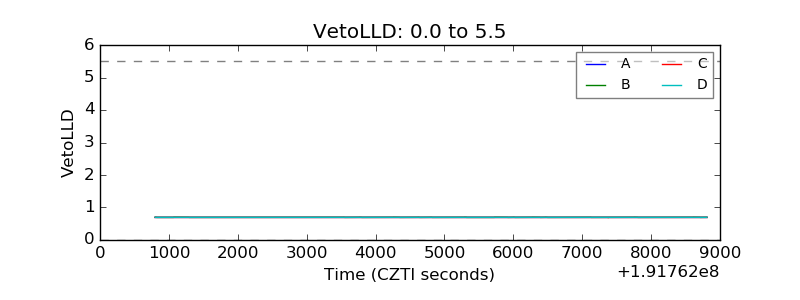 |
| Alpha Counter | 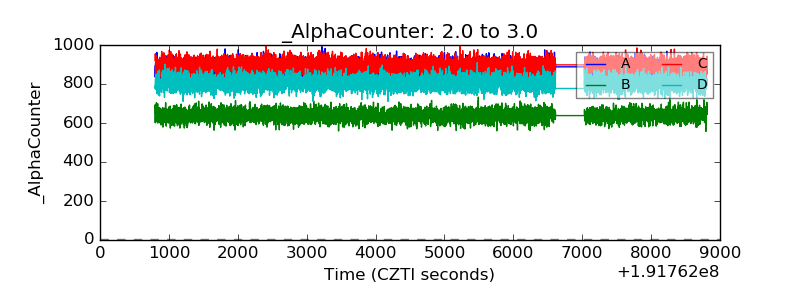 |
| _CPM_Rate | 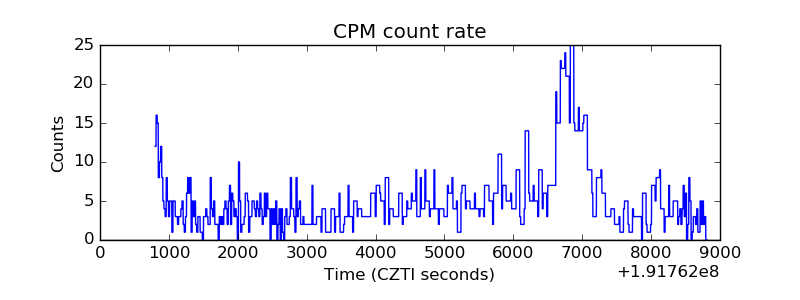 |
| CZT Counter | 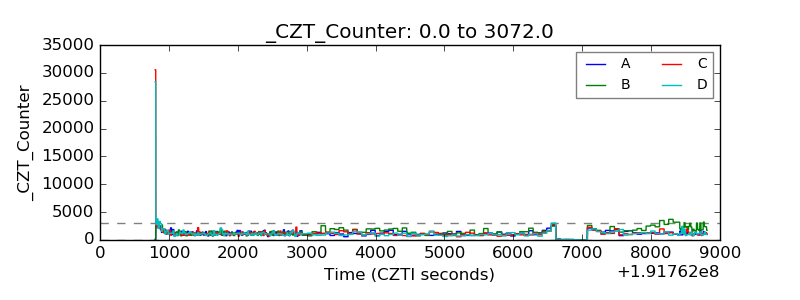 |
| +2.5 Volts monitor | 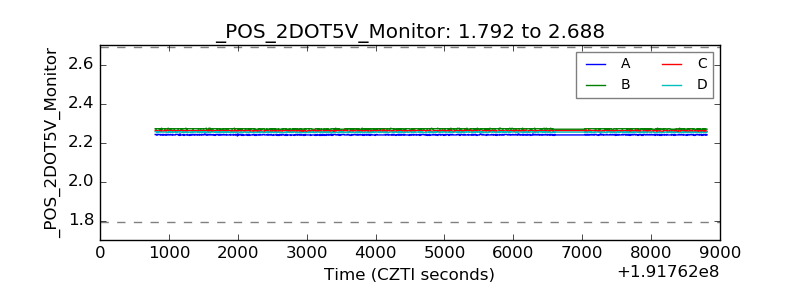 |
| +5 Volts monitor | 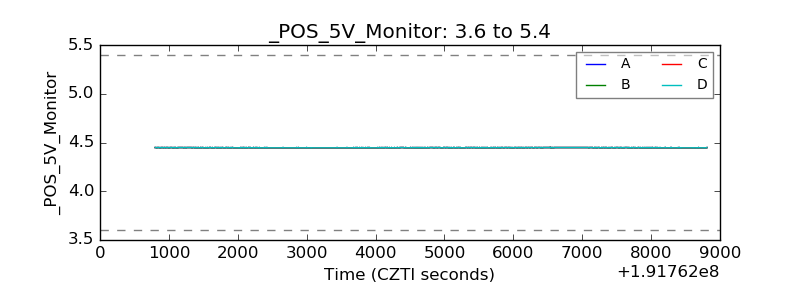 |
| _ROLL_ROT | 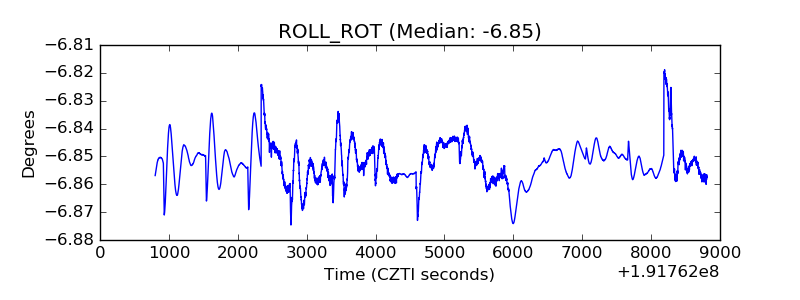 |
| _Roll_DEC | 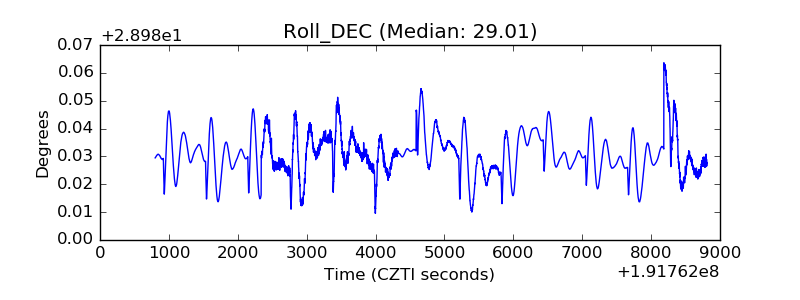 |
| _Roll_RA | 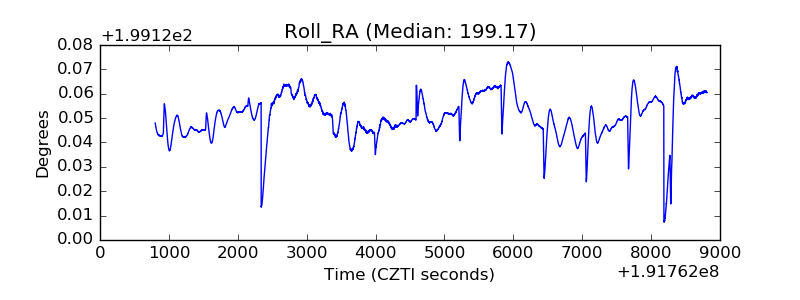 |
| Veto Counter | 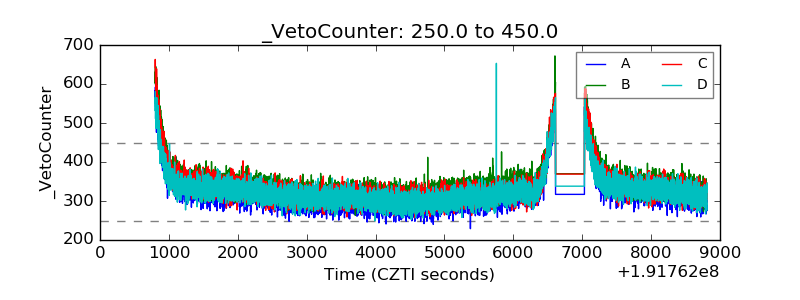 |