| Param | Original file | Final file |
|---|---|---|
| Filename | modeM0/AS1G02_021T08_9000000302_01828cztM0_level2.evt | modeM0/AS1G02_021T08_9000000302_01828cztM0_level2_quad_clean.evt |
| Size (bytes) | 1,367,930,880 | 71,187,840 |
| Size | 1.3 GB | 67.9 MB |
| Events in quadrant A | 9,434,290 | 409,336 |
| Events in quadrant B | 13,436,426 | 411,813 |
| Events in quadrant C | 9,035,339 | 409,655 |
| Events in quadrant D | 9,024,572 | 399,734 |
| Mode M9 | |||
|---|---|---|---|
| Quadrant | BADHDUFLAG | Total packets | Discarded packets |
| A | 0 | 1 | 0 |
| B | 0 | 1 | 0 |
| C | 0 | 1 | 0 |
| D | 0 | 1 | 0 |
| Mode M0 | |||
|---|---|---|---|
| Quadrant | BADHDUFLAG | Total packets | Discarded packets |
| A | 0 | 33389 | 3 |
| B | 0 | 45233 | 2 |
| C | 0 | 32172 | 2 |
| D | 0 | 32239 | 2 |
| Mode SS | |||
|---|---|---|---|
| Quadrant | BADHDUFLAG | Total packets | Discarded packets |
| A | 0 | 154 | 0 |
| B | 0 | 154 | 0 |
| C | 0 | 154 | 0 |
| D | 0 | 154 | 0 |
| Quadrant | Total seconds | Saturated seconds | Saturation percentage |
|---|---|---|---|
| A | 7540 | 55 | 0.729443% |
| B | 7540 | 429 | 5.689655% |
| C | 7540 | 71 | 0.941645% |
| D | 7540 | 106 | 1.405836% |
Noise dominated data is calculated using 1-second bins in cleaned event files. If a bin has >2000 counts, and if more than 50% of those come from <1% of pixels, then it is considered to be noise-dominated and hence unusable.
| Quadrant | # 1 sec bins | Bins with >0 counts | Bins with >2000 counts | High rate bins dominated by noise | Noise dominated (total time) | Noise dominated (detector-on time) | Marked lightcurve |
|---|---|---|---|---|---|---|---|
| A | 7675 | 7544 | 423 | 423 | 5.51% | 5.61% | 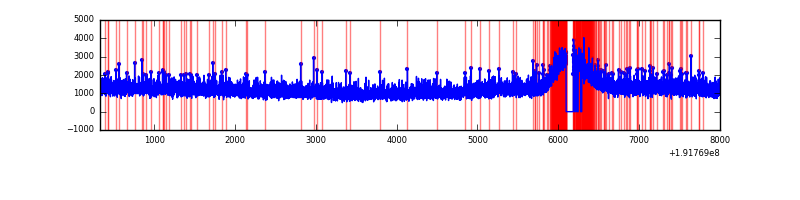 |
| B | 7675 | 7544 | 2563 | 2563 | 33.39% | 33.97% | 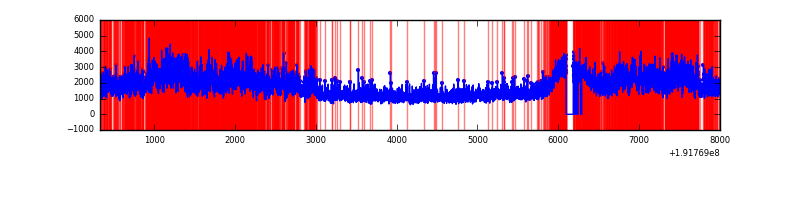 |
| C | 7675 | 7544 | 371 | 371 | 4.83% | 4.92% | 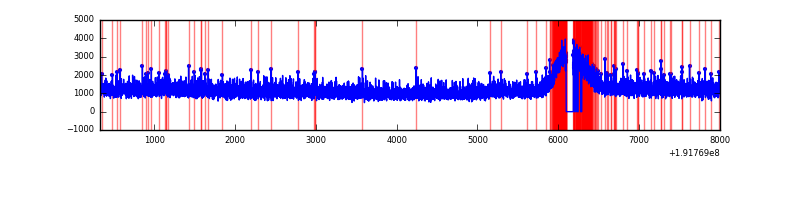 |
| D | 7675 | 7544 | 444 | 444 | 5.79% | 5.89% | 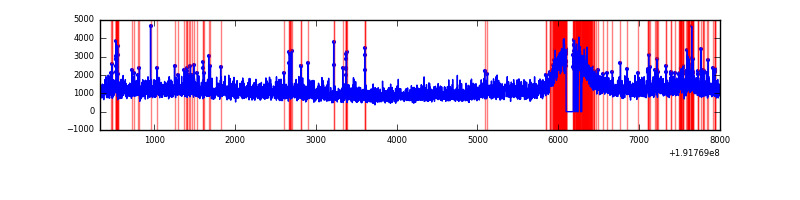 |
Top three noisy pixels from each quadrant. If the there are fewer than three noisy pixels in the level2.evt file, extra rows are filled as -1
| Pixel properties | Quadrant properties | ||||||
|---|---|---|---|---|---|---|---|
| Quadrant | DetID | PixID | Counts | Sigma | Mean | Median | Sigma |
| A | 12 | 251 | 16436 | 23.42 | 2460 | 2477 | 596.0 |
| A | 10 | 2 | 9087 | 11.09 | 2460 | 2477 | 596.0 |
| A | 0 | 5 | 6657 | 7.01 | 2460 | 2477 | 596.0 |
| B | 8 | 3 | 3800007 | 6338.93 | 2533 | 2546 | 599.1 |
| B | 0 | 220 | 16721 | 23.66 | 2533 | 2546 | 599.1 |
| B | 0 | 229 | 10761 | 13.71 | 2533 | 2546 | 599.1 |
| C | 12 | 4 | 12599 | 15.67 | 2311 | 2393 | 651.3 |
| C | 7 | 159 | 6273 | 5.96 | 2311 | 2393 | 651.3 |
| C | -1 | -1 | -1 | -1.0 | 2311 | 2393 | 651.3 |
| D | 7 | 85 | 185246 | 256.7 | 2279 | 2363 | 712.5 |
| D | 13 | 105 | 117282 | 161.3 | 2279 | 2363 | 712.5 |
| D | 14 | 3 | 87462 | 119.45 | 2279 | 2363 | 712.5 |
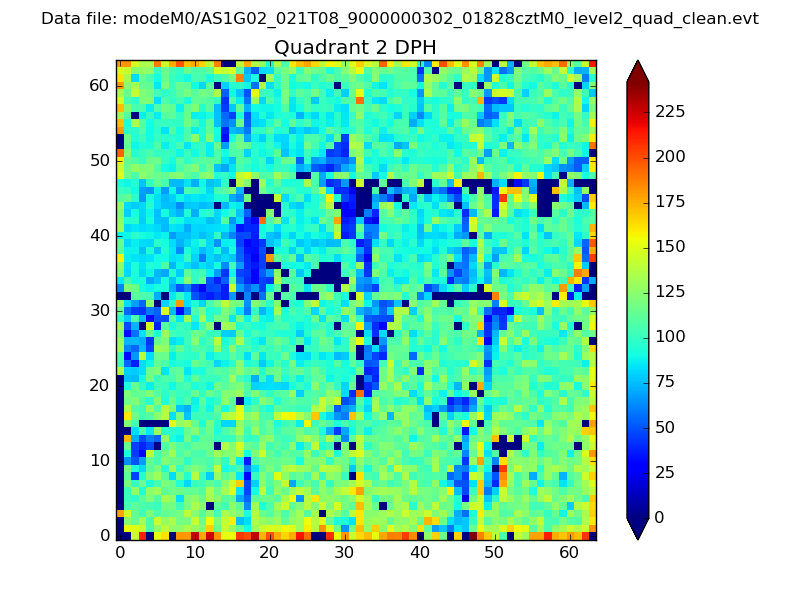
Histogram calculated using DETX and DETY for each event in the final _common_clean file
| Quadrant A | 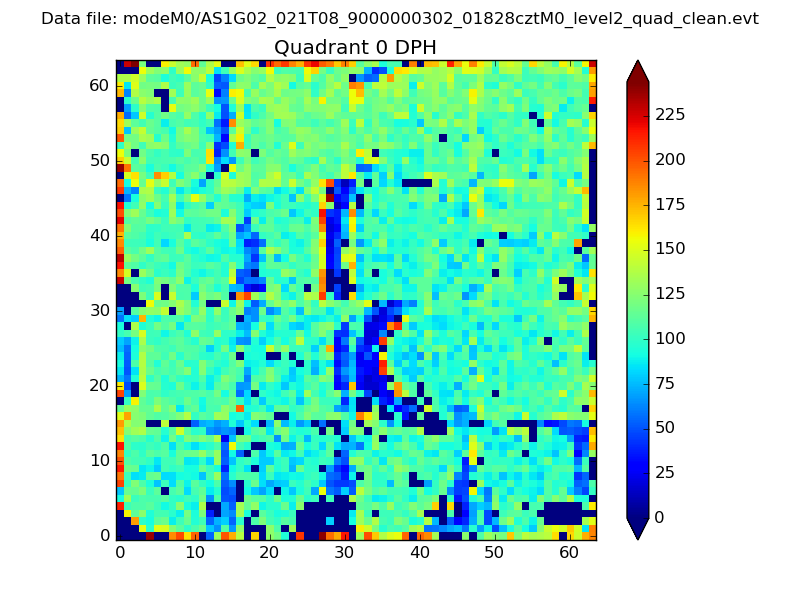 |
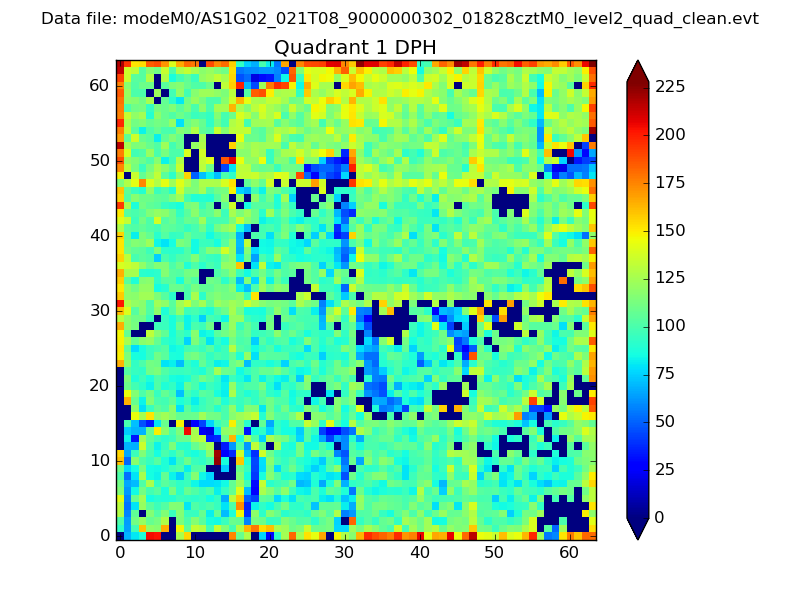 |
Quadrant B |
|---|---|---|---|
| Quadrant D | 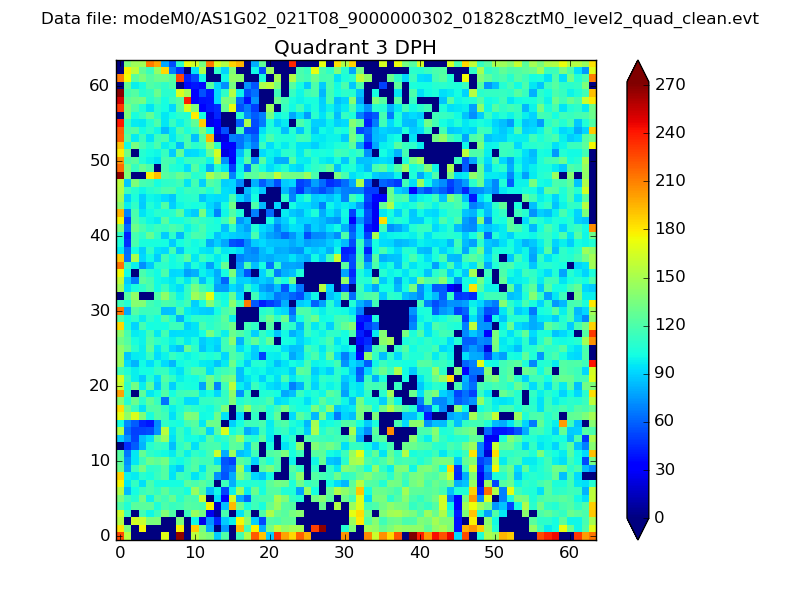 |
 |
Quadrant C |
| Plot type | Count rate plots | Images |
|---|---|---|
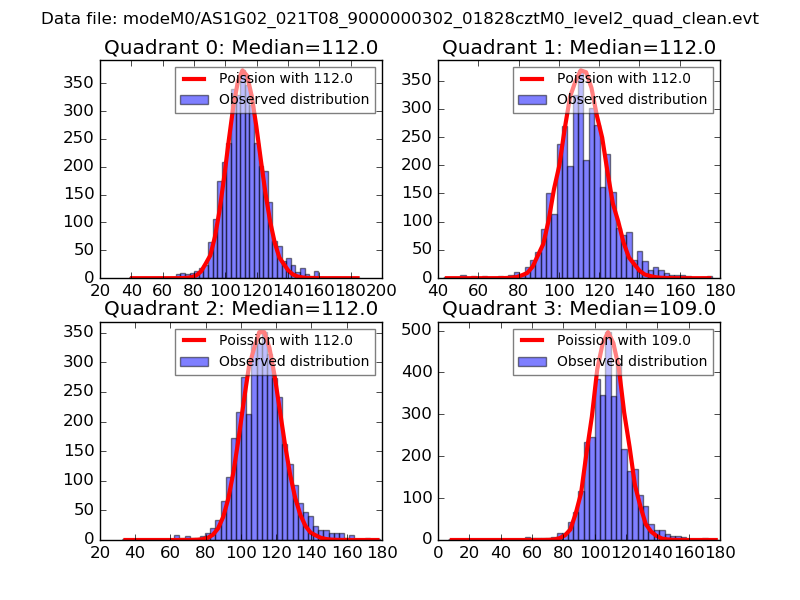
| Comparison with Poisson distribution Blue bars denote a histogram of data divided into 1 sec bins. Red curve is a Poisson curve with rate = median count rate of data. |
 |
 |
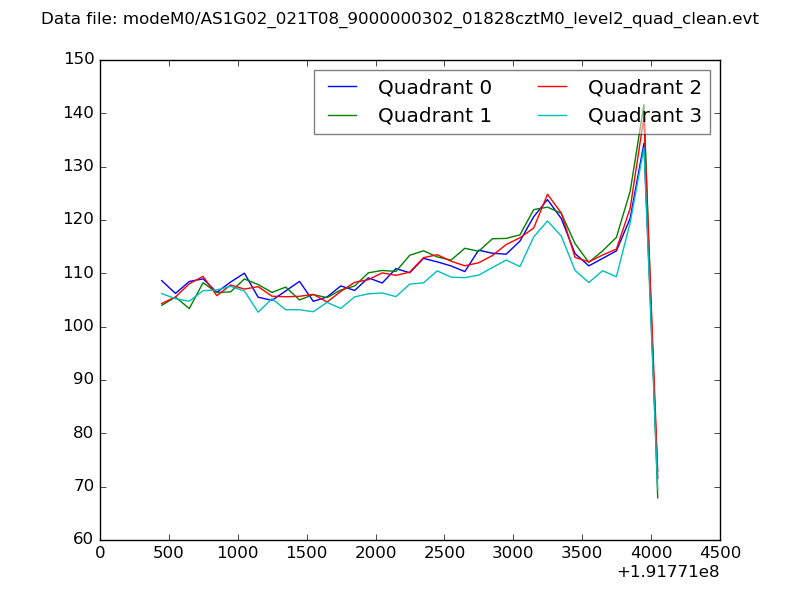
| Quadrant-wise count rates Data is divided into 100 sec bins |
 |
|
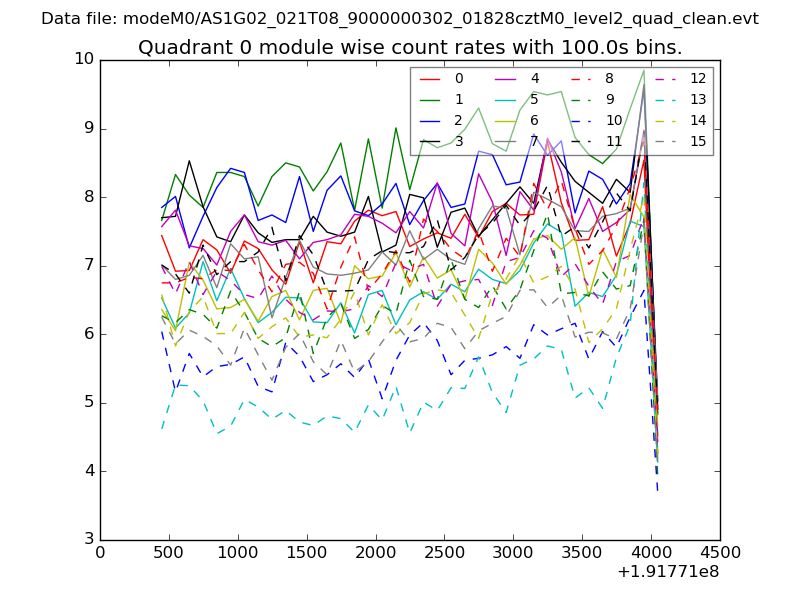
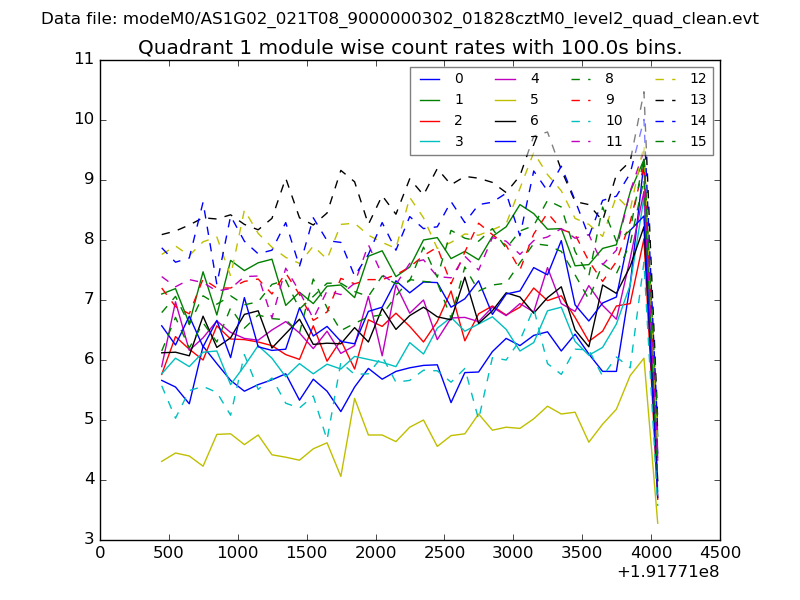
| Module-wise count rates for Quadrant A Data is divided into 100 sec bins |
 |
 |
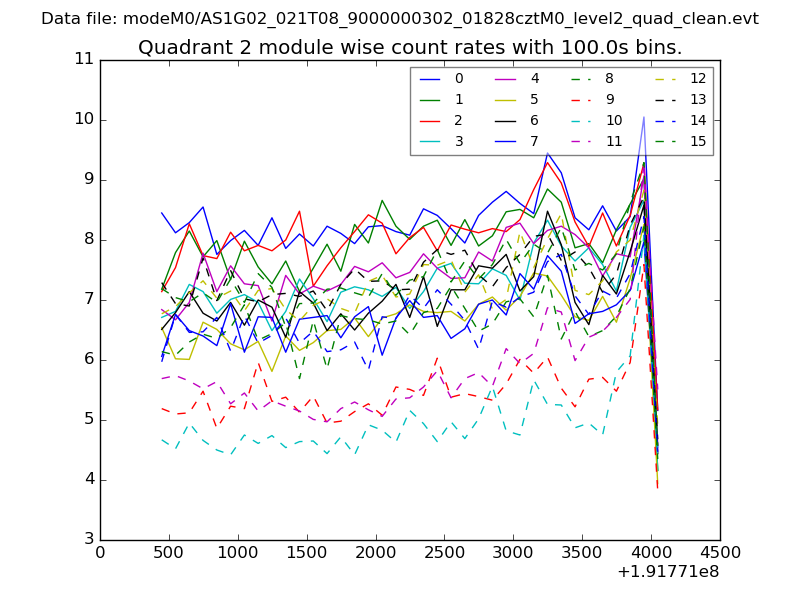
| Module-wise count rates for Quadrant B Data is divided into 100 sec bins |
 |
 |
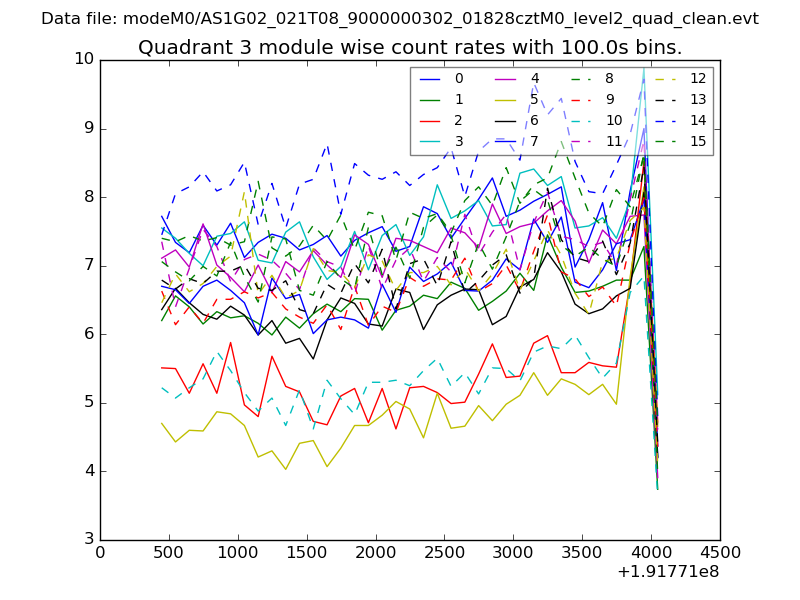
| Module-wise count rates for Quadrant C Data is divided into 100 sec bins |
 |
 |
| Module-wise count rates for Quadrant D Data is divided into 100 sec bins |
 |
 |
| Parameter | Plot |
|---|---|
| CZT HV Monitor | 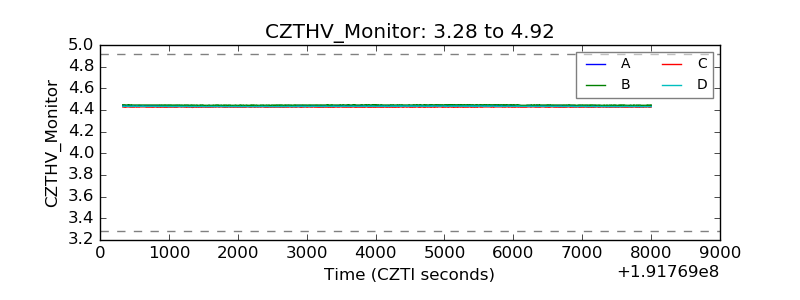 |
| D_VDD | 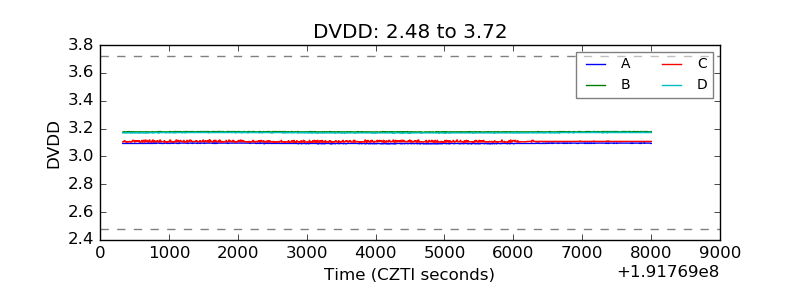 |
| Temperature 1 | 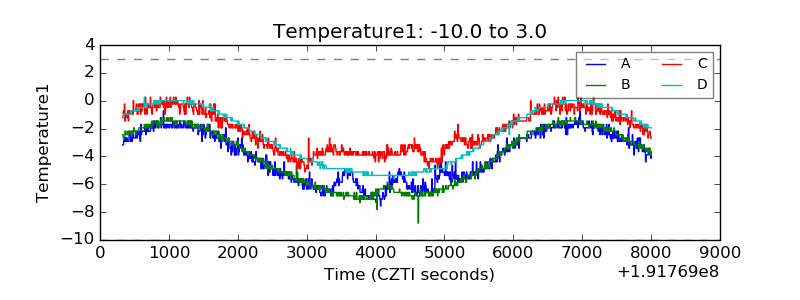 |
| Veto HV Monitor | 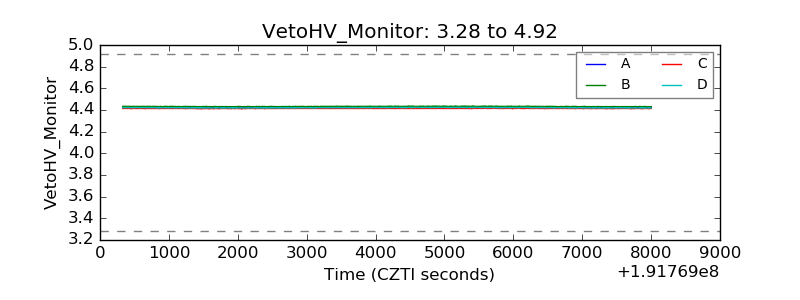 |
| Veto LLD | 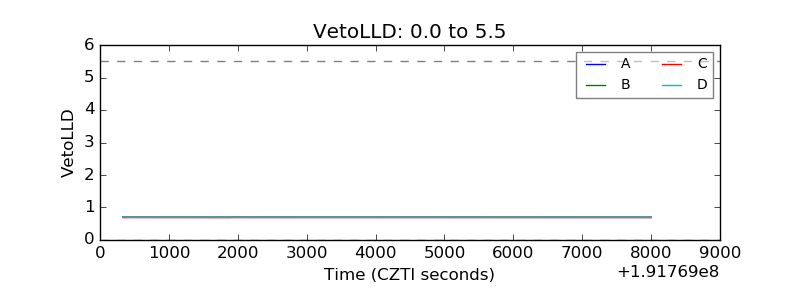 |
| Alpha Counter | 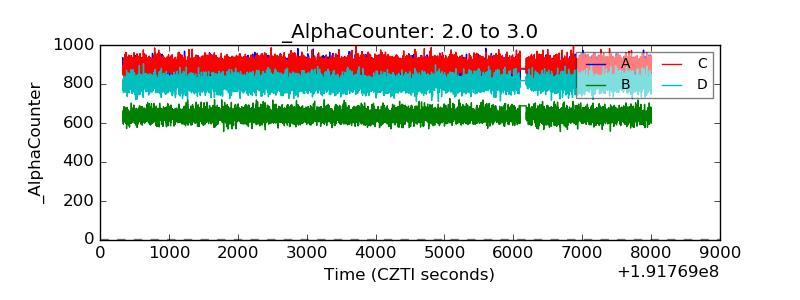 |
| _CPM_Rate | 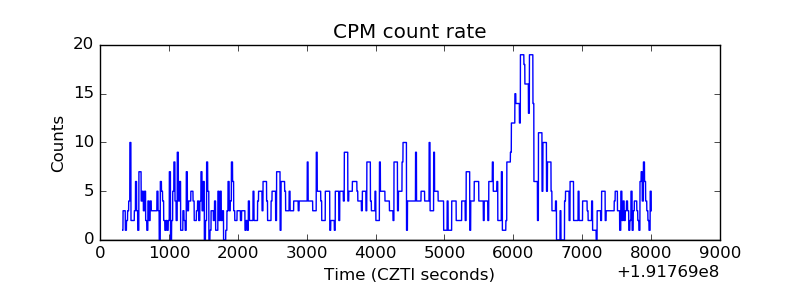 |
| CZT Counter |  |
| +2.5 Volts monitor | 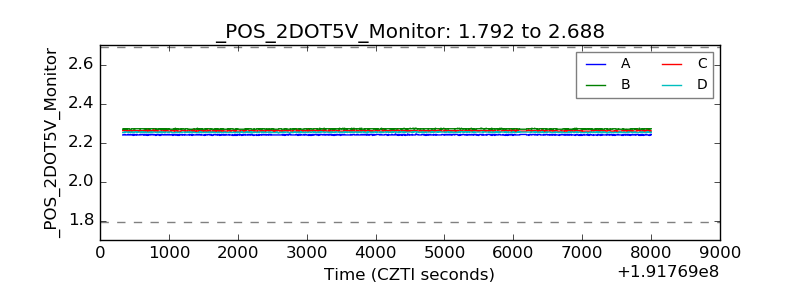 |
| +5 Volts monitor |  |
| _ROLL_ROT | 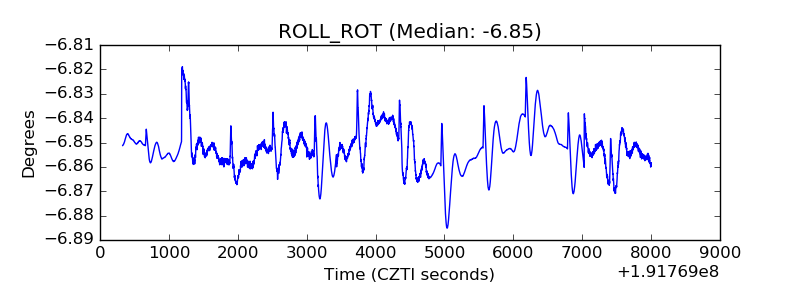 |
| _Roll_DEC | 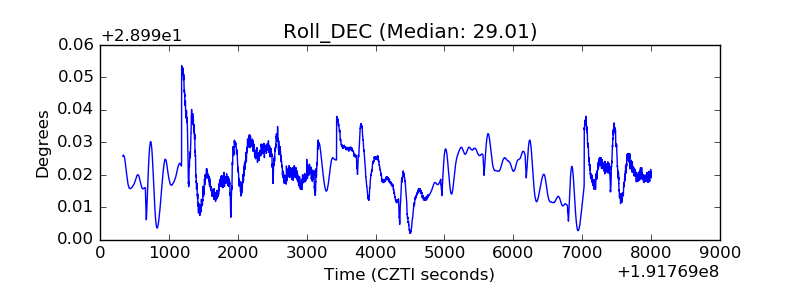 |
| _Roll_RA | 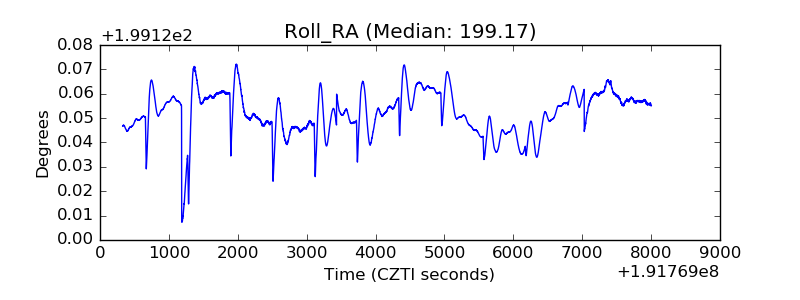 |
| Veto Counter |  |