| Param | Original file | Final file |
|---|---|---|
| Filename | modeM0/AS1G02_021T08_9000000302_01829cztM0_level2.evt | modeM0/AS1G02_021T08_9000000302_01829cztM0_level2_quad_clean.evt |
| Size (bytes) | 1,213,130,880 | 70,295,040 |
| Size | 1.1 GB | 67.0 MB |
| Events in quadrant A | 8,448,464 | 412,832 |
| Events in quadrant B | 11,651,858 | 413,850 |
| Events in quadrant C | 8,142,554 | 412,380 |
| Events in quadrant D | 8,036,571 | 403,783 |
| Mode M9 | |||
|---|---|---|---|
| Quadrant | BADHDUFLAG | Total packets | Discarded packets |
| A | 0 | 1 | 0 |
| B | 1 | 1 | 0 |
| C | 1 | -1 | -1 |
| D | 1 | -1 | -1 |
| Mode M0 | |||
|---|---|---|---|
| Quadrant | BADHDUFLAG | Total packets | Discarded packets |
| A | 0 | 30034 | 1 |
| B | 0 | 39494 | 9 |
| C | 0 | 29149 | 1 |
| D | 0 | 28845 | 1 |
| Mode SS | |||
|---|---|---|---|
| Quadrant | BADHDUFLAG | Total packets | Discarded packets |
| A | 0 | 140 | 0 |
| B | 0 | 140 | 0 |
| C | 0 | 140 | 0 |
| D | 0 | 140 | 0 |
| Quadrant | Total seconds | Saturated seconds | Saturation percentage |
|---|---|---|---|
| A | 6967 | 16 | 0.229654% |
| B | 6965 | 273 | 3.919598% |
| C | 6967 | 22 | 0.315774% |
| D | 6967 | 20 | 0.287068% |
Noise dominated data is calculated using 1-second bins in cleaned event files. If a bin has >2000 counts, and if more than 50% of those come from <1% of pixels, then it is considered to be noise-dominated and hence unusable.
| Quadrant | # 1 sec bins | Bins with >0 counts | Bins with >2000 counts | High rate bins dominated by noise | Noise dominated (total time) | Noise dominated (detector-on time) | Marked lightcurve |
|---|---|---|---|---|---|---|---|
| A | 7282 | 6968 | 277 | 277 | 3.80% | 3.98% | 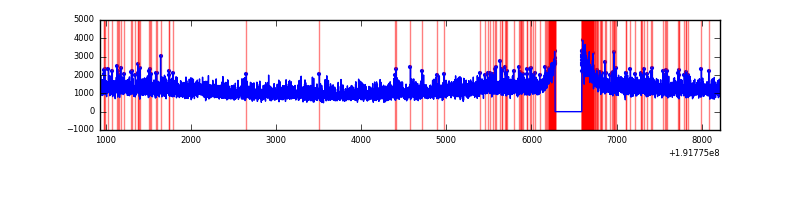 |
| B | 7282 | 6967 | 1816 | 1816 | 24.94% | 26.07% | 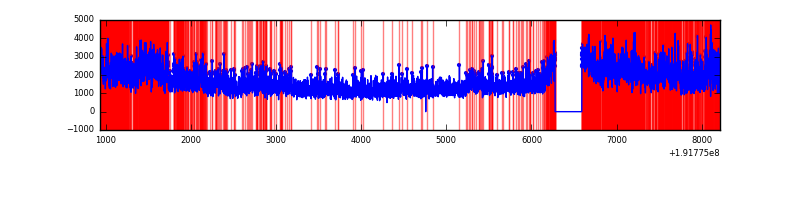 |
| C | 7282 | 6968 | 232 | 232 | 3.19% | 3.33% | 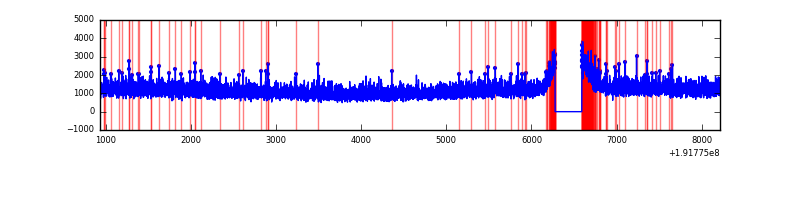 |
| D | 7282 | 6968 | 302 | 302 | 4.15% | 4.33% | 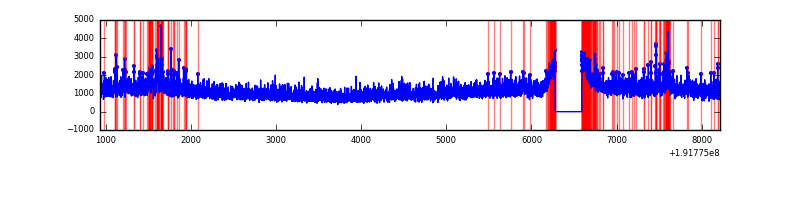 |
Top three noisy pixels from each quadrant. If the there are fewer than three noisy pixels in the level2.evt file, extra rows are filled as -1
| Pixel properties | Quadrant properties | ||||||
|---|---|---|---|---|---|---|---|
| Quadrant | DetID | PixID | Counts | Sigma | Mean | Median | Sigma |
| A | 10 | 2 | 9130 | 12.92 | 2205 | 2220 | 534.9 |
| A | 8 | 16 | 6500 | 8.0 | 2205 | 2220 | 534.9 |
| A | 0 | 5 | 5433 | 6.01 | 2205 | 2220 | 534.9 |
| B | 8 | 3 | 3035835 | 5645.75 | 2273 | 2282 | 537.3 |
| B | 4 | 48 | 7403 | 9.53 | 2273 | 2282 | 537.3 |
| B | 0 | 220 | 6684 | 8.19 | 2273 | 2282 | 537.3 |
| D | 7 | 85 | 192355 | 299.23 | 2036 | 2110 | 635.8 |
| D | 13 | 105 | 133831 | 207.18 | 2036 | 2110 | 635.8 |
| D | 14 | 3 | 71700 | 109.46 | 2036 | 2110 | 635.8 |
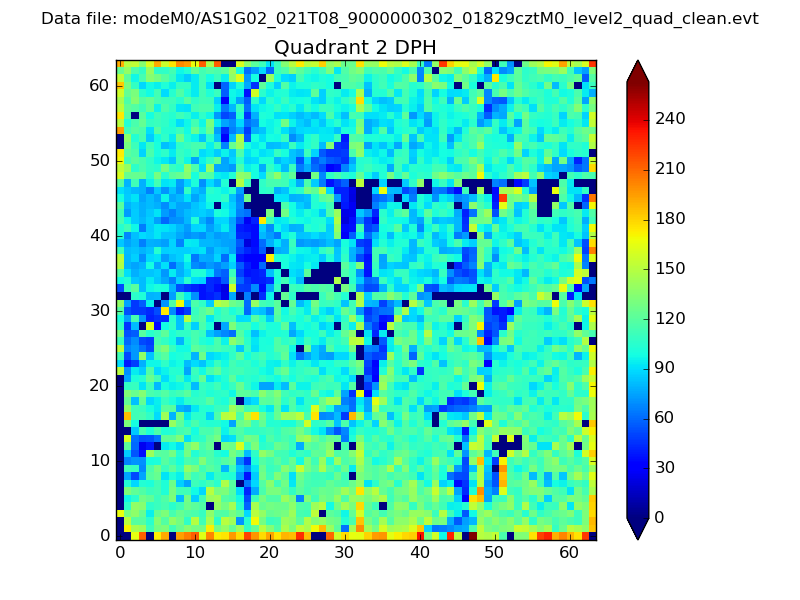
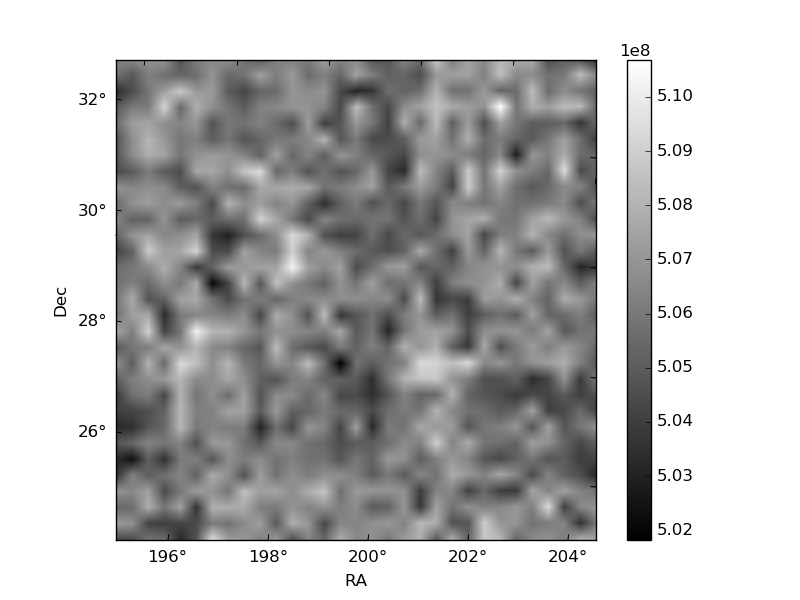
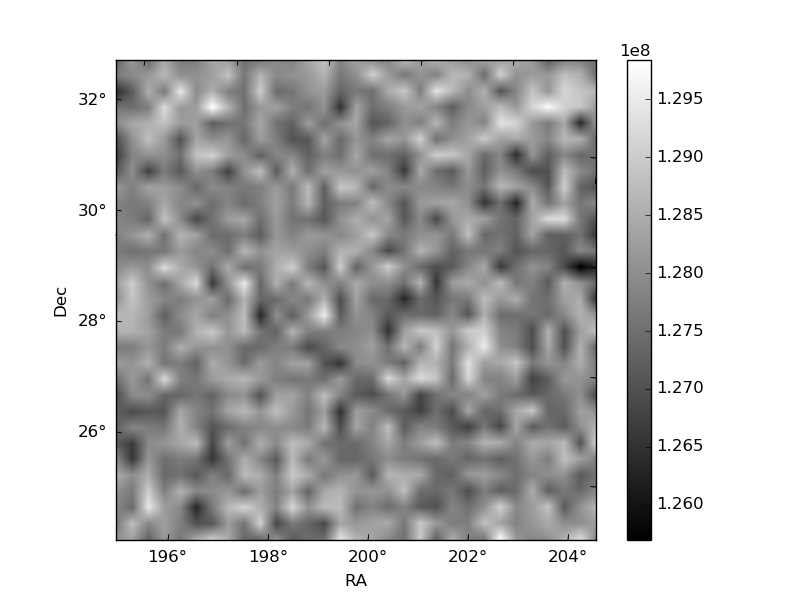
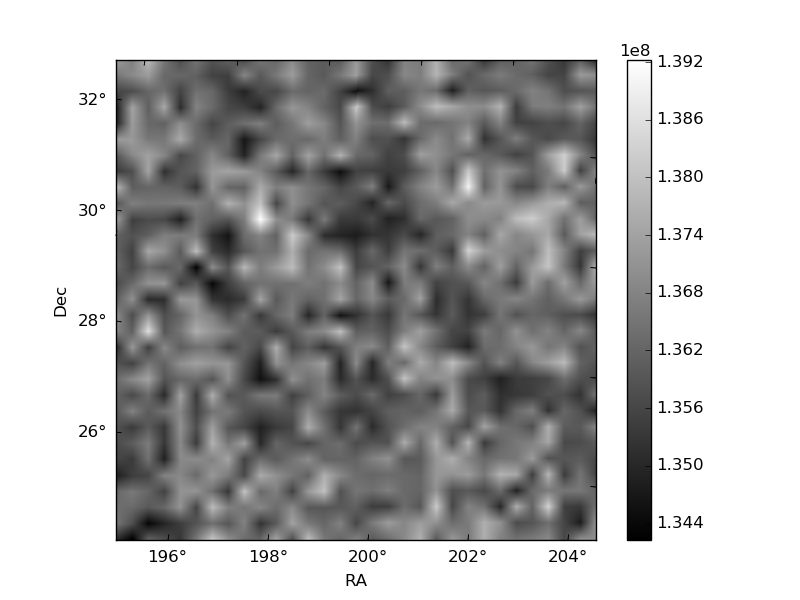
Histogram calculated using DETX and DETY for each event in the final _common_clean file
| Quadrant A | 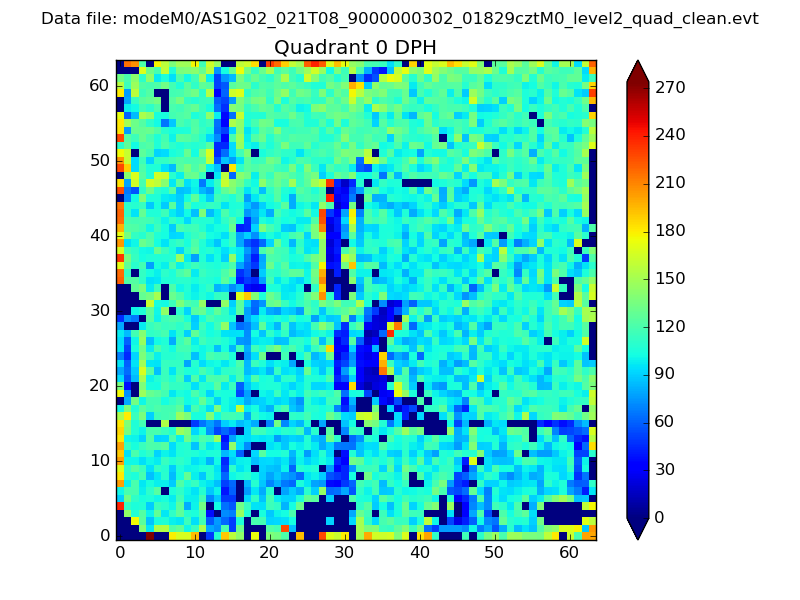 |
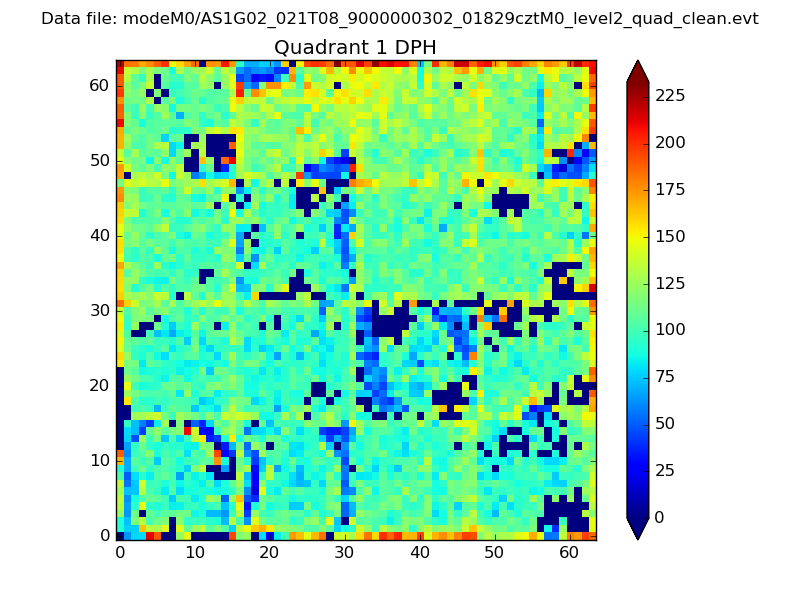 |
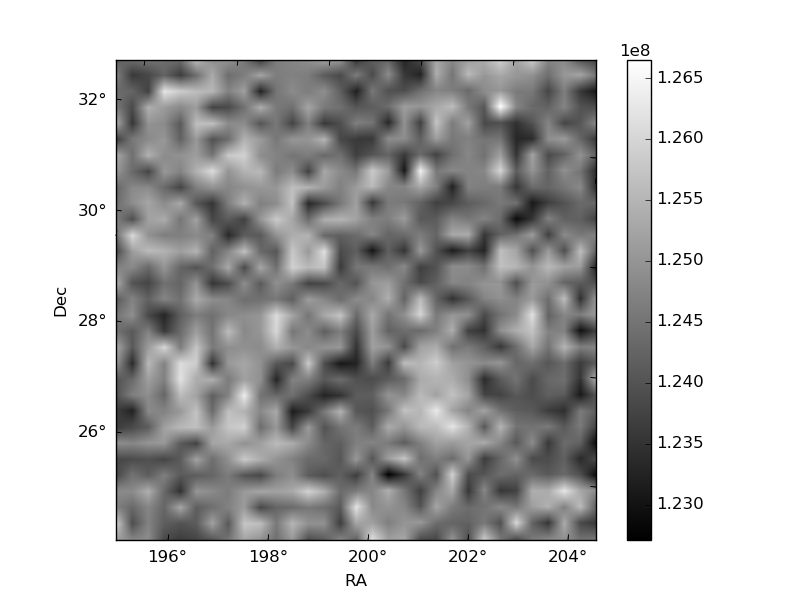
Quadrant B |
|---|---|---|---|
| Quadrant D | 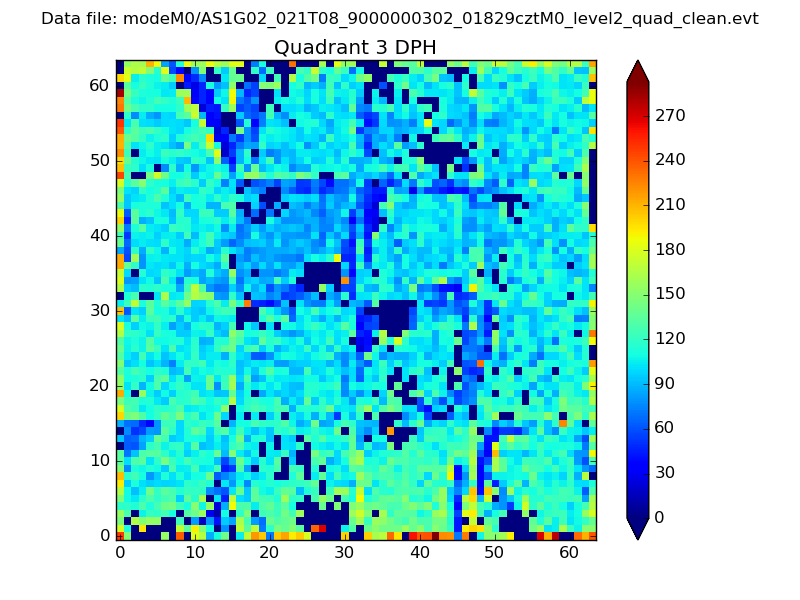 |
 |
Quadrant C |
| Plot type | Count rate plots | Images |
|---|---|---|
| Comparison with Poisson distribution Blue bars denote a histogram of data divided into 1 sec bins. Red curve is a Poisson curve with rate = median count rate of data. |
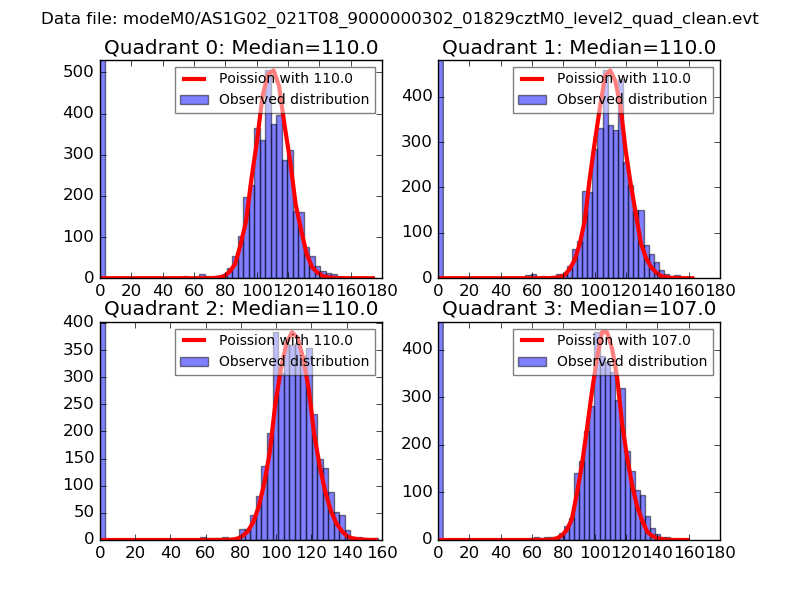 |
 |
| Quadrant-wise count rates Data is divided into 100 sec bins |
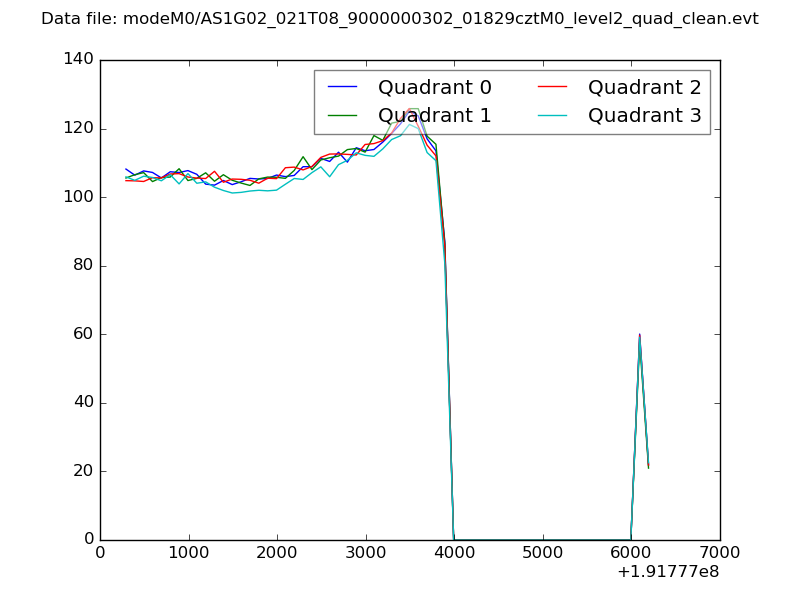 |
|
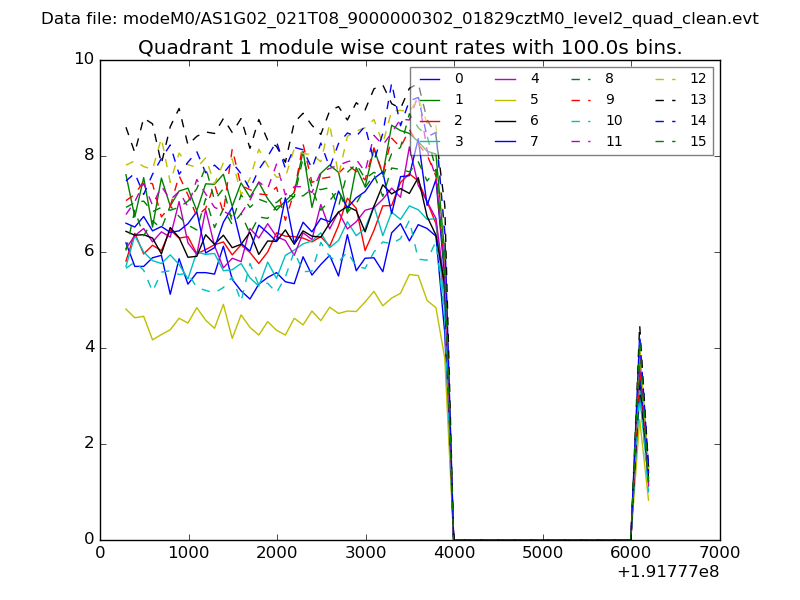
| Module-wise count rates for Quadrant A Data is divided into 100 sec bins |
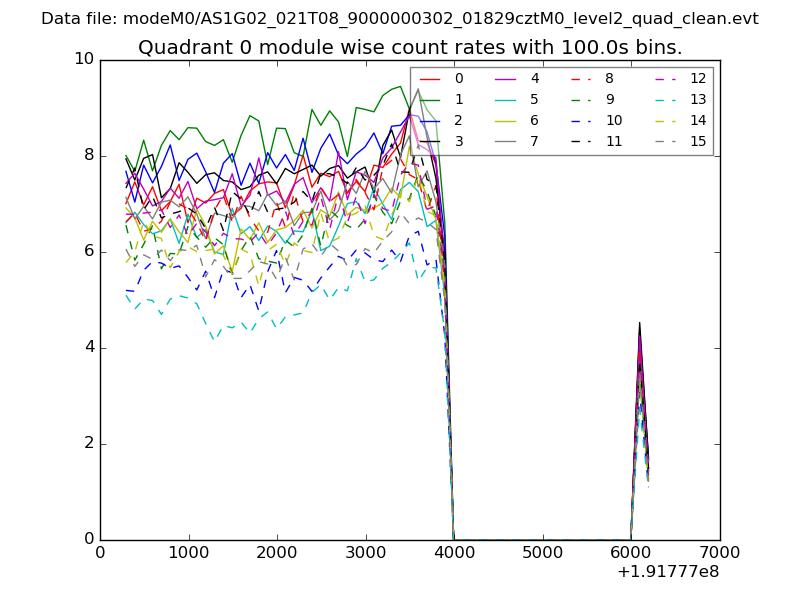 |
 |
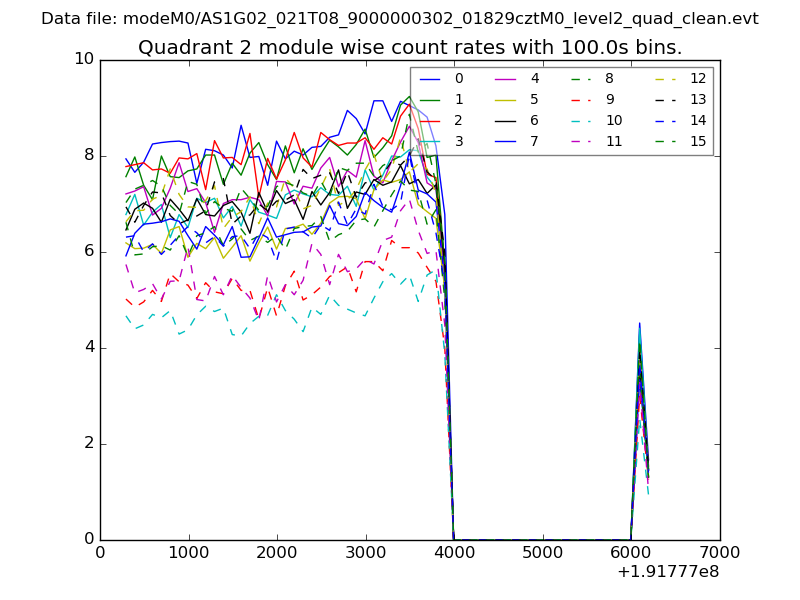
| Module-wise count rates for Quadrant B Data is divided into 100 sec bins |
 |
 |
| Module-wise count rates for Quadrant C Data is divided into 100 sec bins |
 |
 |
| Module-wise count rates for Quadrant D Data is divided into 100 sec bins |
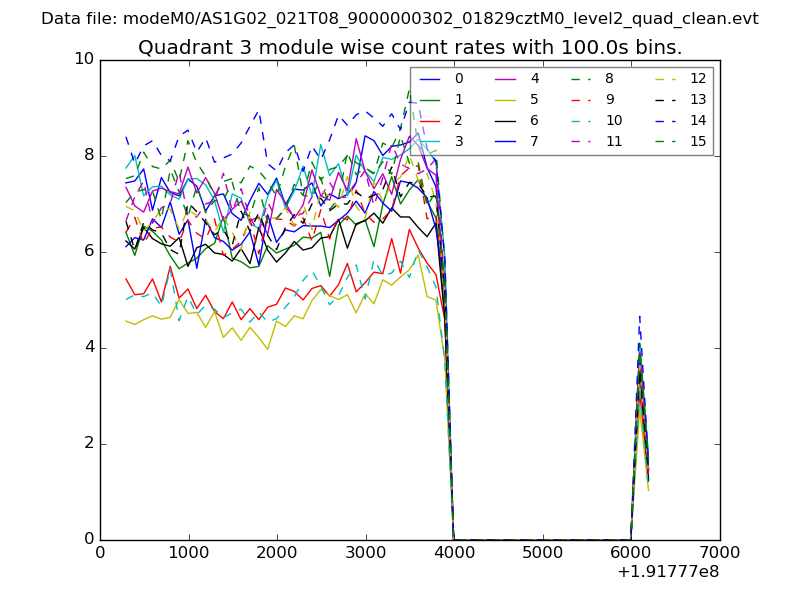 |
 |
| Parameter | Plot |
|---|---|
| CZT HV Monitor | 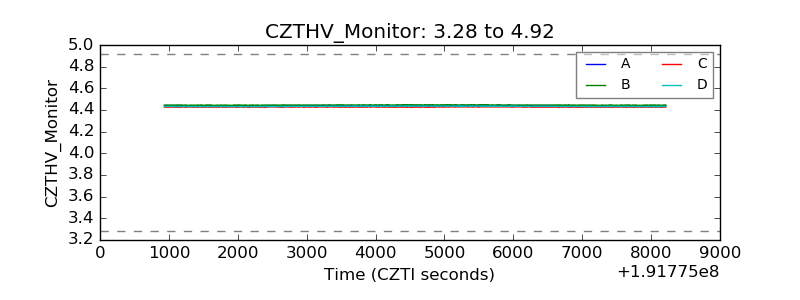 |
| D_VDD | 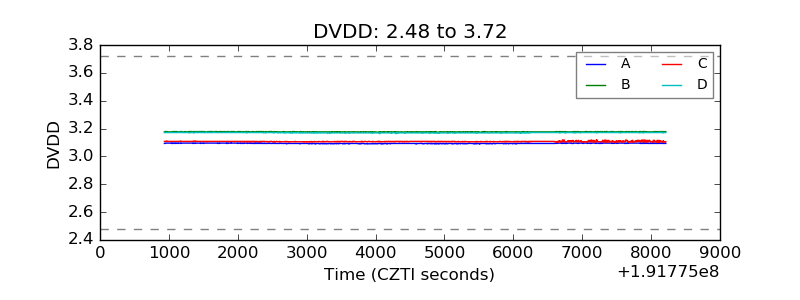 |
| Temperature 1 | 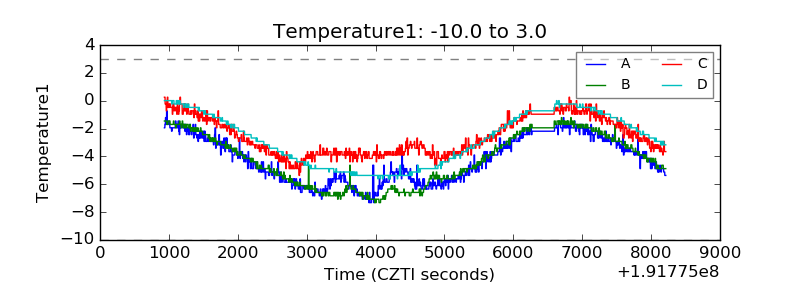 |
| Veto HV Monitor | 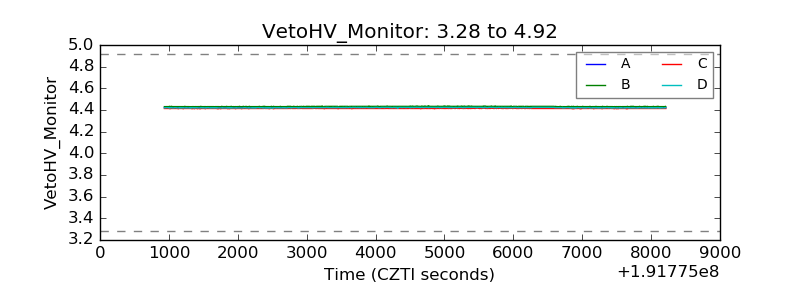 |
| Veto LLD | 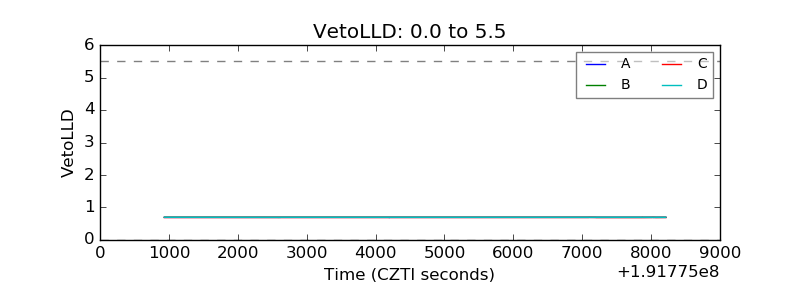 |
| Alpha Counter | 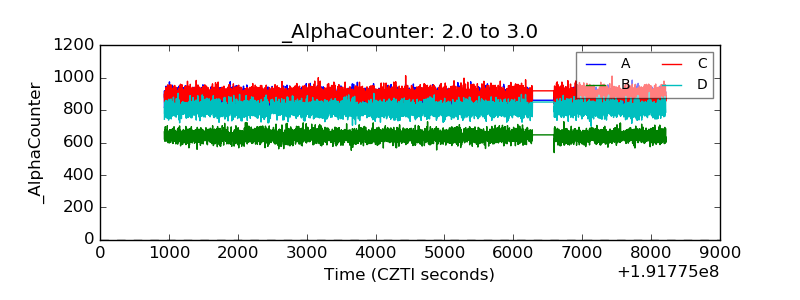 |
| _CPM_Rate |  |
| CZT Counter | 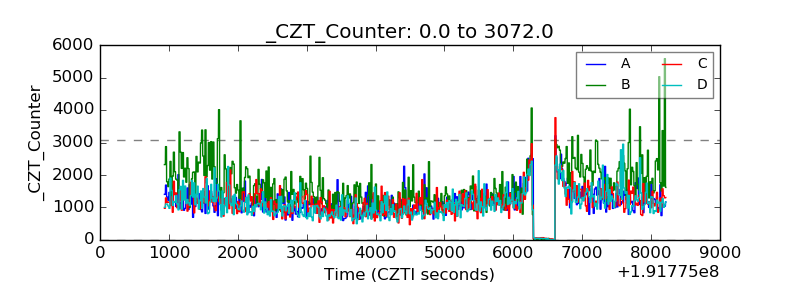 |
| +2.5 Volts monitor | 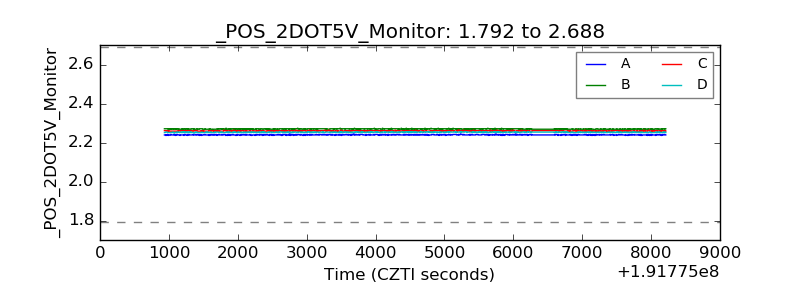 |
| +5 Volts monitor |  |
| _ROLL_ROT | 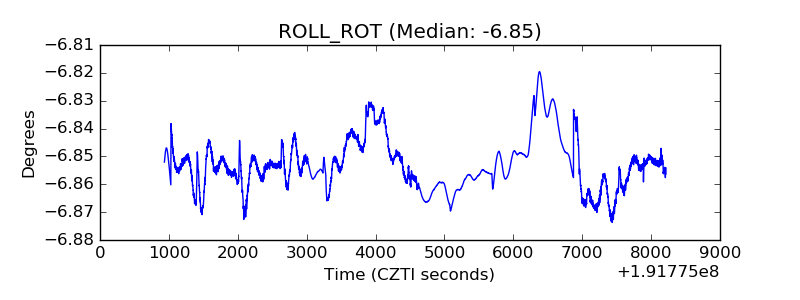 |
| _Roll_DEC | 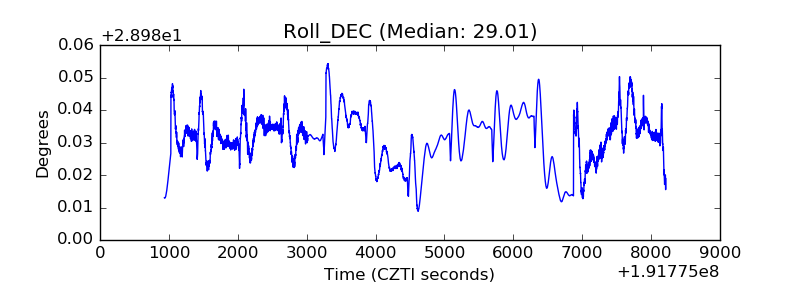 |
| _Roll_RA | 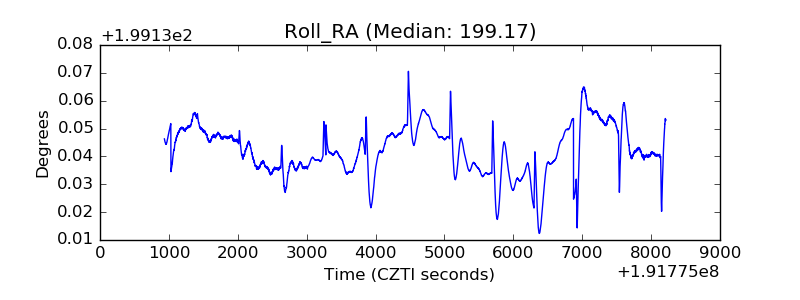 |
| Veto Counter | 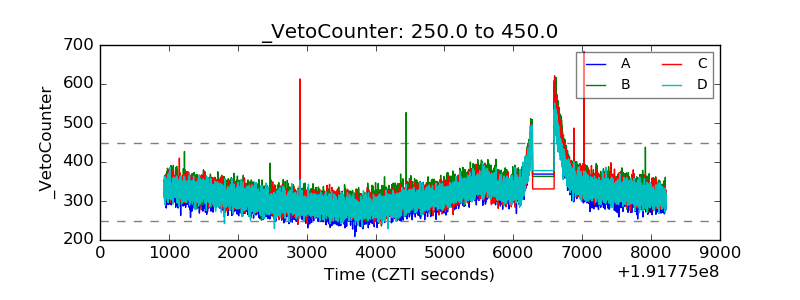 |