| Param | Original file | Final file |
|---|---|---|
| Filename | modeM0/AS1G02_021T08_9000000302_01830cztM0_level2.evt | modeM0/AS1G02_021T08_9000000302_01830cztM0_level2_quad_clean.evt |
| Size (bytes) | 1,247,008,320 | 76,331,520 |
| Size | 1.2 GB | 72.8 MB |
| Events in quadrant A | 8,808,964 | 453,401 |
| Events in quadrant B | 11,480,610 | 453,444 |
| Events in quadrant C | 8,567,683 | 454,186 |
| Events in quadrant D | 8,428,348 | 444,454 |
| Mode M9 | |||
|---|---|---|---|
| Quadrant | BADHDUFLAG | Total packets | Discarded packets |
| A | 0 | 1 | 0 |
| B | 1 | 1 | 0 |
| C | 1 | -1 | -1 |
| D | 1 | -1 | -1 |
| Mode M0 | |||
|---|---|---|---|
| Quadrant | BADHDUFLAG | Total packets | Discarded packets |
| A | 0 | 31331 | 13 |
| B | 0 | 39209 | 1 |
| C | 0 | 30653 | 1 |
| D | 0 | 30235 | 1 |
| Mode SS | |||
|---|---|---|---|
| Quadrant | BADHDUFLAG | Total packets | Discarded packets |
| A | 0 | 146 | 0 |
| B | 0 | 146 | 0 |
| C | 0 | 146 | 0 |
| D | 0 | 146 | 0 |
| Quadrant | Total seconds | Saturated seconds | Saturation percentage |
|---|---|---|---|
| A | 7260 | 21 | 0.289256% |
| B | 7262 | 216 | 2.974387% |
| C | 7262 | 31 | 0.426880% |
| D | 7262 | 155 | 2.134398% |
Noise dominated data is calculated using 1-second bins in cleaned event files. If a bin has >2000 counts, and if more than 50% of those come from <1% of pixels, then it is considered to be noise-dominated and hence unusable.
| Quadrant | # 1 sec bins | Bins with >0 counts | Bins with >2000 counts | High rate bins dominated by noise | Noise dominated (total time) | Noise dominated (detector-on time) | Marked lightcurve |
|---|---|---|---|---|---|---|---|
| A | 7727 | 7262 | 259 | 259 | 3.35% | 3.57% | 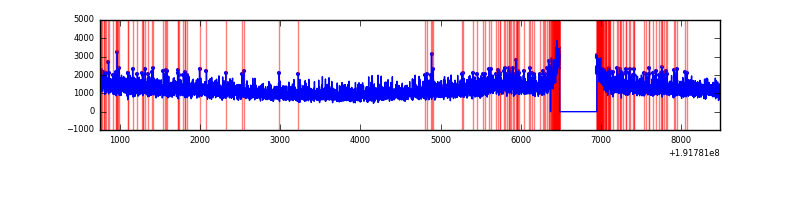 |
| B | 7727 | 7263 | 1461 | 1461 | 18.91% | 20.12% | 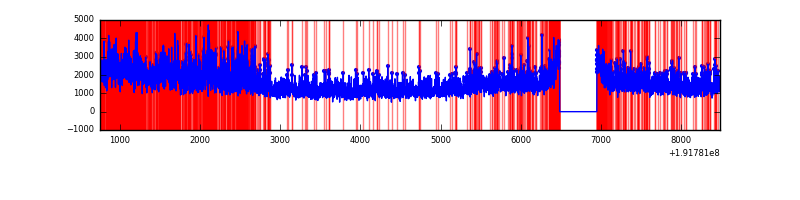 |
| C | 7727 | 7263 | 200 | 200 | 2.59% | 2.75% | 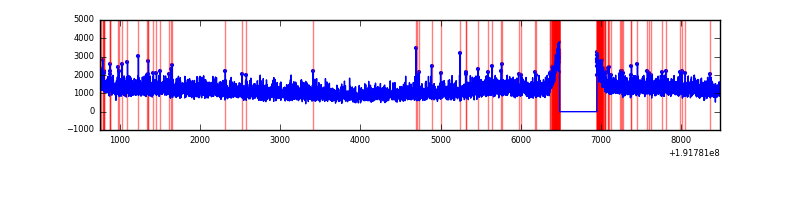 |
| D | 7727 | 7263 | 354 | 354 | 4.58% | 4.87% | 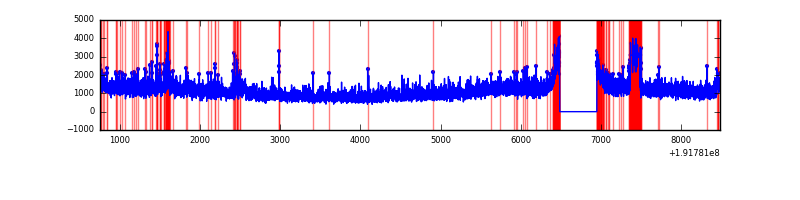 |
Top three noisy pixels from each quadrant. If the there are fewer than three noisy pixels in the level2.evt file, extra rows are filled as -1
| Pixel properties | Quadrant properties | ||||||
|---|---|---|---|---|---|---|---|
| Quadrant | DetID | PixID | Counts | Sigma | Mean | Median | Sigma |
| A | 10 | 2 | 12177 | 17.76 | 2299 | 2308 | 555.8 |
| A | 15 | 236 | 7029 | 8.49 | 2299 | 2308 | 555.8 |
| A | -1 | -1 | -1 | -1.0 | 2299 | 2308 | 555.8 |
| B | 8 | 3 | 2447541 | 4337.39 | 2378 | 2386 | 563.7 |
| B | 4 | 48 | 12671 | 18.24 | 2378 | 2386 | 563.7 |
| B | 4 | 174 | 9607 | 12.81 | 2378 | 2386 | 563.7 |
| C | 9 | 236 | 6191 | 6.36 | 2194 | 2272 | 616.3 |
| C | -1 | -1 | -1 | -1.0 | 2194 | 2272 | 616.3 |
| C | -1 | -1 | -1 | -1.0 | 2194 | 2272 | 616.3 |
| D | 13 | 53 | 327146 | 490.3 | 2105 | 2169 | 662.8 |
| D | 7 | 85 | 101961 | 150.56 | 2105 | 2169 | 662.8 |
| D | 13 | 105 | 70996 | 103.84 | 2105 | 2169 | 662.8 |
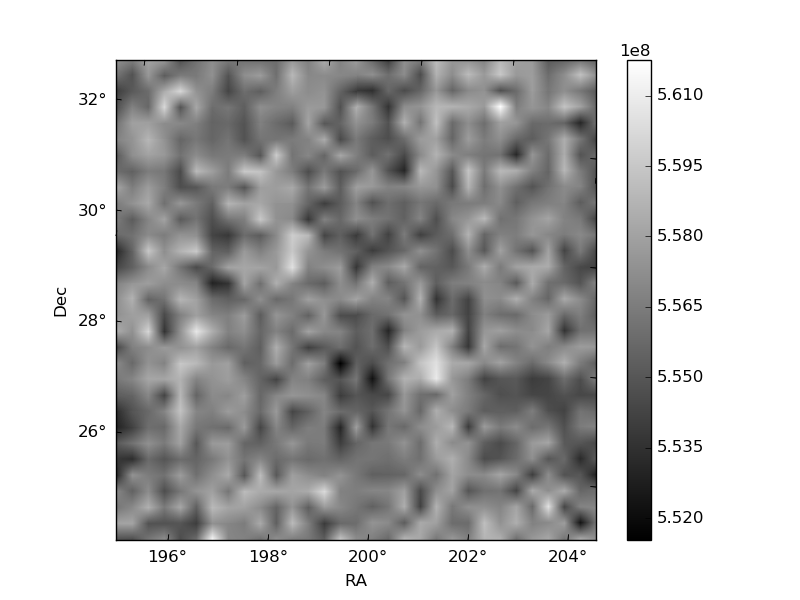
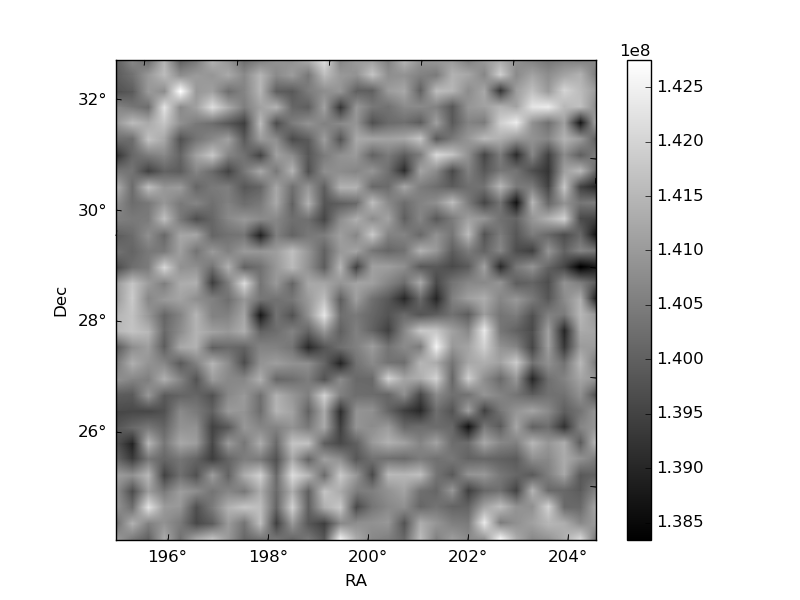
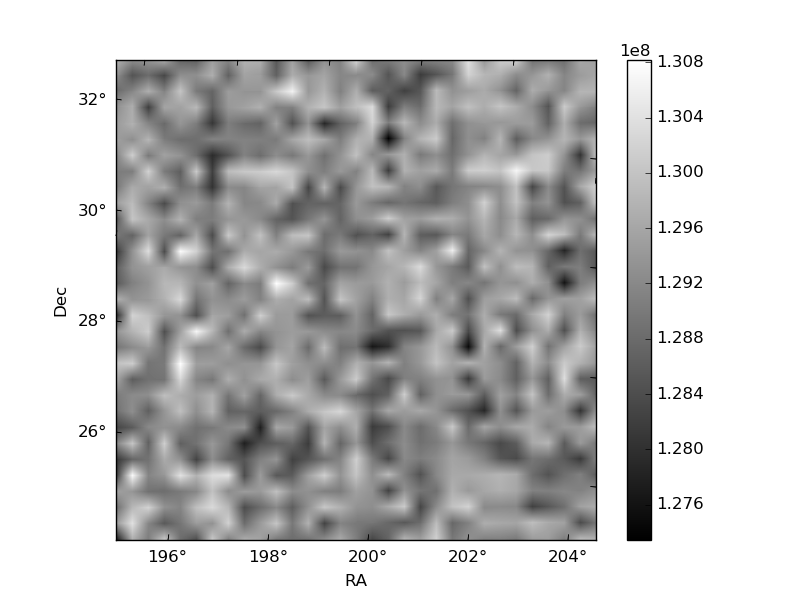
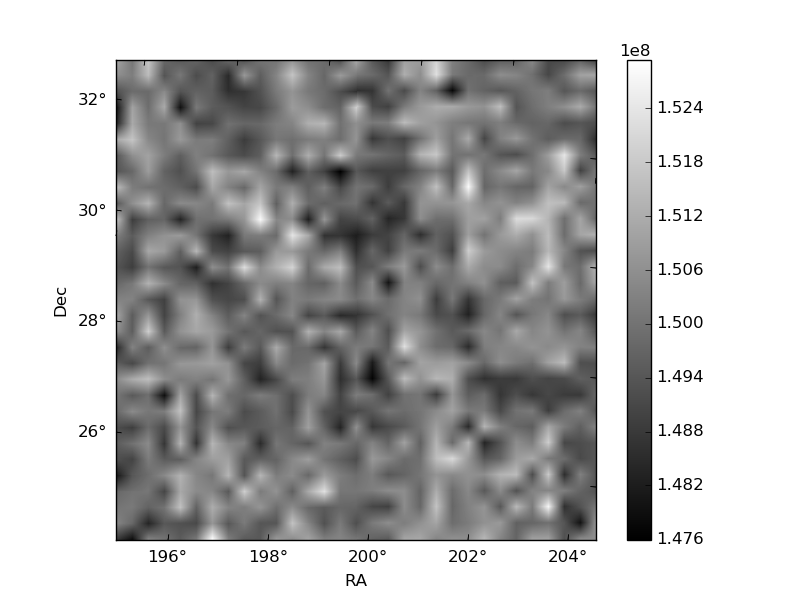
Histogram calculated using DETX and DETY for each event in the final _common_clean file
| Quadrant A | 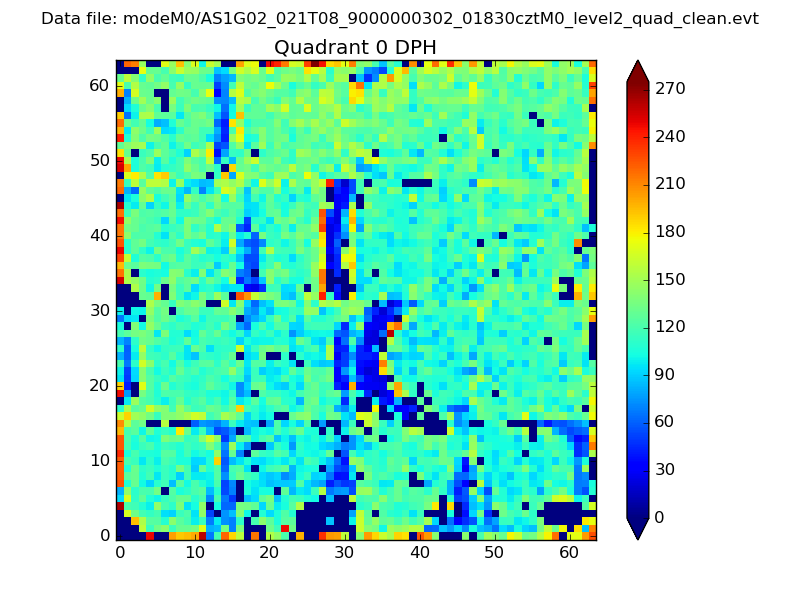 |
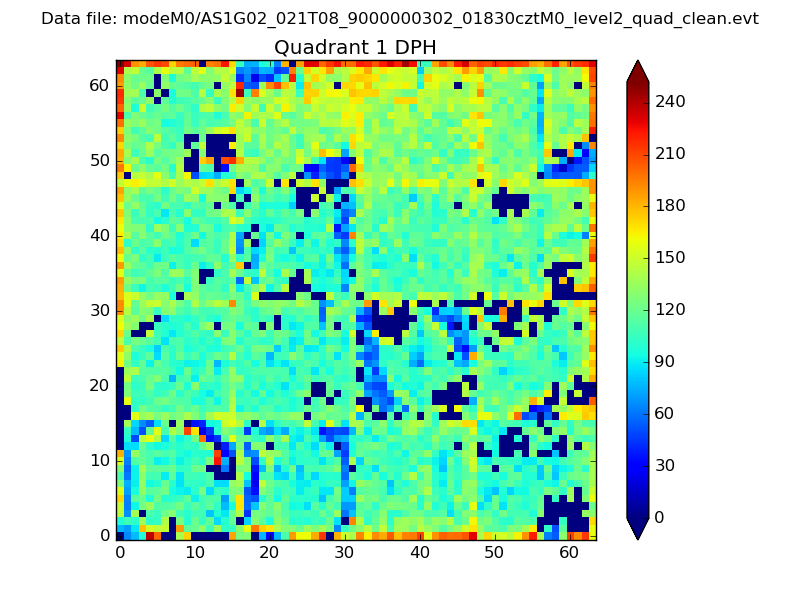 |
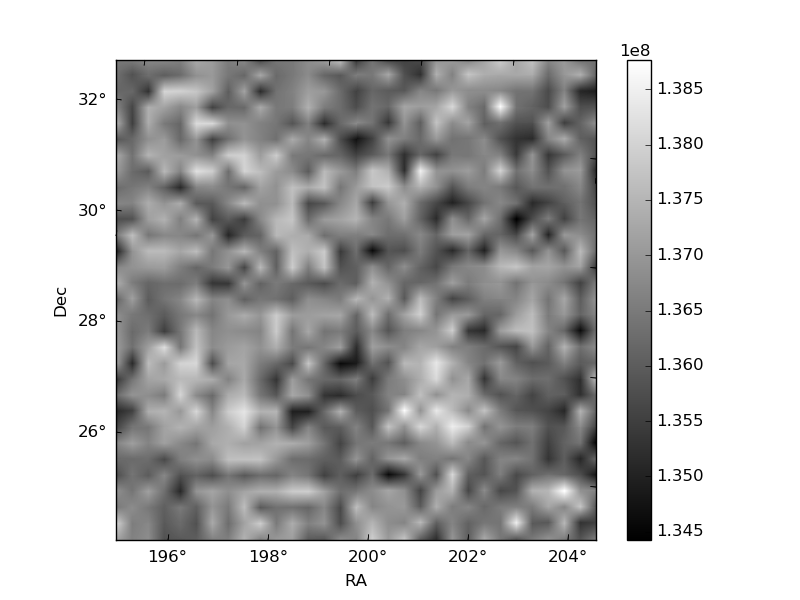
Quadrant B |
|---|---|---|---|
| Quadrant D | 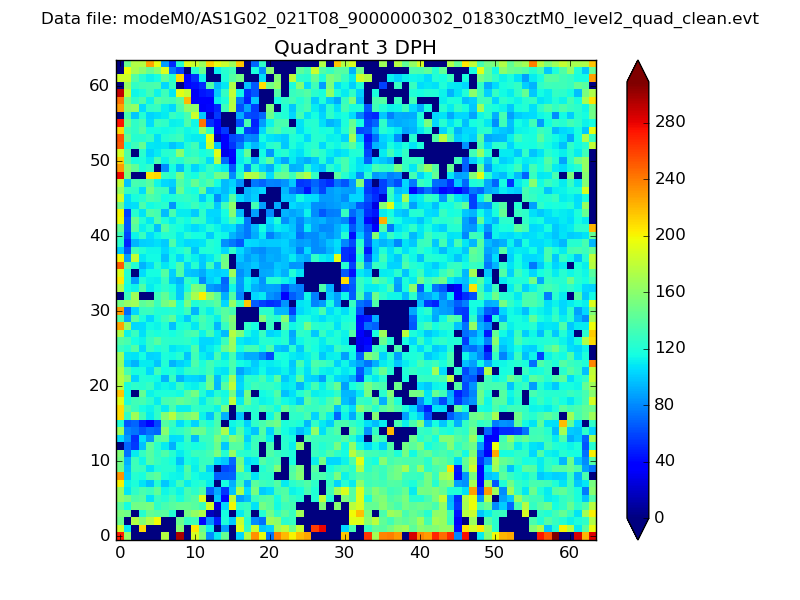 |
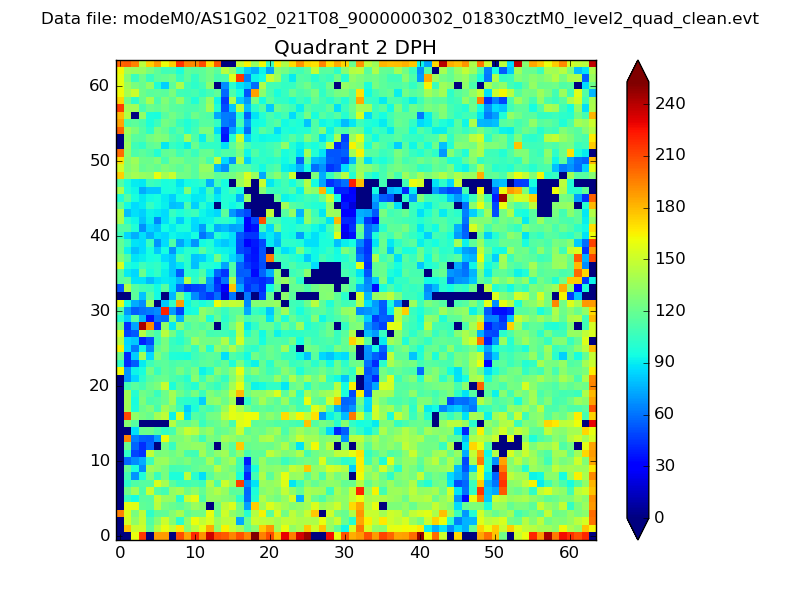 |
Quadrant C |
| Plot type | Count rate plots | Images |
|---|---|---|
| Comparison with Poisson distribution Blue bars denote a histogram of data divided into 1 sec bins. Red curve is a Poisson curve with rate = median count rate of data. |
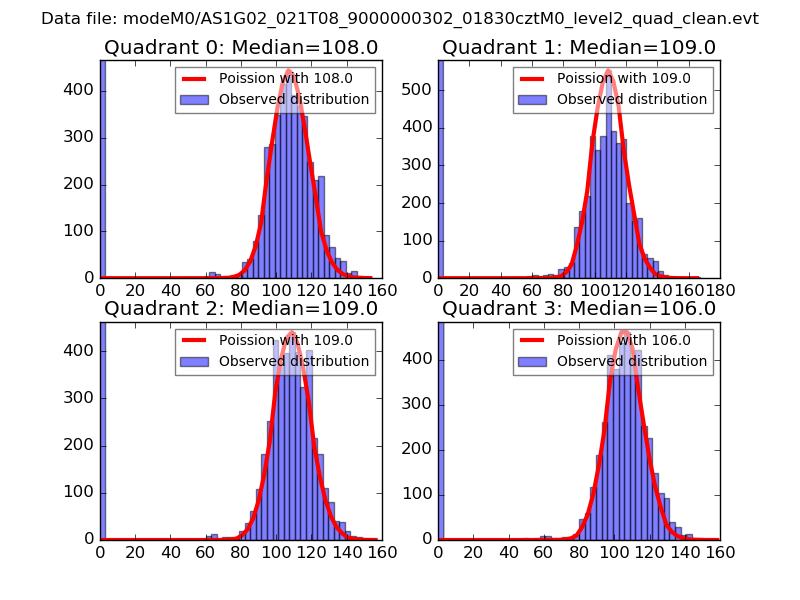 |
 |
| Quadrant-wise count rates Data is divided into 100 sec bins |
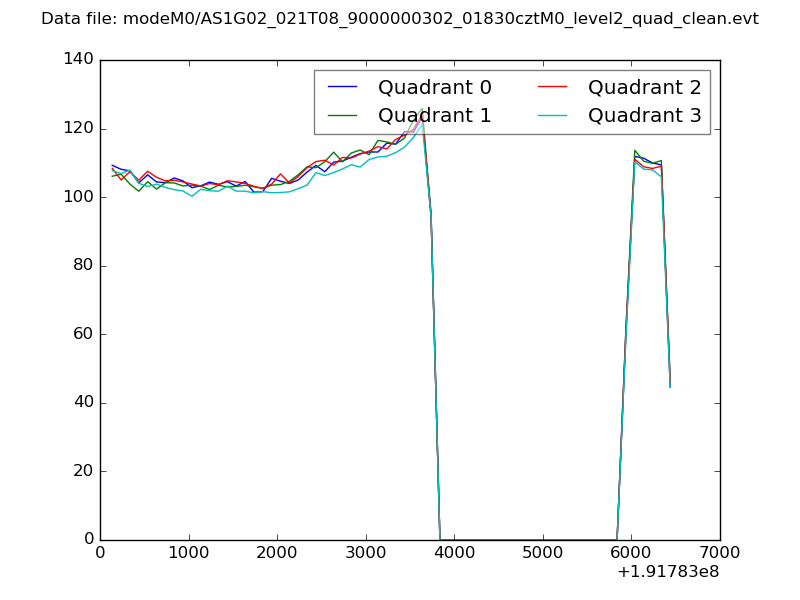 |
|
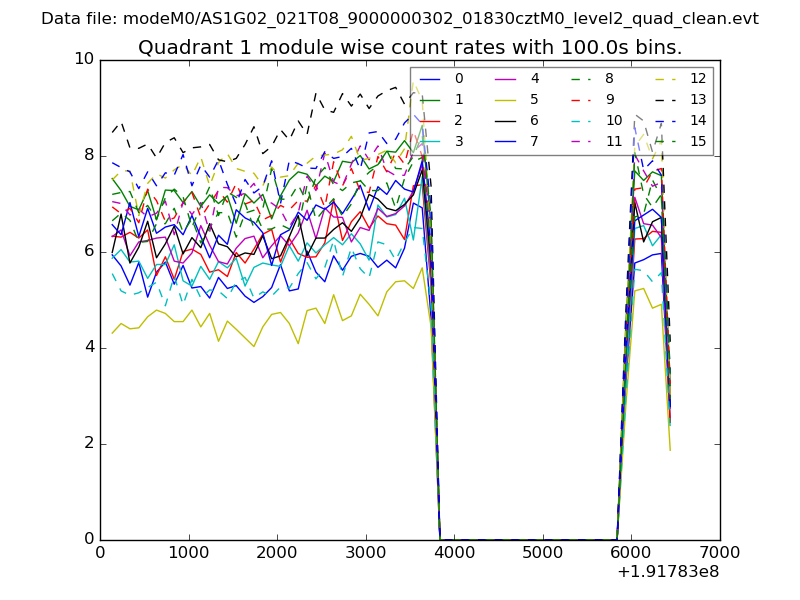
| Module-wise count rates for Quadrant A Data is divided into 100 sec bins |
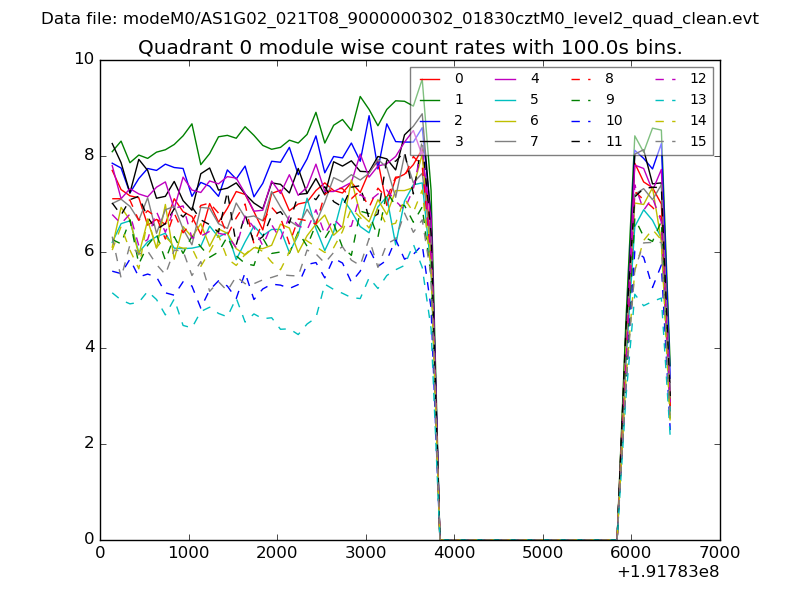 |
 |
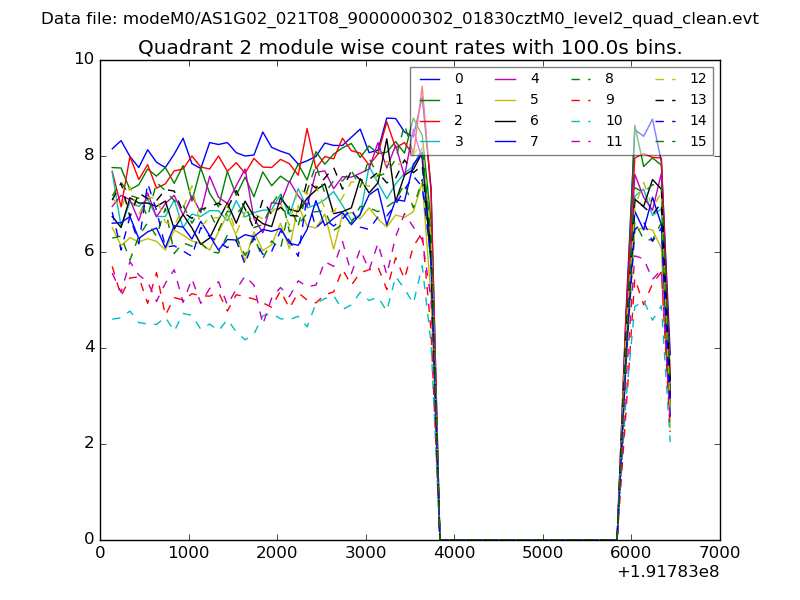
| Module-wise count rates for Quadrant B Data is divided into 100 sec bins |
 |
 |
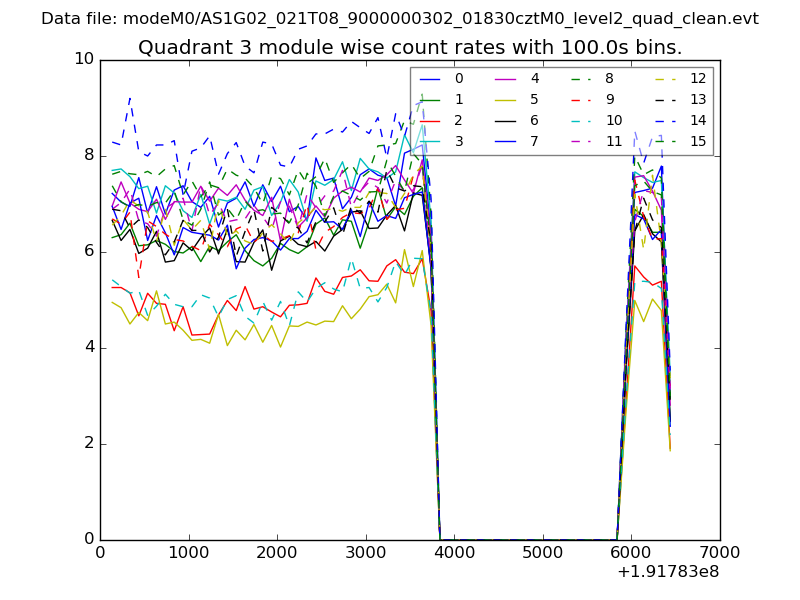
| Module-wise count rates for Quadrant C Data is divided into 100 sec bins |
 |
 |
| Module-wise count rates for Quadrant D Data is divided into 100 sec bins |
 |
 |
| Parameter | Plot |
|---|---|
| CZT HV Monitor | 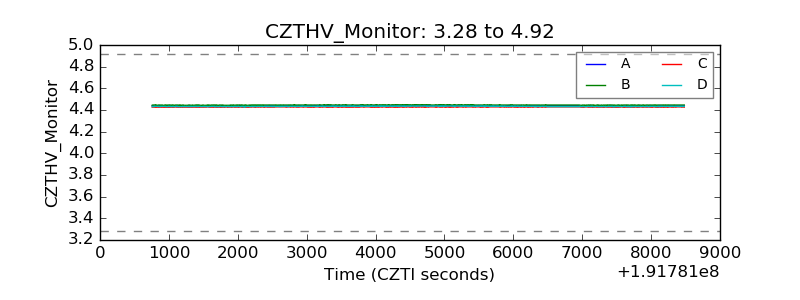 |
| D_VDD | 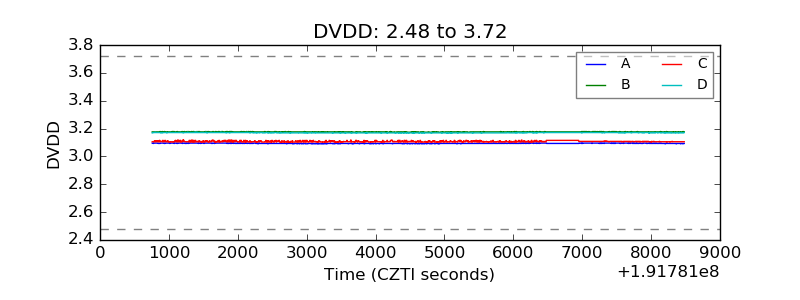 |
| Temperature 1 | 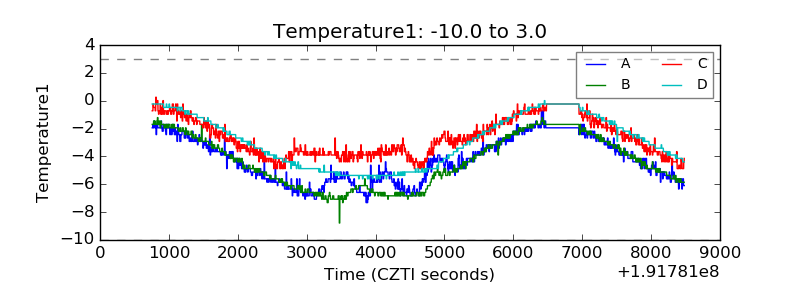 |
| Veto HV Monitor | 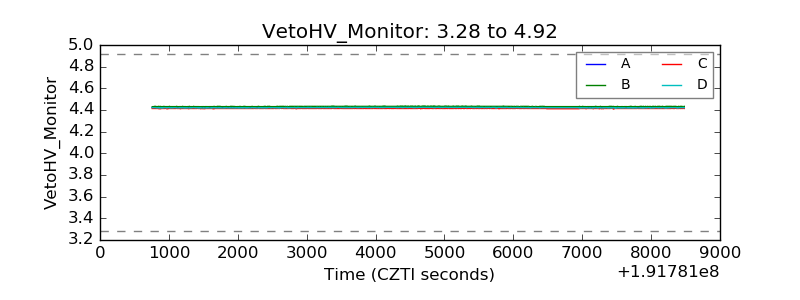 |
| Veto LLD | 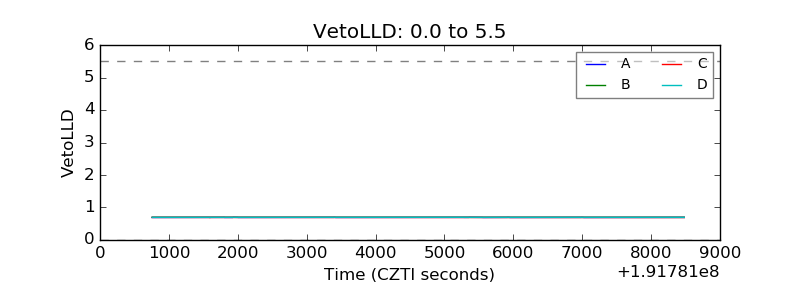 |
| Alpha Counter | 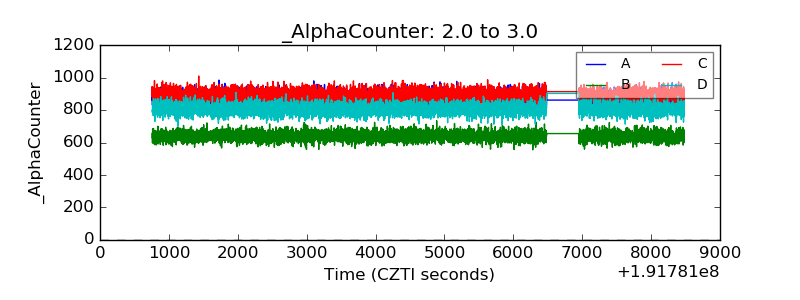 |
| _CPM_Rate | 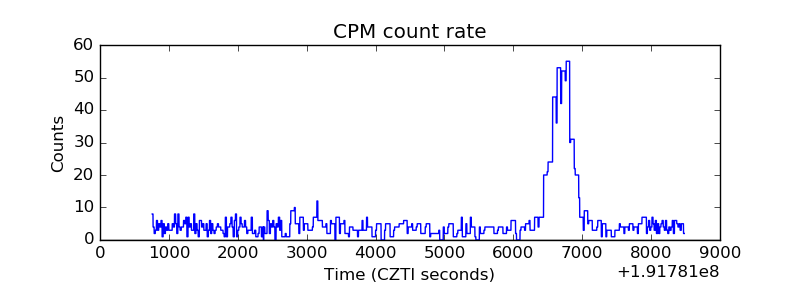 |
| CZT Counter | 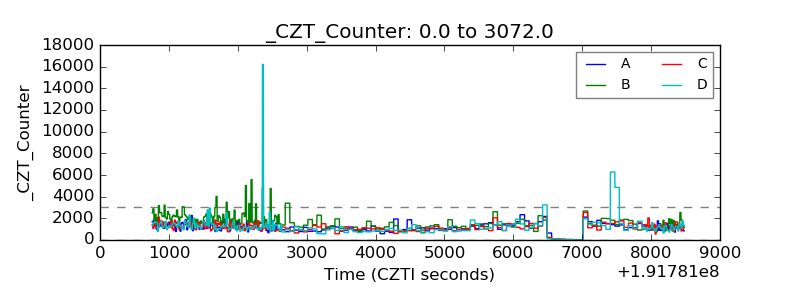 |
| +2.5 Volts monitor | 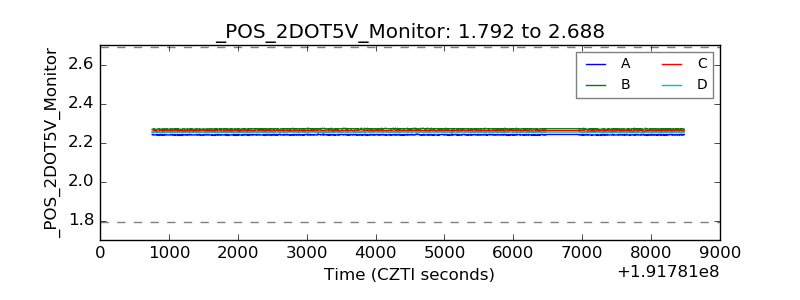 |
| +5 Volts monitor |  |
| _ROLL_ROT | 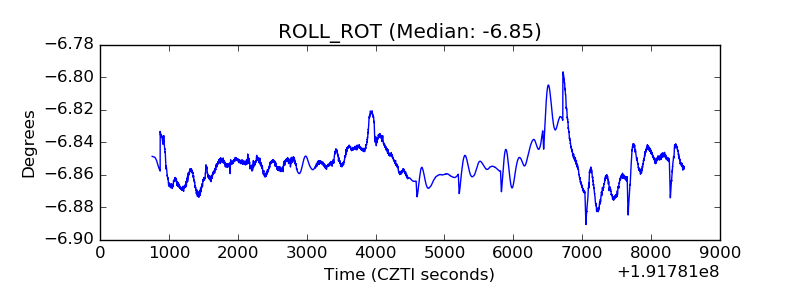 |
| _Roll_DEC | 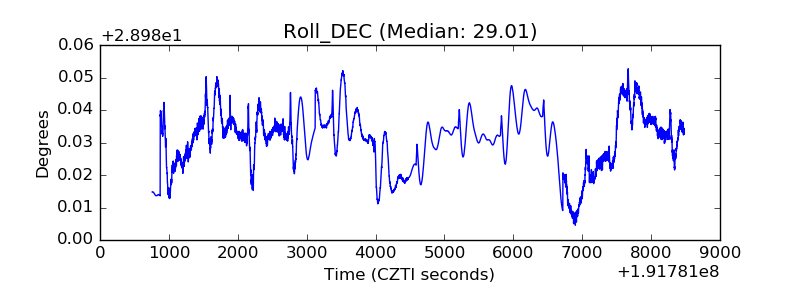 |
| _Roll_RA | 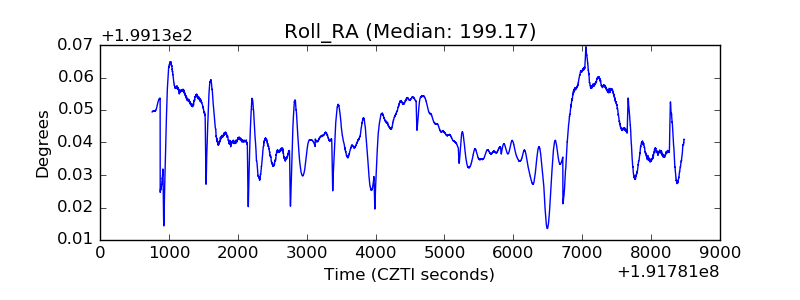 |
| Veto Counter | 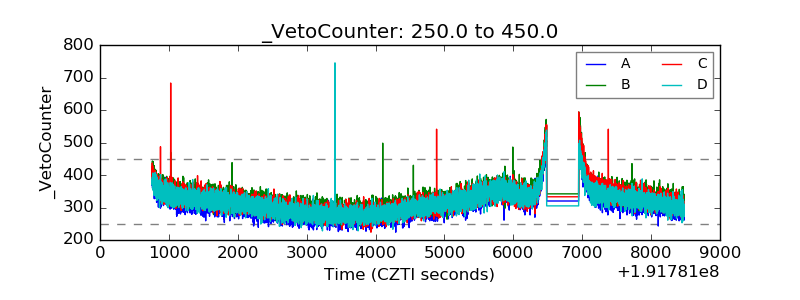 |