| Param | Original file | Final file |
|---|---|---|
| Filename | modeM0/AS1G02_021T08_9000000302_01831cztM0_level2.evt | modeM0/AS1G02_021T08_9000000302_01831cztM0_level2_quad_clean.evt |
| Size (bytes) | 1,145,361,600 | 80,752,320 |
| Size | 1.1 GB | 77.0 MB |
| Events in quadrant A | 8,547,605 | 489,239 |
| Events in quadrant B | 9,379,898 | 494,401 |
| Events in quadrant C | 8,287,492 | 490,053 |
| Events in quadrant D | 8,003,960 | 479,095 |
| Mode M9 | |||
|---|---|---|---|
| Quadrant | BADHDUFLAG | Total packets | Discarded packets |
| A | 0 | 1 | 0 |
| B | 1 | 1 | 0 |
| C | 1 | -1 | -1 |
| D | 1 | -1 | -1 |
| Mode M0 | |||
|---|---|---|---|
| Quadrant | BADHDUFLAG | Total packets | Discarded packets |
| A | 0 | 30406 | 2 |
| B | 0 | 32887 | 11 |
| C | 0 | 29694 | 2 |
| D | 0 | 28839 | 2 |
| Mode SS | |||
|---|---|---|---|
| Quadrant | BADHDUFLAG | Total packets | Discarded packets |
| A | 0 | 142 | 0 |
| B | 0 | 142 | 0 |
| C | 0 | 142 | 0 |
| D | 0 | 142 | 0 |
| Quadrant | Total seconds | Saturated seconds | Saturation percentage |
|---|---|---|---|
| A | 7069 | 11 | 0.155609% |
| B | 7067 | 27 | 0.382057% |
| C | 7069 | 14 | 0.198048% |
| D | 7069 | 131 | 1.853162% |
Noise dominated data is calculated using 1-second bins in cleaned event files. If a bin has >2000 counts, and if more than 50% of those come from <1% of pixels, then it is considered to be noise-dominated and hence unusable.
| Quadrant | # 1 sec bins | Bins with >0 counts | Bins with >2000 counts | High rate bins dominated by noise | Noise dominated (total time) | Noise dominated (detector-on time) | Marked lightcurve |
|---|---|---|---|---|---|---|---|
| A | 7734 | 7070 | 252 | 252 | 3.26% | 3.56% | 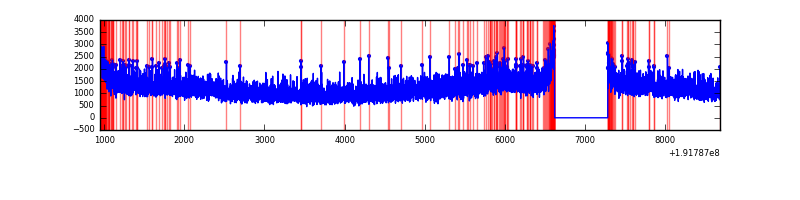 |
| B | 7734 | 7069 | 449 | 449 | 5.81% | 6.35% | 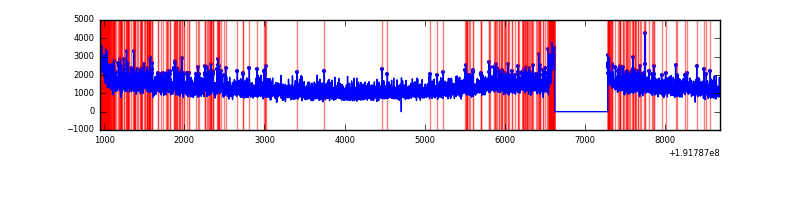 |
| C | 7734 | 7070 | 204 | 204 | 2.64% | 2.89% | 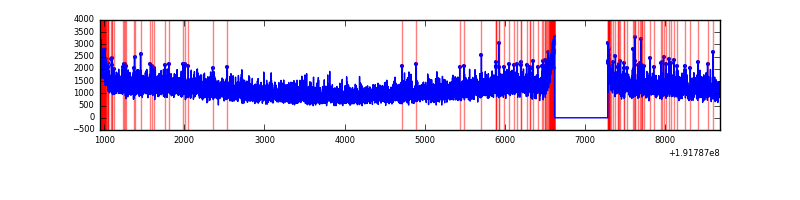 |
| D | 7734 | 7070 | 294 | 294 | 3.80% | 4.16% | 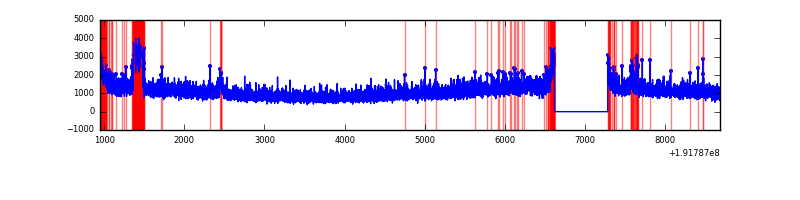 |
Top three noisy pixels from each quadrant. If the there are fewer than three noisy pixels in the level2.evt file, extra rows are filled as -1
| Pixel properties | Quadrant properties | ||||||
|---|---|---|---|---|---|---|---|
| Quadrant | DetID | PixID | Counts | Sigma | Mean | Median | Sigma |
| A | 15 | 236 | 8591 | 11.74 | 2231 | 2244 | 540.8 |
| A | 10 | 2 | 8182 | 10.98 | 2231 | 2244 | 540.8 |
| A | 12 | 189 | 4977 | 5.05 | 2231 | 2244 | 540.8 |
| B | 8 | 3 | 451982 | 814.43 | 2325 | 2334 | 552.1 |
| B | 0 | 234 | 70768 | 123.95 | 2325 | 2334 | 552.1 |
| B | 4 | 174 | 13354 | 19.96 | 2325 | 2334 | 552.1 |
| C | 9 | 236 | 10550 | 14.03 | 2120 | 2197 | 595.2 |
| C | 7 | 159 | 5951 | 6.31 | 2120 | 2197 | 595.2 |
| C | -1 | -1 | -1 | -1.0 | 2120 | 2197 | 595.2 |
| D | 13 | 53 | 315800 | 496.69 | 2023 | 2097 | 631.6 |
| D | 7 | 85 | 53813 | 81.88 | 2023 | 2097 | 631.6 |
| D | 1 | 83 | 53652 | 81.63 | 2023 | 2097 | 631.6 |
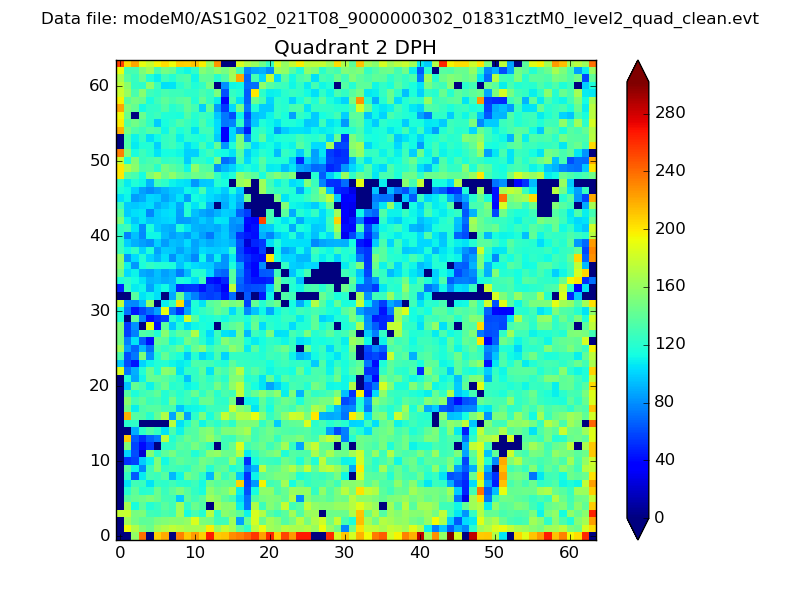
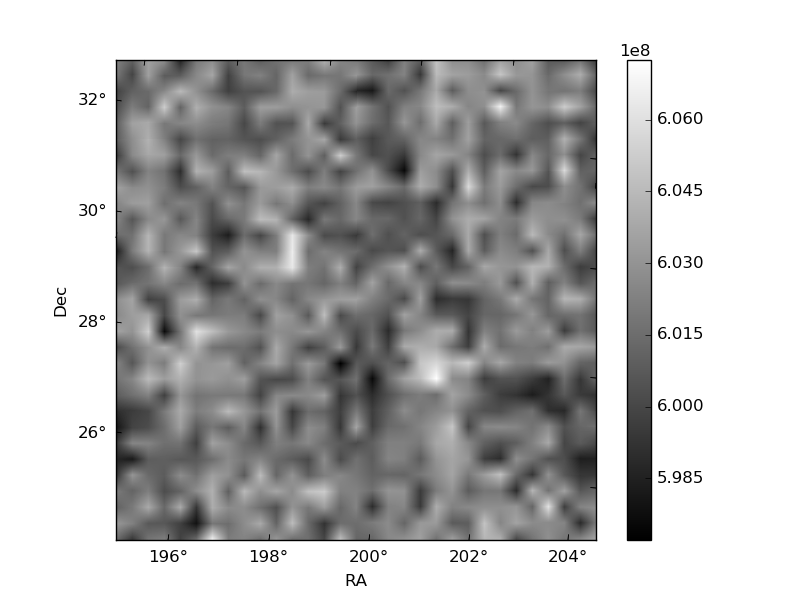
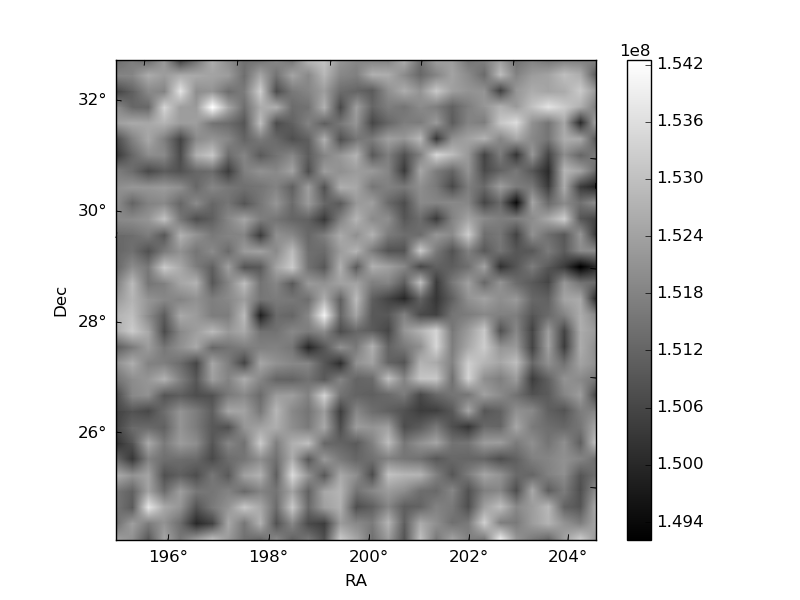
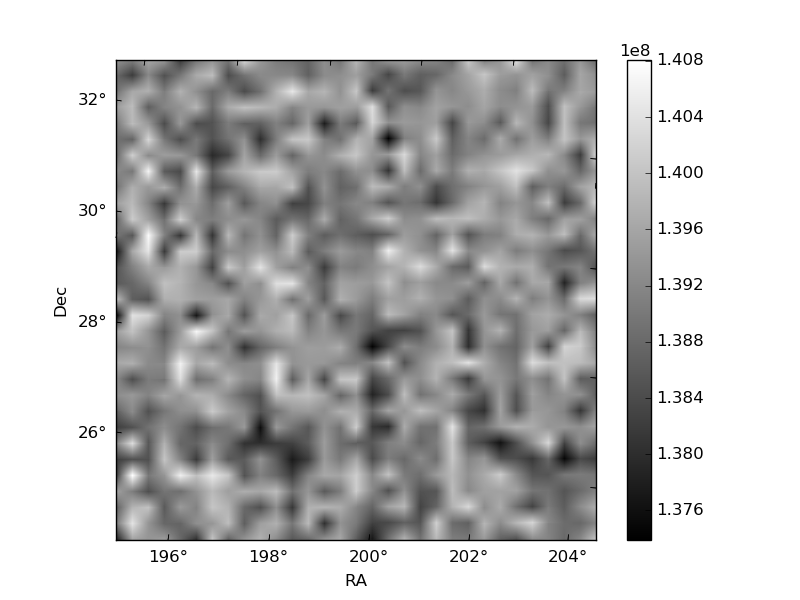
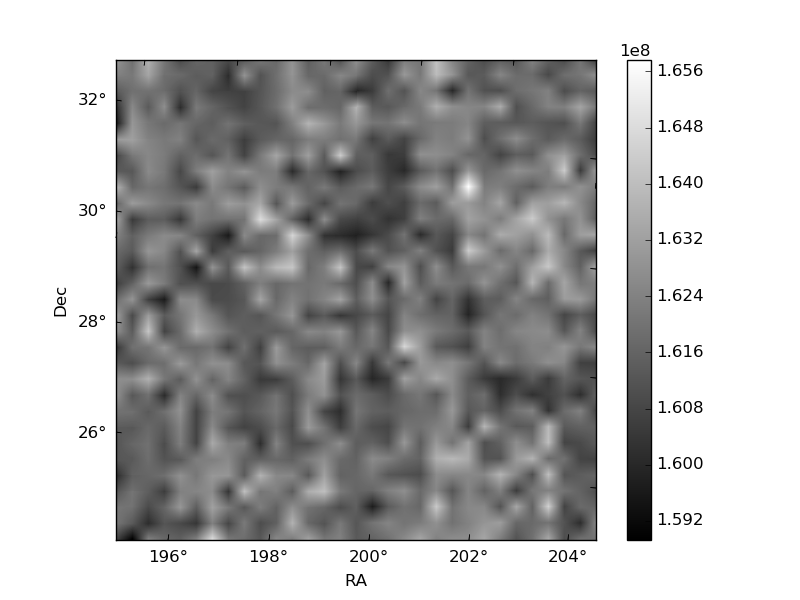
Histogram calculated using DETX and DETY for each event in the final _common_clean file
| Quadrant A | 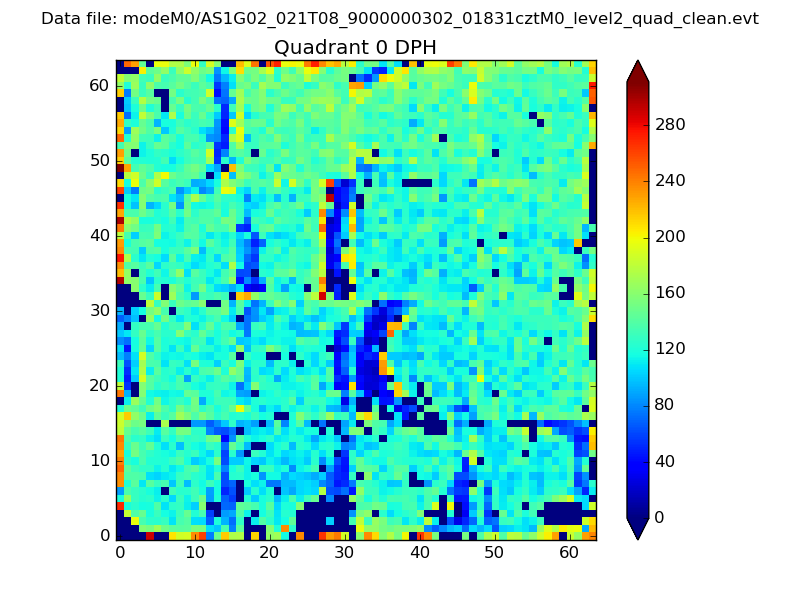 |
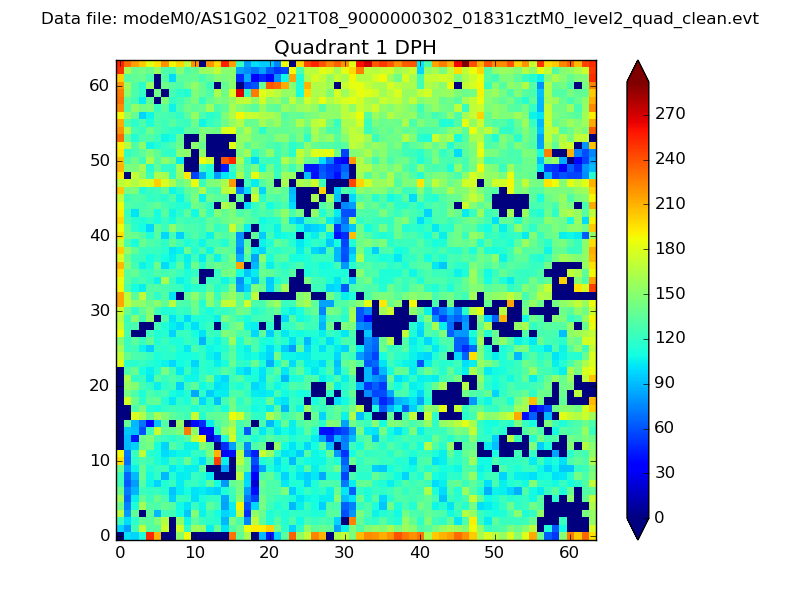 |
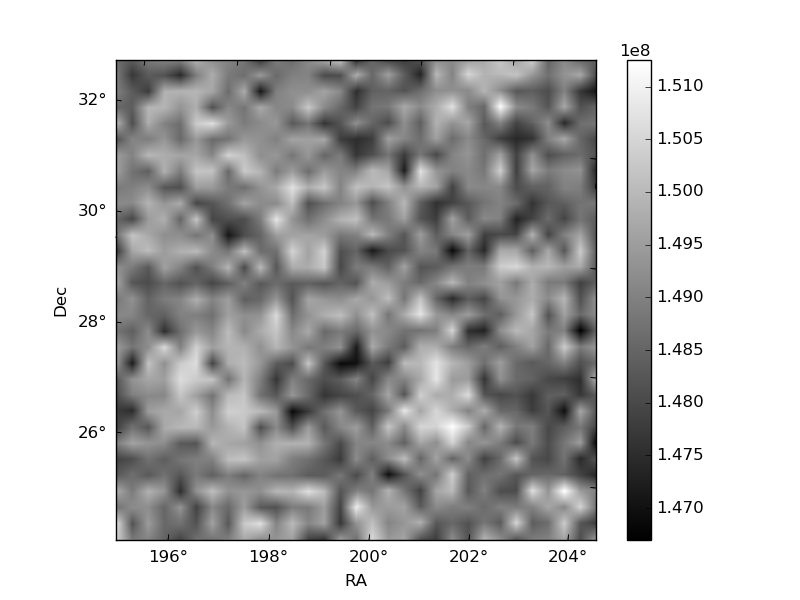
Quadrant B |
|---|---|---|---|
| Quadrant D | 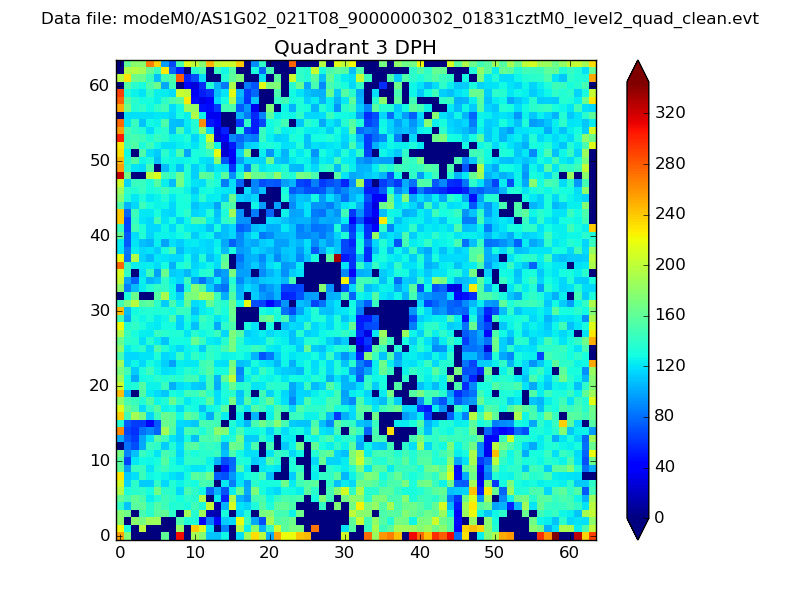 |
 |
Quadrant C |
| Plot type | Count rate plots | Images |
|---|---|---|
| Comparison with Poisson distribution Blue bars denote a histogram of data divided into 1 sec bins. Red curve is a Poisson curve with rate = median count rate of data. |
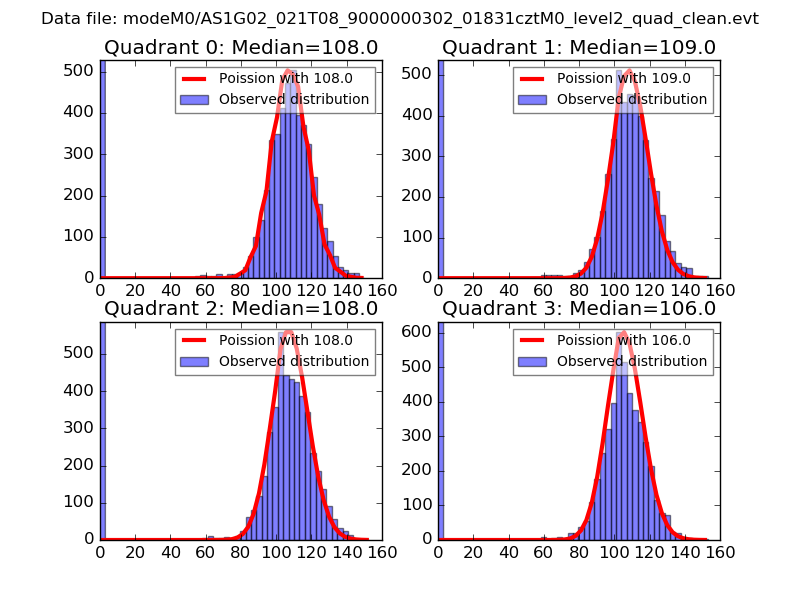 |
 |
| Quadrant-wise count rates Data is divided into 100 sec bins |
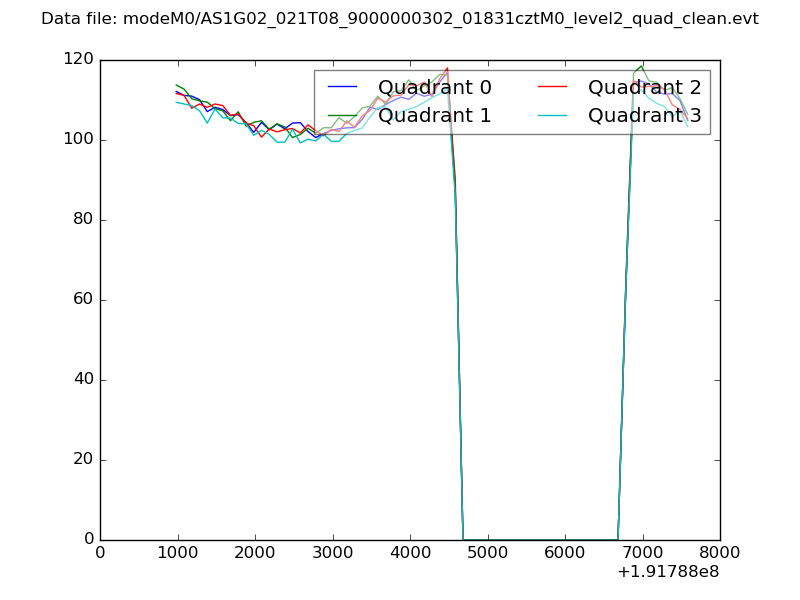 |
|
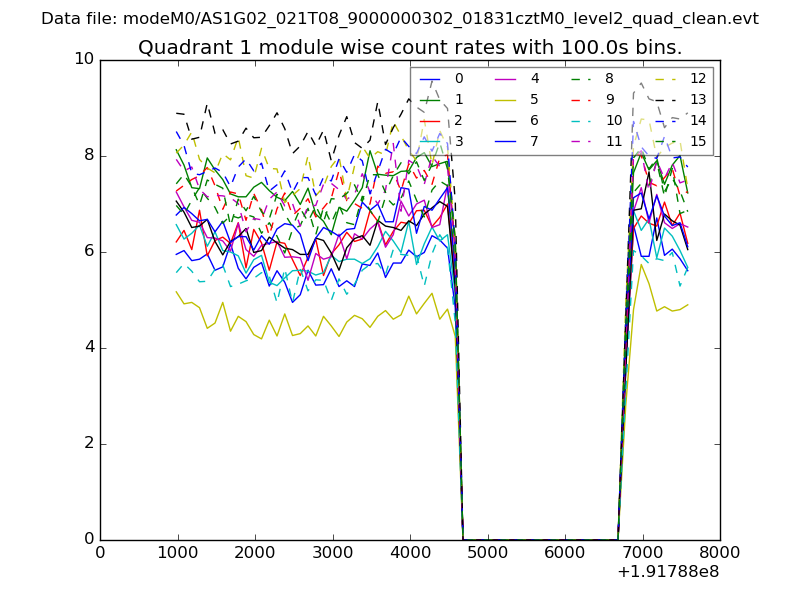
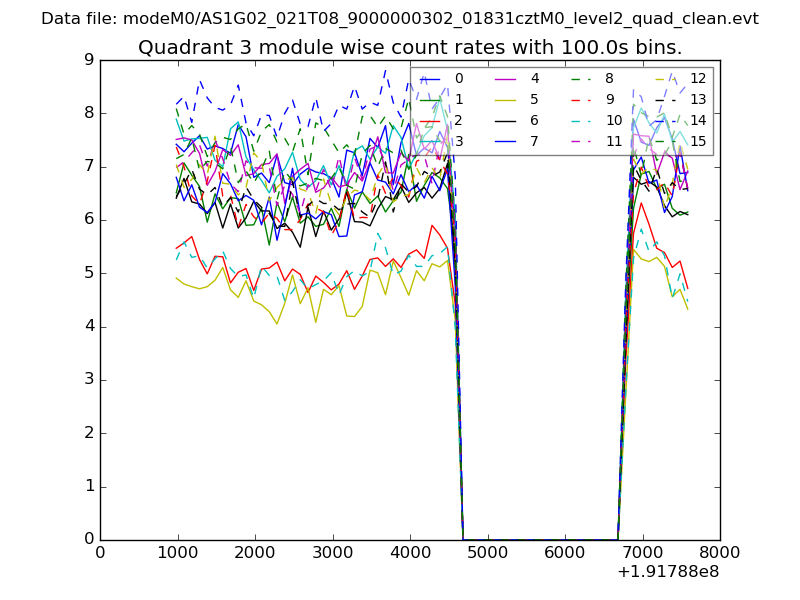
| Module-wise count rates for Quadrant A Data is divided into 100 sec bins |
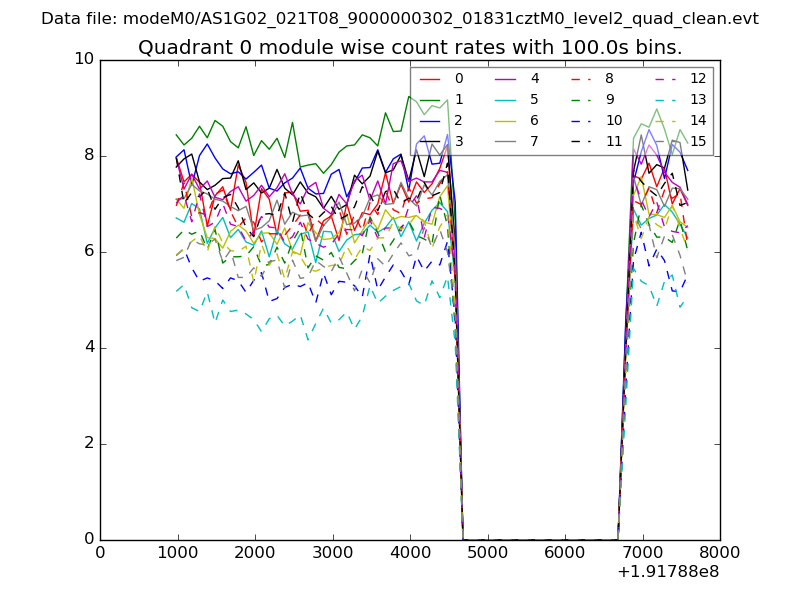 |
 |
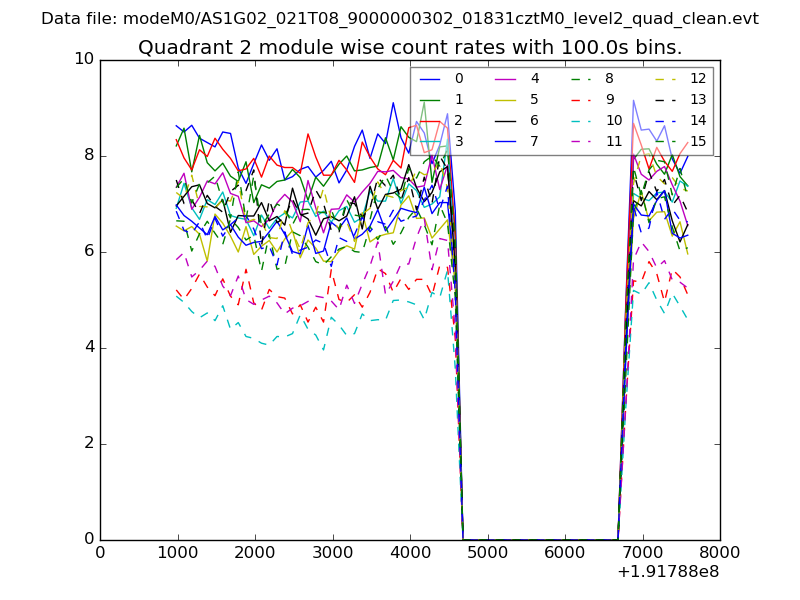
| Module-wise count rates for Quadrant B Data is divided into 100 sec bins |
 |
 |
| Module-wise count rates for Quadrant C Data is divided into 100 sec bins |
 |
 |
| Module-wise count rates for Quadrant D Data is divided into 100 sec bins |
 |
 |
| Parameter | Plot |
|---|---|
| CZT HV Monitor | 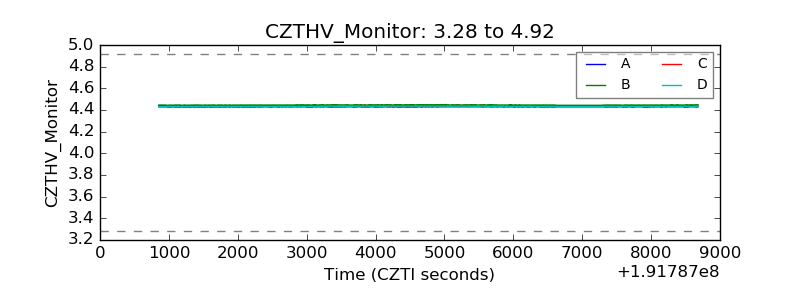 |
| D_VDD | 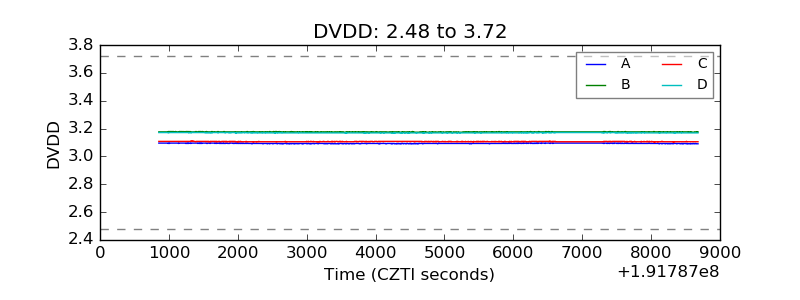 |
| Temperature 1 | 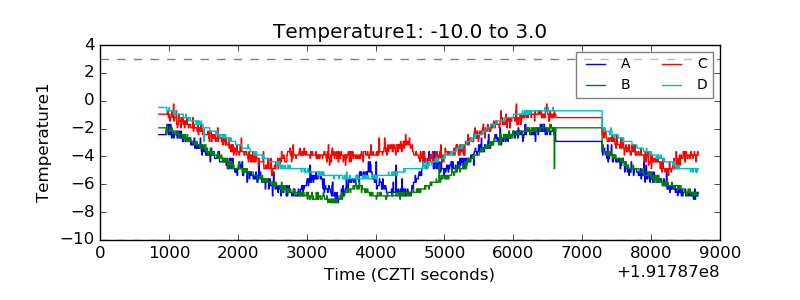 |
| Veto HV Monitor | 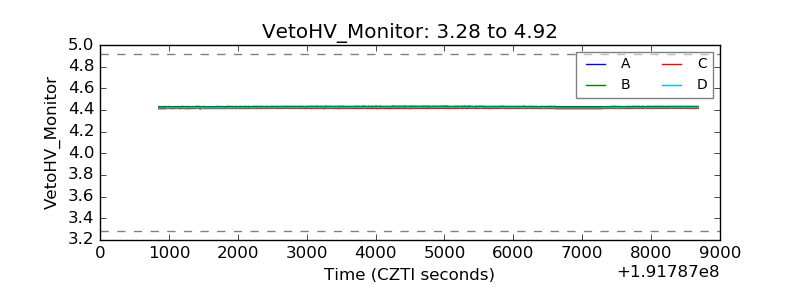 |
| Veto LLD | 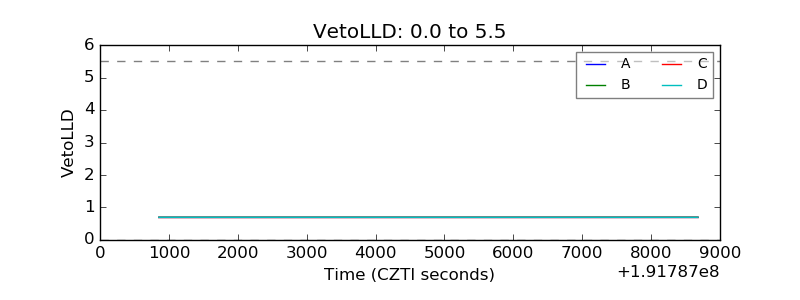 |
| Alpha Counter | 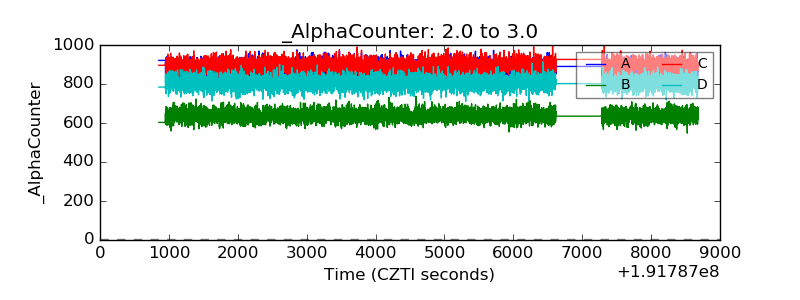 |
| _CPM_Rate | 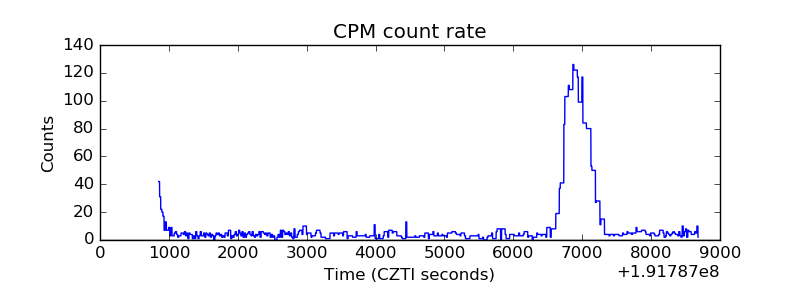 |
| CZT Counter | 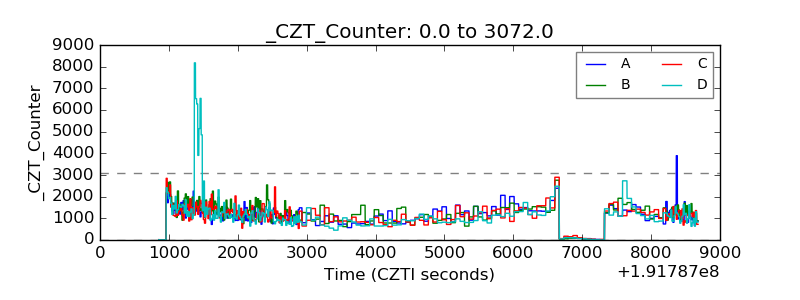 |
| +2.5 Volts monitor | 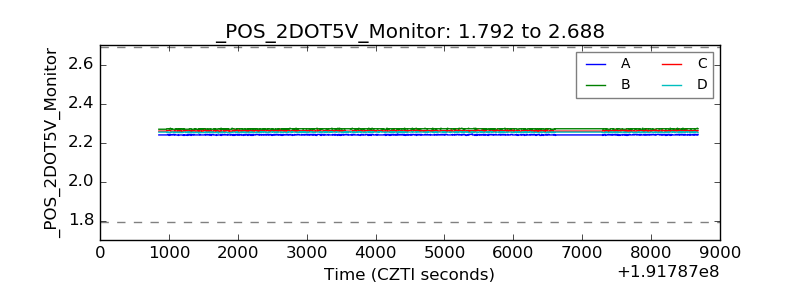 |
| +5 Volts monitor | 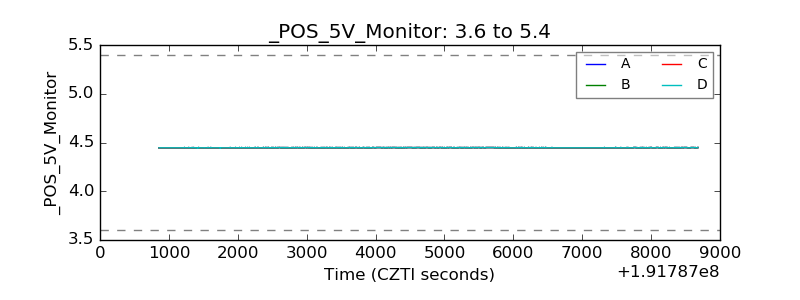 |
| _ROLL_ROT | 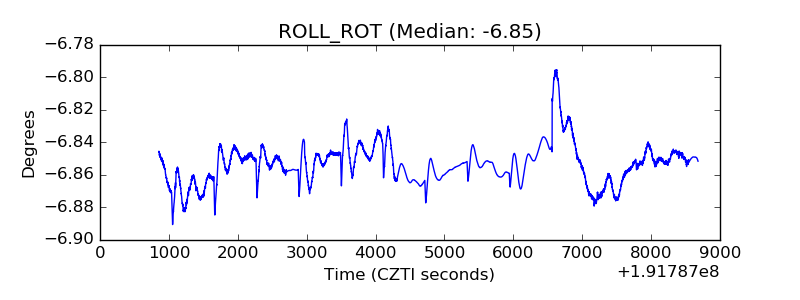 |
| _Roll_DEC | 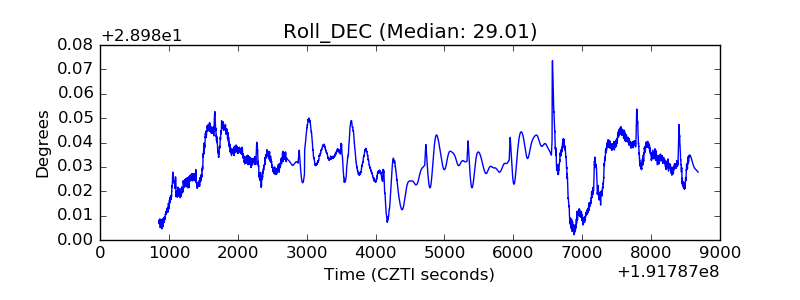 |
| _Roll_RA | 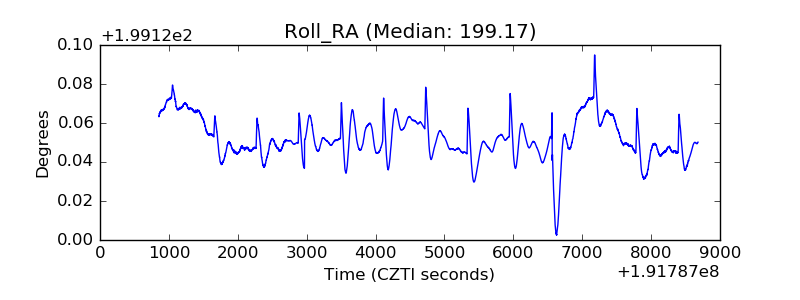 |
| Veto Counter | 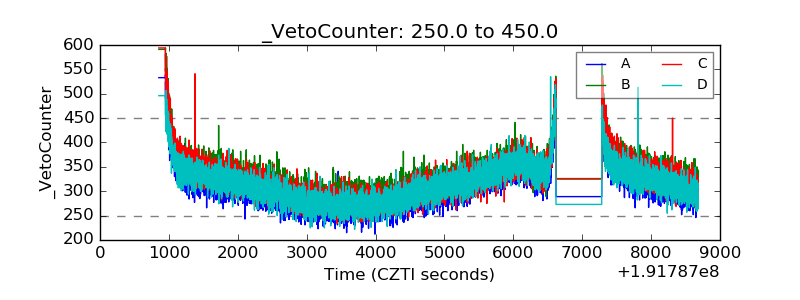 |