| Param | Original file | Final file |
|---|---|---|
| Filename | modeM0/AS1G02_021T08_9000000302_01833cztM0_level2.evt | modeM0/AS1G02_021T08_9000000302_01833cztM0_level2_quad_clean.evt |
| Size (bytes) | 892,054,080 | 69,246,720 |
| Size | 850.7 MB | 66.0 MB |
| Events in quadrant A | 6,521,999 | 429,815 |
| Events in quadrant B | 7,779,005 | 426,508 |
| Events in quadrant C | 6,366,599 | 430,999 |
| Events in quadrant D | 5,978,381 | 419,795 |
| Mode M9 | |||
|---|---|---|---|
| Quadrant | BADHDUFLAG | Total packets | Discarded packets |
| A | 0 | 1 | 0 |
| B | 1 | 1 | 0 |
| C | 1 | -1 | -1 |
| D | 1 | -1 | -1 |
| Mode M0 | |||
|---|---|---|---|
| Quadrant | BADHDUFLAG | Total packets | Discarded packets |
| A | 0 | 23347 | 2 |
| B | 0 | 27105 | 2 |
| C | 0 | 22907 | 23 |
| D | 0 | 21734 | 2 |
| Mode SS | |||
|---|---|---|---|
| Quadrant | BADHDUFLAG | Total packets | Discarded packets |
| A | 0 | 110 | 0 |
| B | 0 | 110 | 0 |
| C | 0 | 110 | 0 |
| D | 0 | 110 | 0 |
| Quadrant | Total seconds | Saturated seconds | Saturation percentage |
|---|---|---|---|
| A | 5572 | 6 | 0.107681% |
| B | 5572 | 253 | 4.540560% |
| C | 5568 | 6 | 0.107759% |
| D | 5572 | 38 | 0.681981% |
Noise dominated data is calculated using 1-second bins in cleaned event files. If a bin has >2000 counts, and if more than 50% of those come from <1% of pixels, then it is considered to be noise-dominated and hence unusable.
| Quadrant | # 1 sec bins | Bins with >0 counts | Bins with >2000 counts | High rate bins dominated by noise | Noise dominated (total time) | Noise dominated (detector-on time) | Marked lightcurve |
|---|---|---|---|---|---|---|---|
| A | 6552 | 5573 | 145 | 145 | 2.21% | 2.60% | 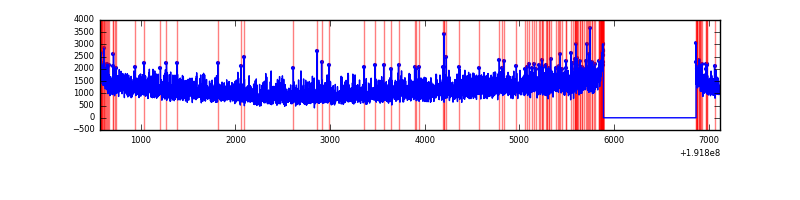 |
| B | 6552 | 5573 | 768 | 768 | 11.72% | 13.78% | 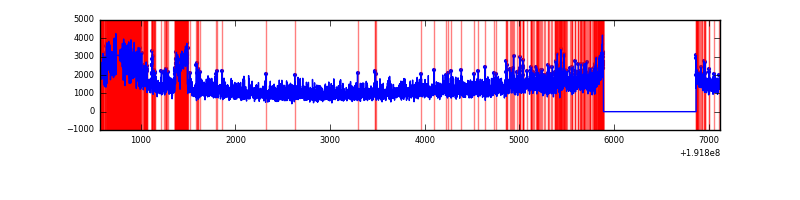 |
| C | 6552 | 5571 | 149 | 149 | 2.27% | 2.67% | 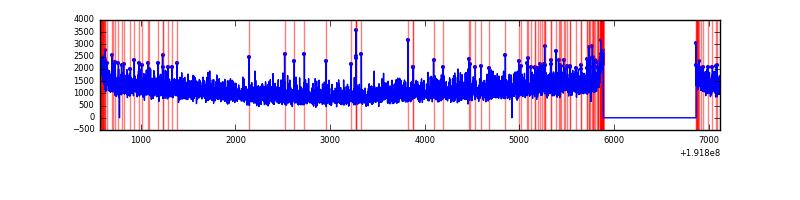 |
| D | 6552 | 5573 | 138 | 138 | 2.11% | 2.48% | 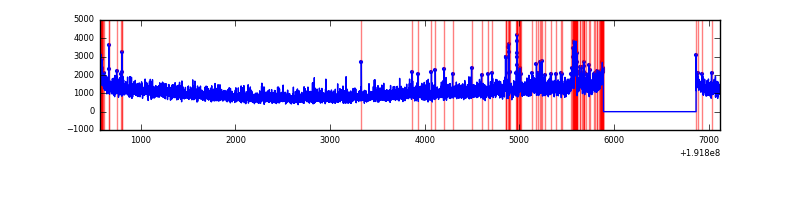 |
Top three noisy pixels from each quadrant. If the there are fewer than three noisy pixels in the level2.evt file, extra rows are filled as -1
| Pixel properties | Quadrant properties | ||||||
|---|---|---|---|---|---|---|---|
| Quadrant | DetID | PixID | Counts | Sigma | Mean | Median | Sigma |
| A | 0 | 128 | 5725 | 9.79 | 1704 | 1716 | 409.5 |
| A | 10 | 2 | 4064 | 5.73 | 1704 | 1716 | 409.5 |
| A | -1 | -1 | -1 | -1.0 | 1704 | 1716 | 409.5 |
| B | 0 | 187 | 855092 | 2089.94 | 1747 | 1756 | 408.3 |
| B | 8 | 3 | 259430 | 631.08 | 1747 | 1756 | 408.3 |
| B | 0 | 234 | 15199 | 32.92 | 1747 | 1756 | 408.3 |
| C | 9 | 236 | 36777 | 77.73 | 1616 | 1676 | 451.6 |
| C | 14 | 223 | 14935 | 29.36 | 1616 | 1676 | 451.6 |
| C | 9 | 54 | 12044 | 22.96 | 1616 | 1676 | 451.6 |
| D | 1 | 83 | 166738 | 343.43 | 1542 | 1594 | 480.9 |
| D | 13 | 88 | 16675 | 31.36 | 1542 | 1594 | 480.9 |
| D | 13 | 105 | 14915 | 27.7 | 1542 | 1594 | 480.9 |
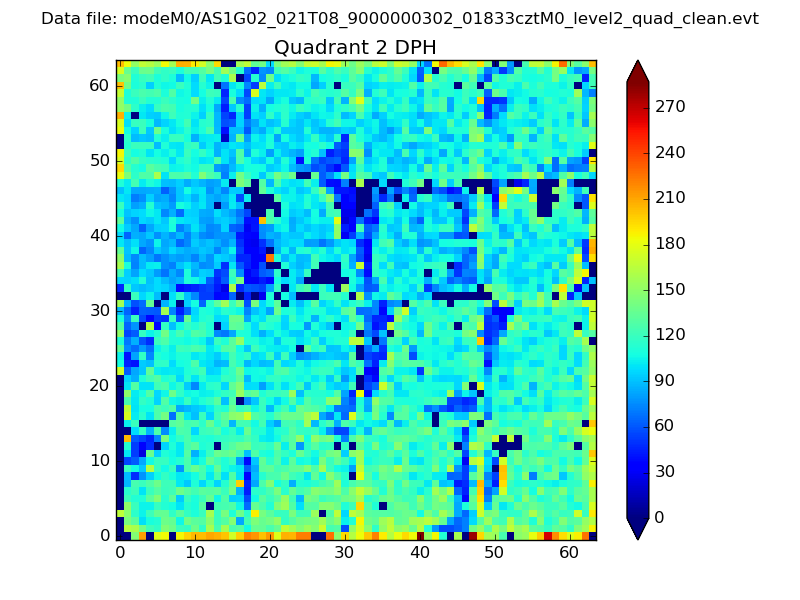
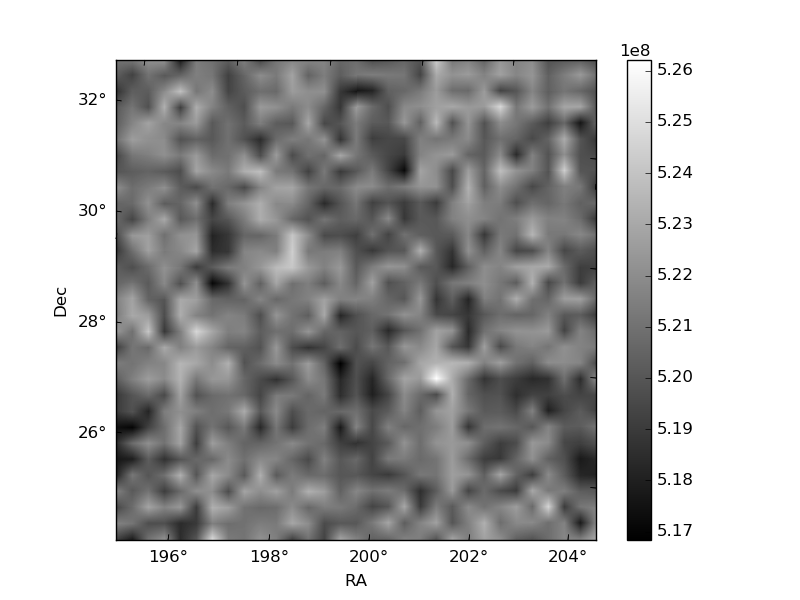
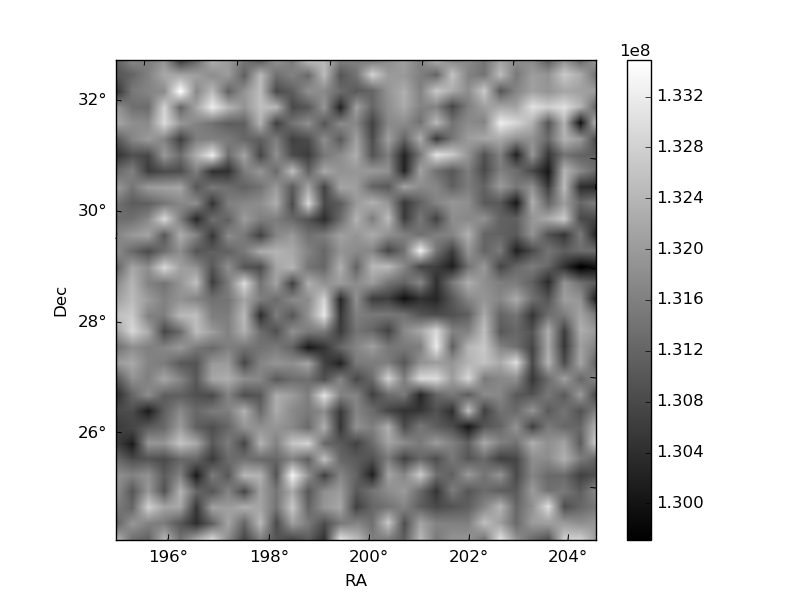
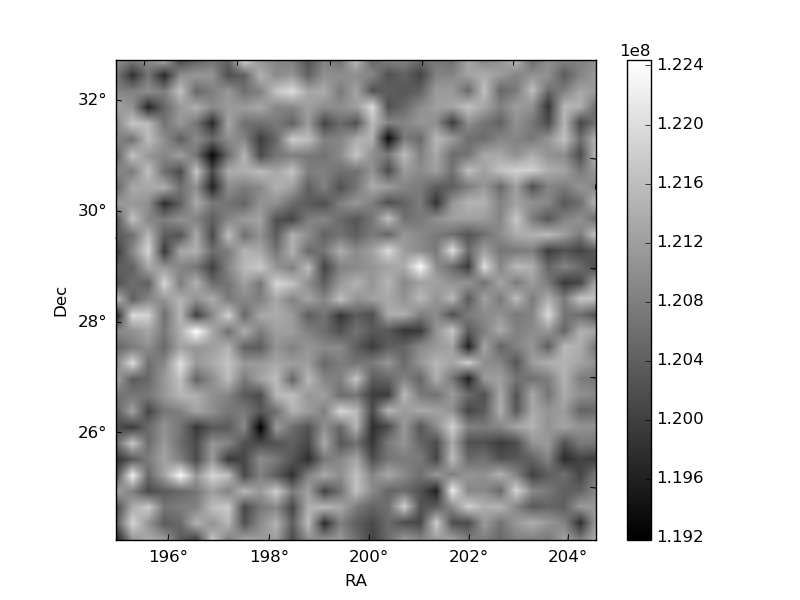
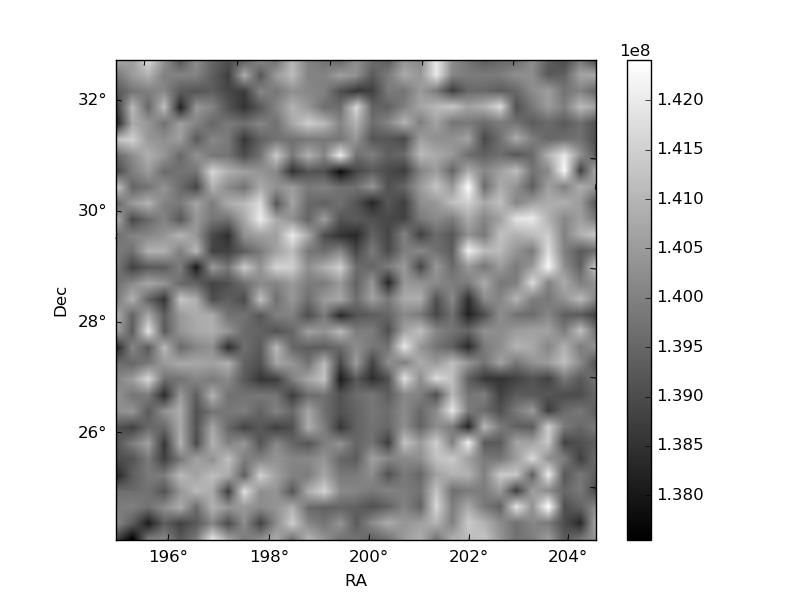
Histogram calculated using DETX and DETY for each event in the final _common_clean file
| Quadrant A | 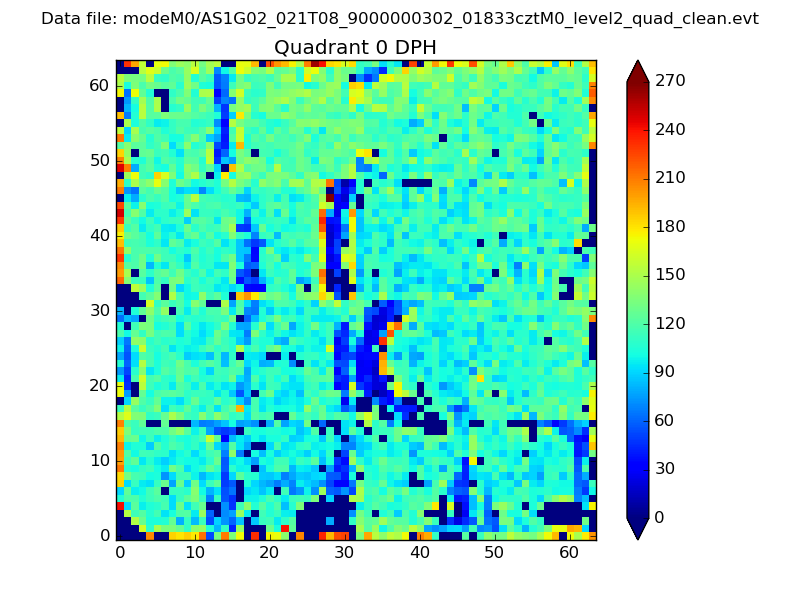 |
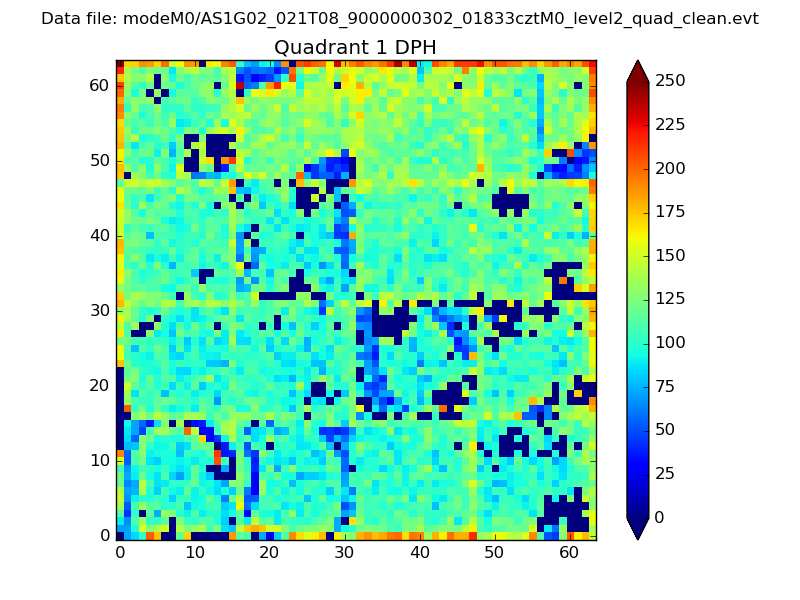 |
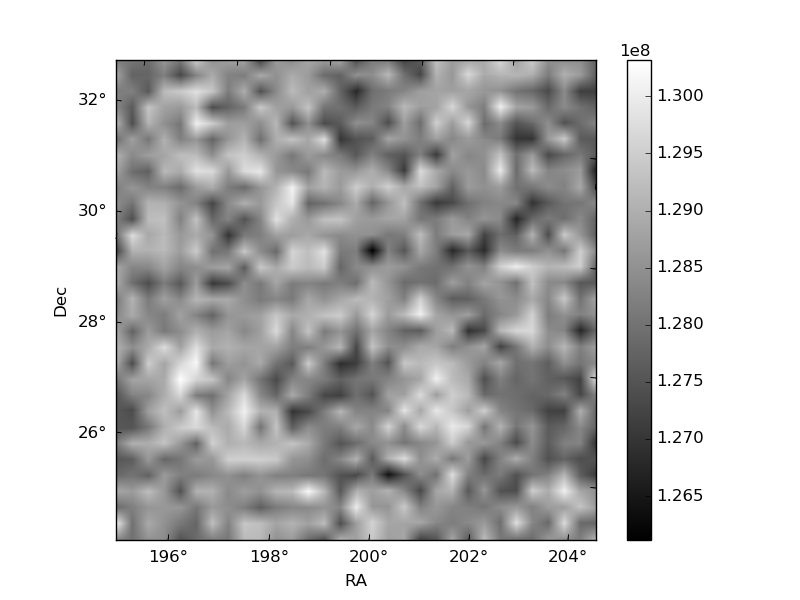
Quadrant B |
|---|---|---|---|
| Quadrant D | 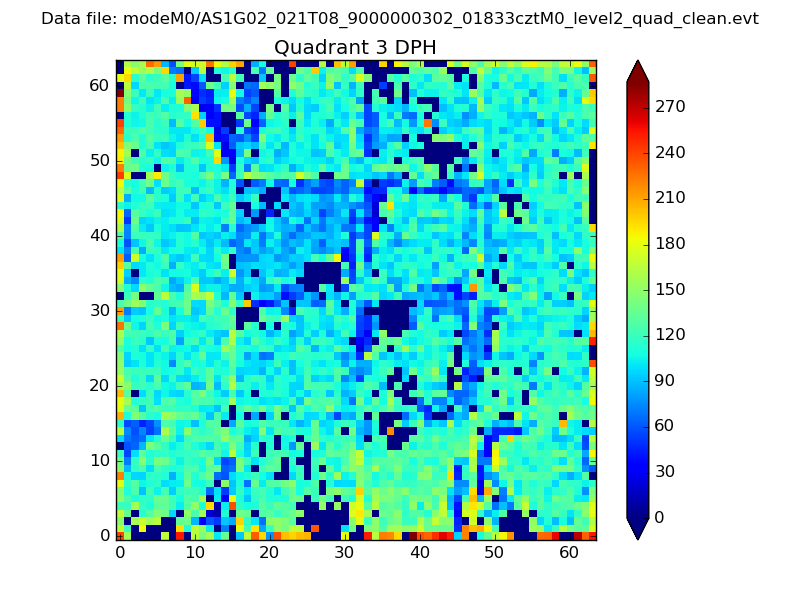 |
 |
Quadrant C |
| Plot type | Count rate plots | Images |
|---|---|---|
| Comparison with Poisson distribution Blue bars denote a histogram of data divided into 1 sec bins. Red curve is a Poisson curve with rate = median count rate of data. |
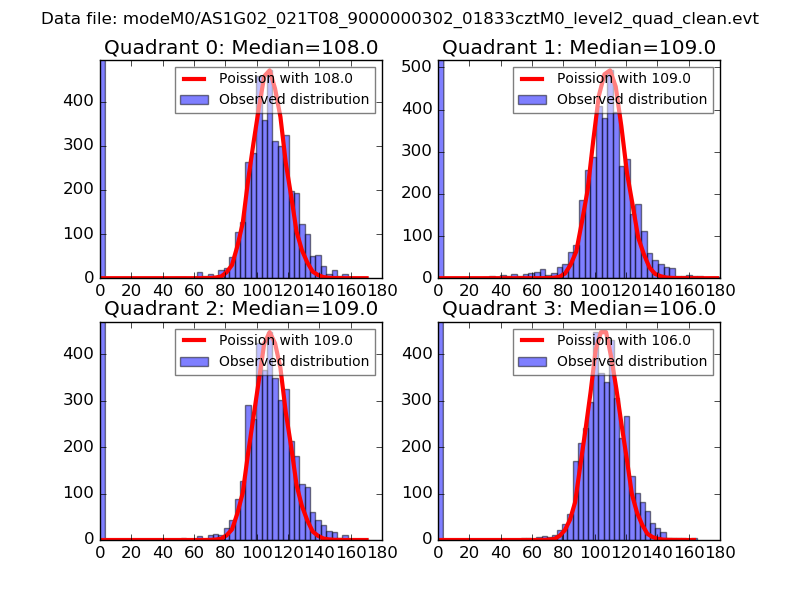 |
 |
| Quadrant-wise count rates Data is divided into 100 sec bins |
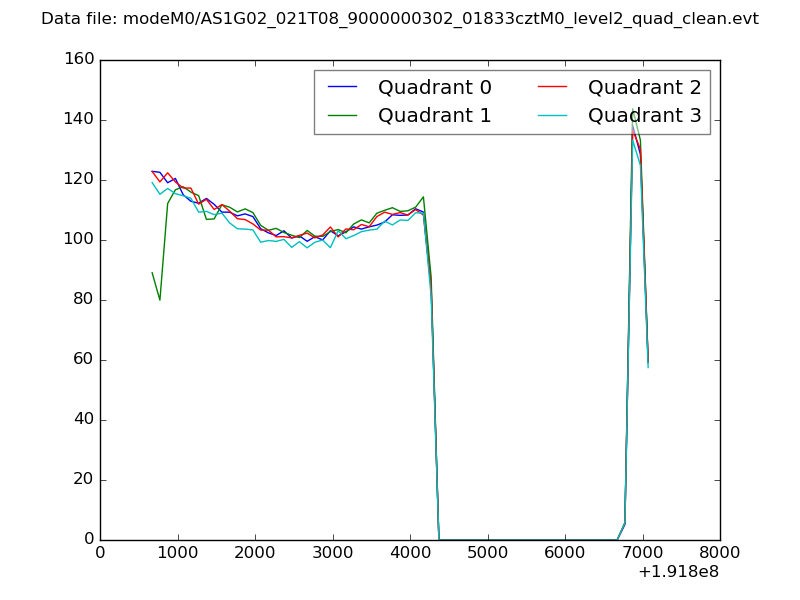 |
|
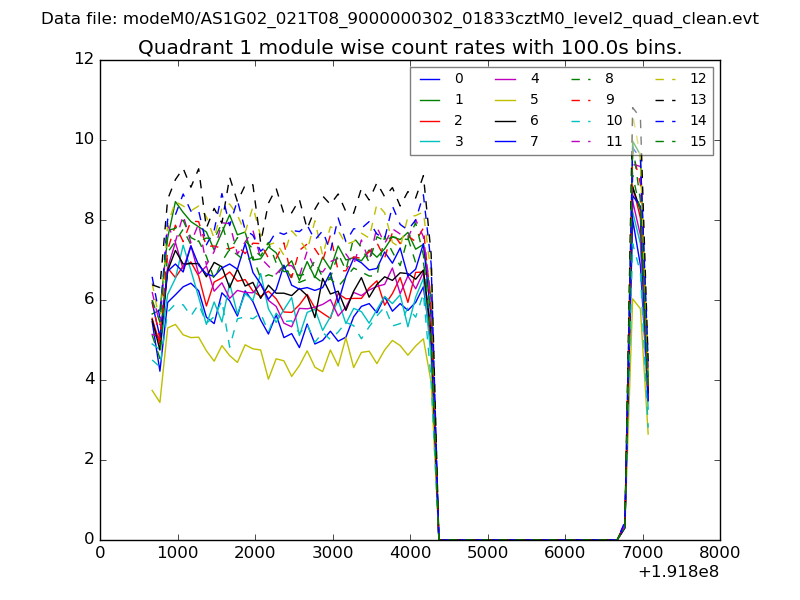
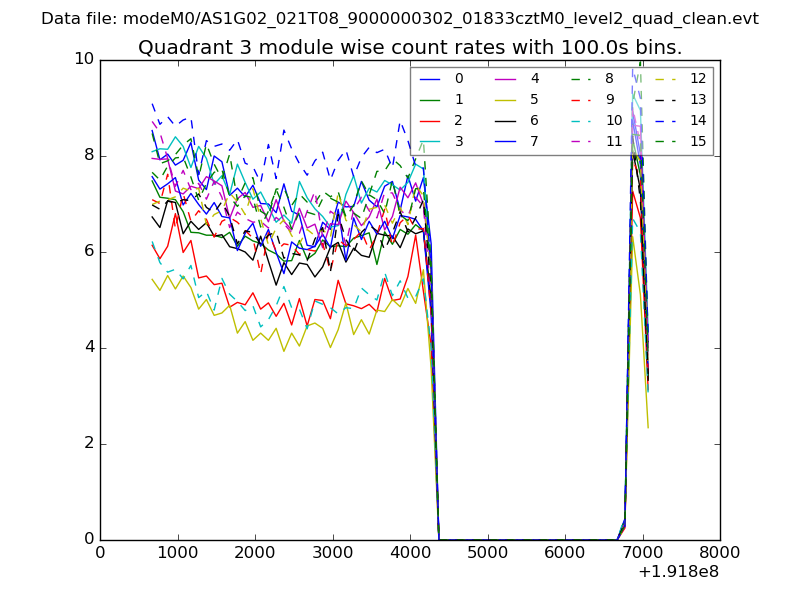
| Module-wise count rates for Quadrant A Data is divided into 100 sec bins |
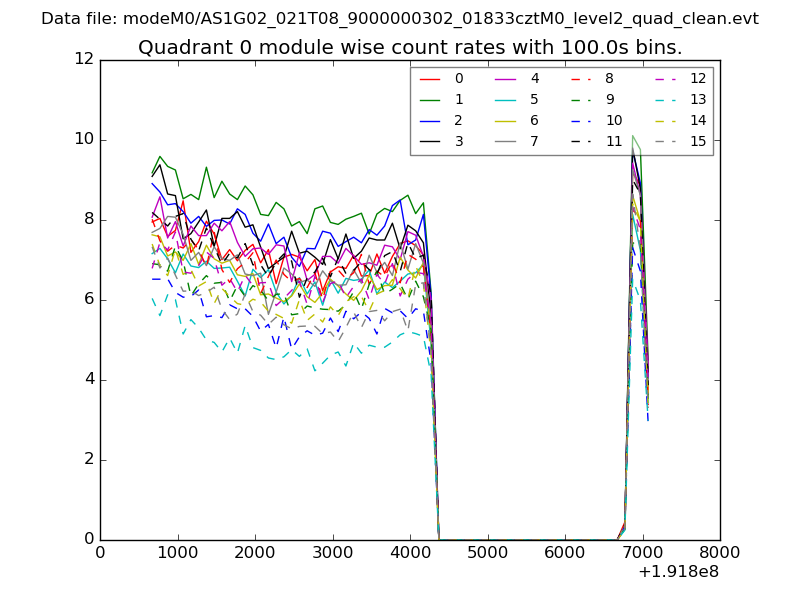 |
 |
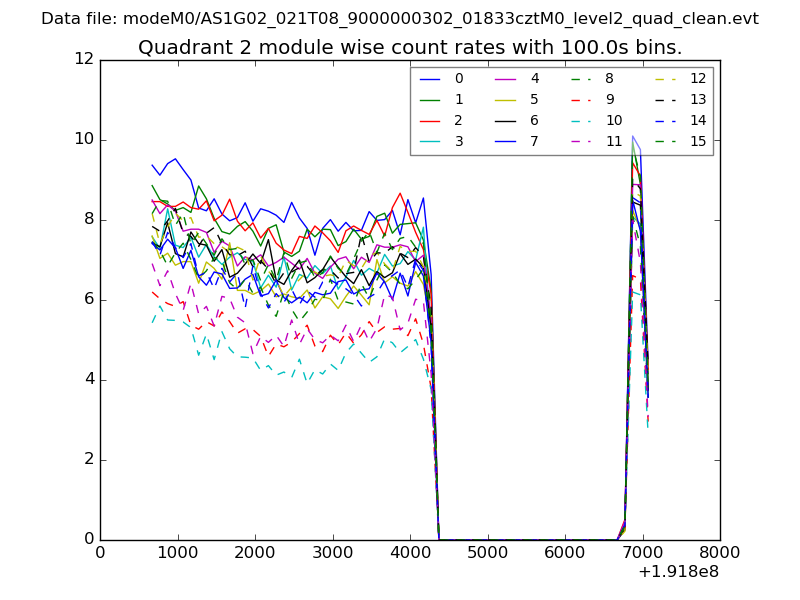
| Module-wise count rates for Quadrant B Data is divided into 100 sec bins |
 |
 |
| Module-wise count rates for Quadrant C Data is divided into 100 sec bins |
 |
 |
| Module-wise count rates for Quadrant D Data is divided into 100 sec bins |
 |
 |
| Parameter | Plot |
|---|---|
| CZT HV Monitor | 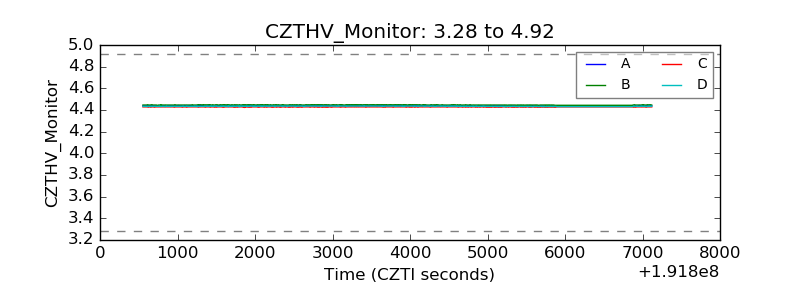 |
| D_VDD | 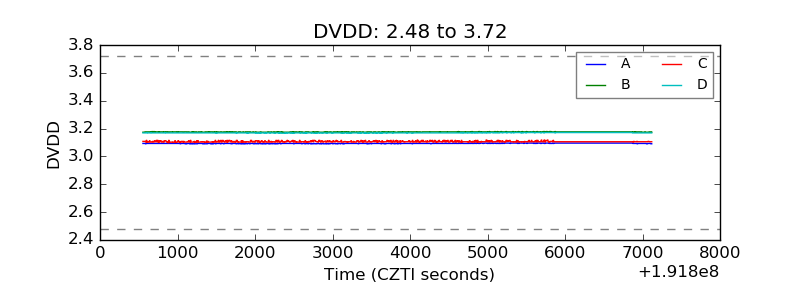 |
| Temperature 1 | 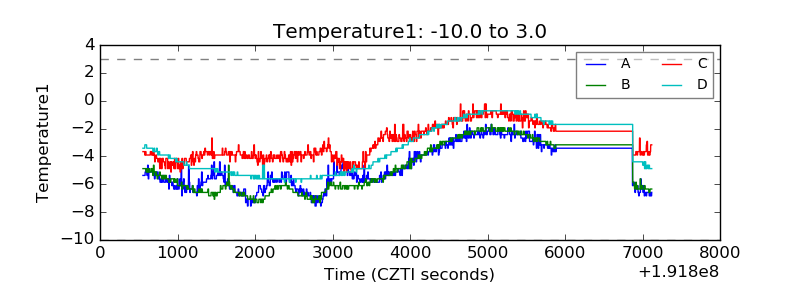 |
| Veto HV Monitor | 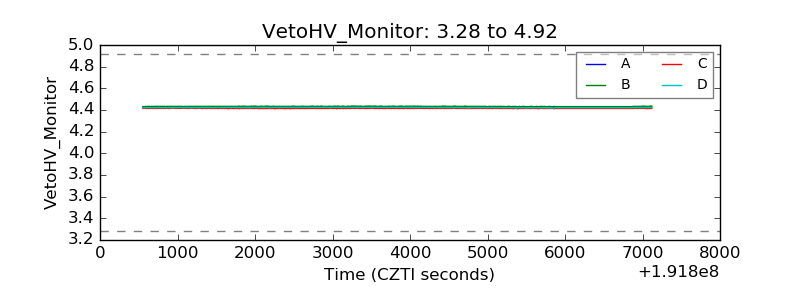 |
| Veto LLD | 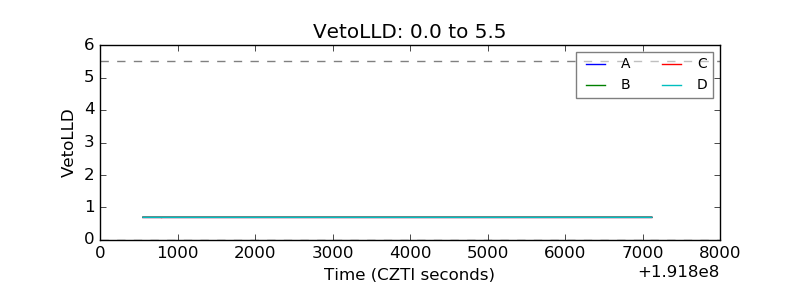 |
| Alpha Counter | 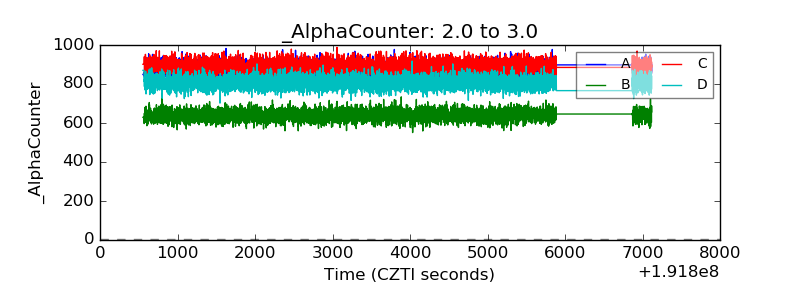 |
| _CPM_Rate | 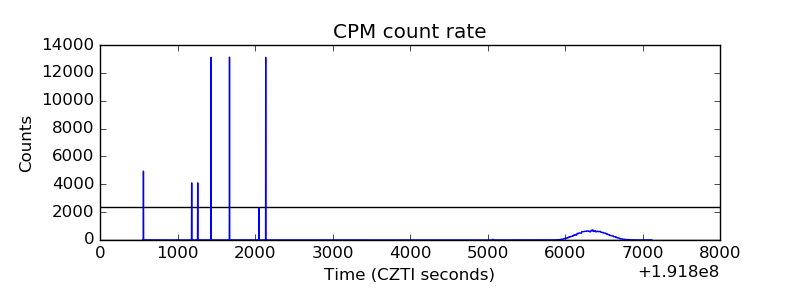 |
| CZT Counter | 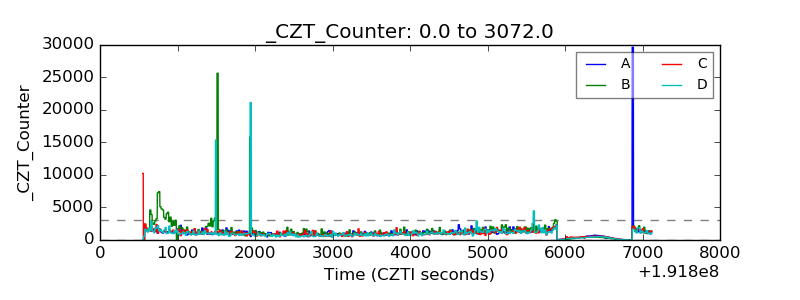 |
| +2.5 Volts monitor | 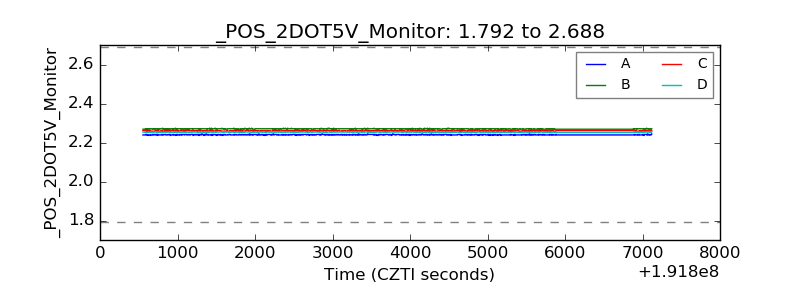 |
| +5 Volts monitor |  |
| _ROLL_ROT | 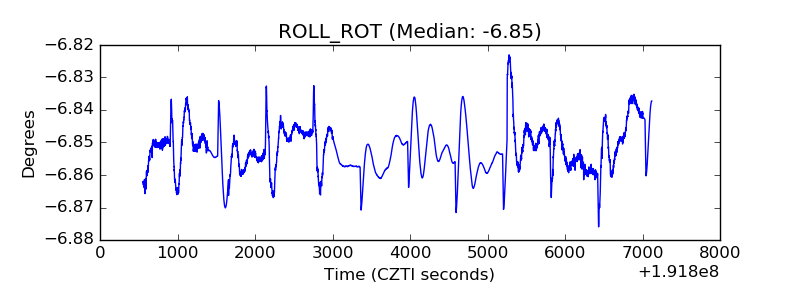 |
| _Roll_DEC | 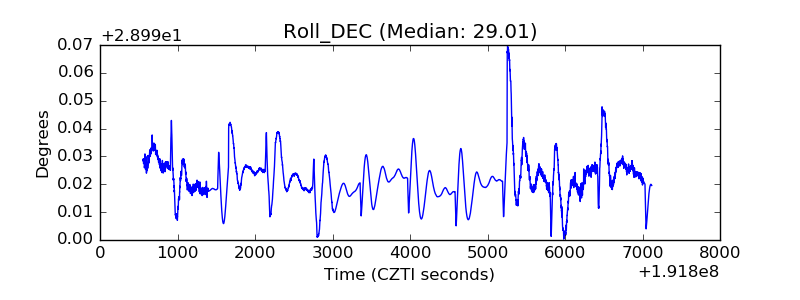 |
| _Roll_RA | 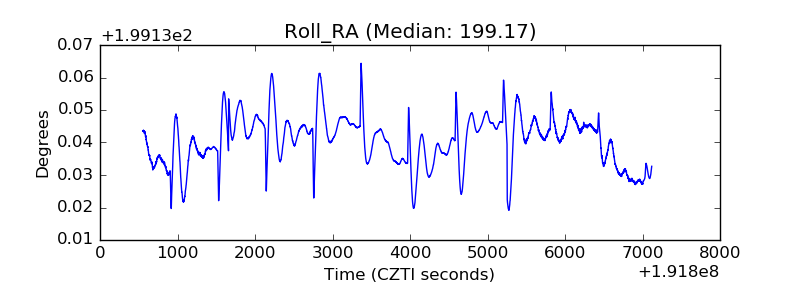 |
| Veto Counter | 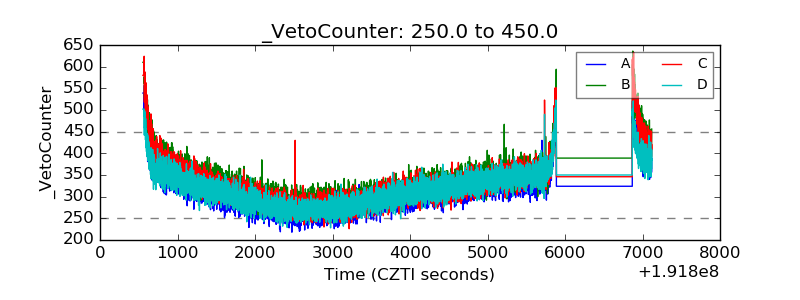 |