| Param | Original file | Final file |
|---|---|---|
| Filename | modeM0/AS1G02_021T08_9000000302_01836cztM0_level2.evt | modeM0/AS1G02_021T08_9000000302_01836cztM0_level2_quad_clean.evt |
| Size (bytes) | 1,639,206,720 | 131,618,880 |
| Size | 1.5 GB | 125.5 MB |
| Events in quadrant A | 12,191,893 | 819,045 |
| Events in quadrant B | 13,817,716 | 820,009 |
| Events in quadrant C | 11,815,516 | 818,329 |
| Events in quadrant D | 11,120,921 | 799,125 |
| Mode M9 | |||
|---|---|---|---|
| Quadrant | BADHDUFLAG | Total packets | Discarded packets |
| A | 0 | 1 | 0 |
| B | 1 | 1 | 0 |
| C | 1 | -1 | -1 |
| D | 1 | -1 | -1 |
| Mode M0 | |||
|---|---|---|---|
| Quadrant | BADHDUFLAG | Total packets | Discarded packets |
| A | 0 | 43732 | 2 |
| B | 0 | 48567 | 2 |
| C | 0 | 42647 | 23 |
| D | 0 | 40570 | 2 |
| Mode SS | |||
|---|---|---|---|
| Quadrant | BADHDUFLAG | Total packets | Discarded packets |
| A | 0 | 210 | 0 |
| B | 0 | 210 | 0 |
| C | 0 | 210 | 0 |
| D | 0 | 210 | 0 |
| Quadrant | Total seconds | Saturated seconds | Saturation percentage |
|---|---|---|---|
| A | 10540 | 13 | 0.123340% |
| B | 10540 | 285 | 2.703985% |
| C | 10536 | 18 | 0.170843% |
| D | 10540 | 42 | 0.398482% |
Noise dominated data is calculated using 1-second bins in cleaned event files. If a bin has >2000 counts, and if more than 50% of those come from <1% of pixels, then it is considered to be noise-dominated and hence unusable.
| Quadrant | # 1 sec bins | Bins with >0 counts | Bins with >2000 counts | High rate bins dominated by noise | Noise dominated (total time) | Noise dominated (detector-on time) | Marked lightcurve |
|---|---|---|---|---|---|---|---|
| A | 12330 | 10542 | 262 | 262 | 2.12% | 2.49% | 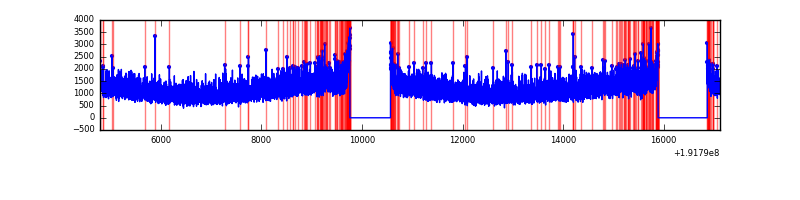 |
| B | 12330 | 10542 | 970 | 970 | 7.87% | 9.20% | 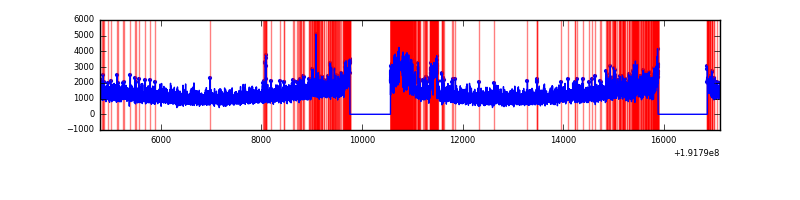 |
| C | 12330 | 10540 | 261 | 261 | 2.12% | 2.48% | 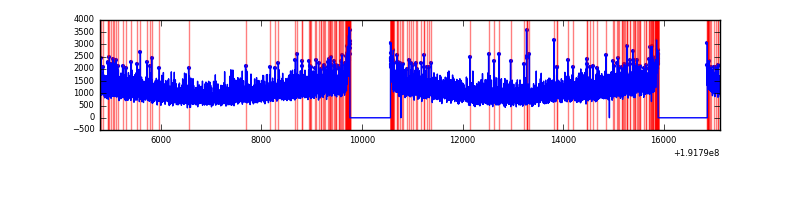 |
| D | 12330 | 10542 | 212 | 212 | 1.72% | 2.01% | 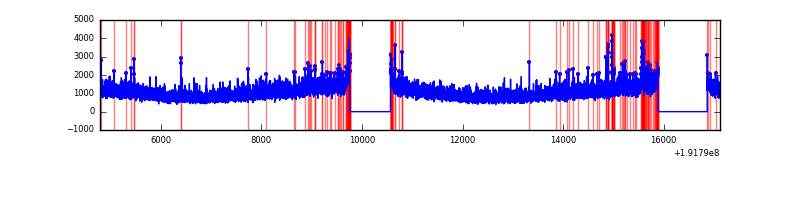 |
Top three noisy pixels from each quadrant. If the there are fewer than three noisy pixels in the level2.evt file, extra rows are filled as -1
| Pixel properties | Quadrant properties | ||||||
|---|---|---|---|---|---|---|---|
| Quadrant | DetID | PixID | Counts | Sigma | Mean | Median | Sigma |
| A | 10 | 2 | 8355 | 6.7 | 3187 | 3209 | 767.6 |
| A | -1 | -1 | -1 | -1.0 | 3187 | 3209 | 767.6 |
| A | -1 | -1 | -1 | -1.0 | 3187 | 3209 | 767.6 |
| B | 0 | 187 | 918597 | 1186.3 | 3293 | 3316 | 771.5 |
| B | 8 | 3 | 334077 | 428.7 | 3293 | 3316 | 771.5 |
| B | 0 | 234 | 25720 | 29.04 | 3293 | 3316 | 771.5 |
| C | 9 | 236 | 39183 | 42.97 | 3011 | 3121 | 839.2 |
| C | 14 | 223 | 16310 | 15.72 | 3011 | 3121 | 839.2 |
| C | 9 | 54 | 15357 | 14.58 | 3011 | 3121 | 839.2 |
| D | 1 | 83 | 168648 | 184.79 | 2892 | 2997 | 896.4 |
| D | 13 | 105 | 92840 | 100.22 | 2892 | 2997 | 896.4 |
| D | 7 | 85 | 25380 | 24.97 | 2892 | 2997 | 896.4 |
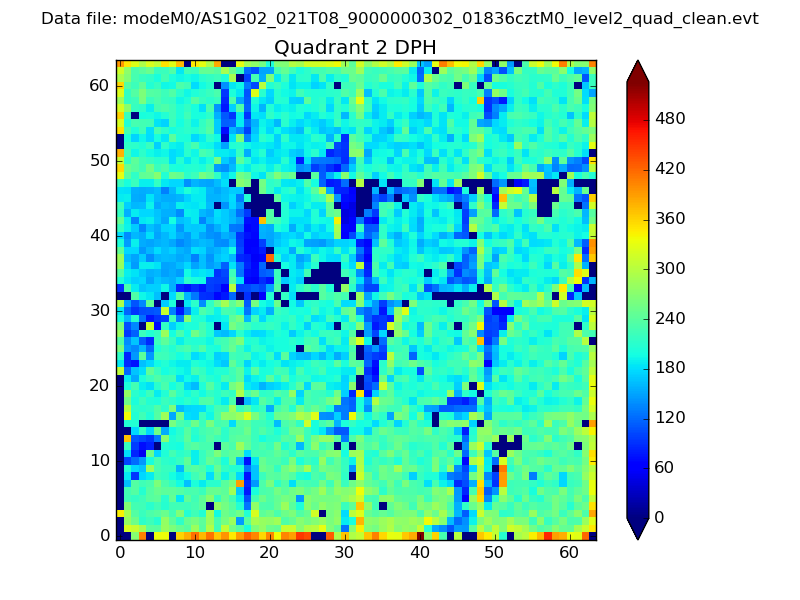
Histogram calculated using DETX and DETY for each event in the final _common_clean file
| Quadrant A | 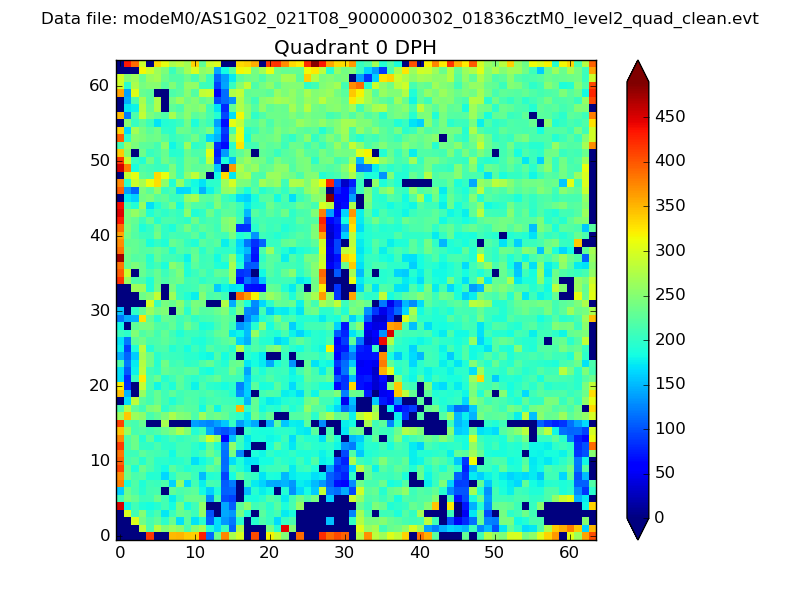 |
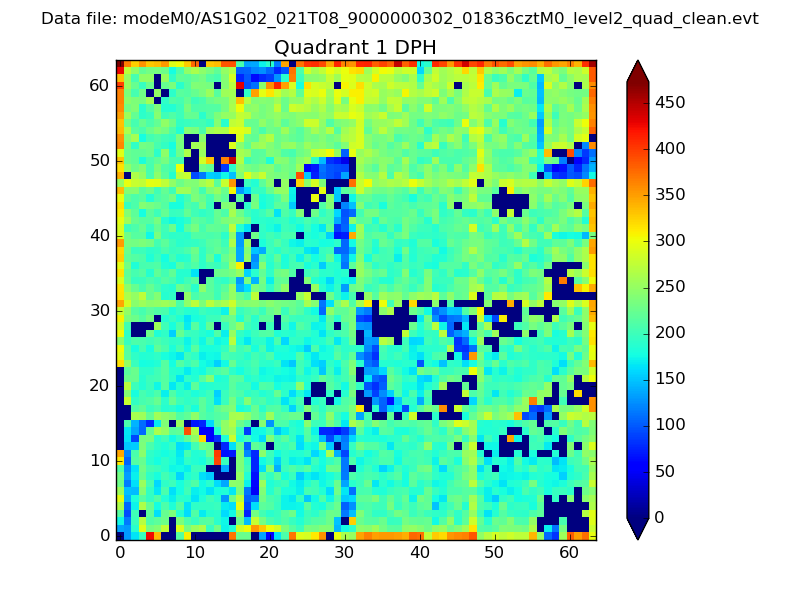 |
Quadrant B |
|---|---|---|---|
| Quadrant D | 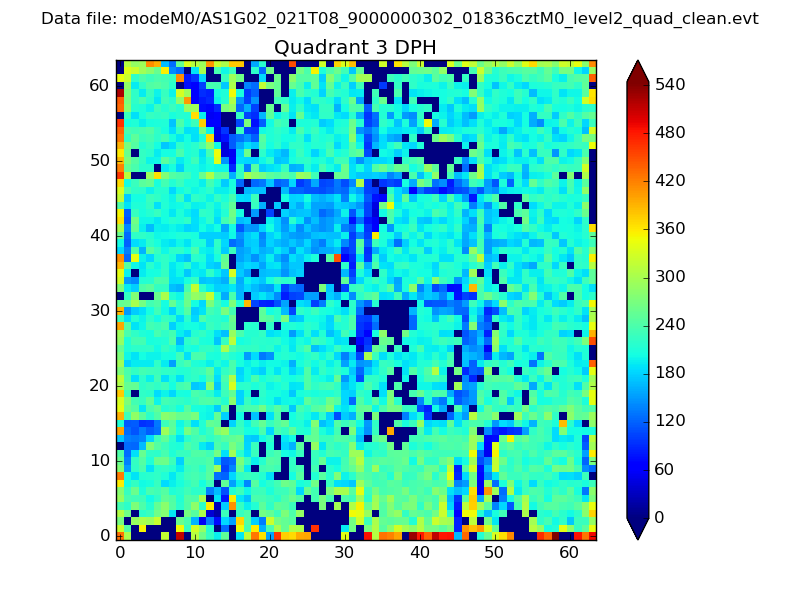 |
 |
Quadrant C |
| Plot type | Count rate plots | Images |
|---|---|---|
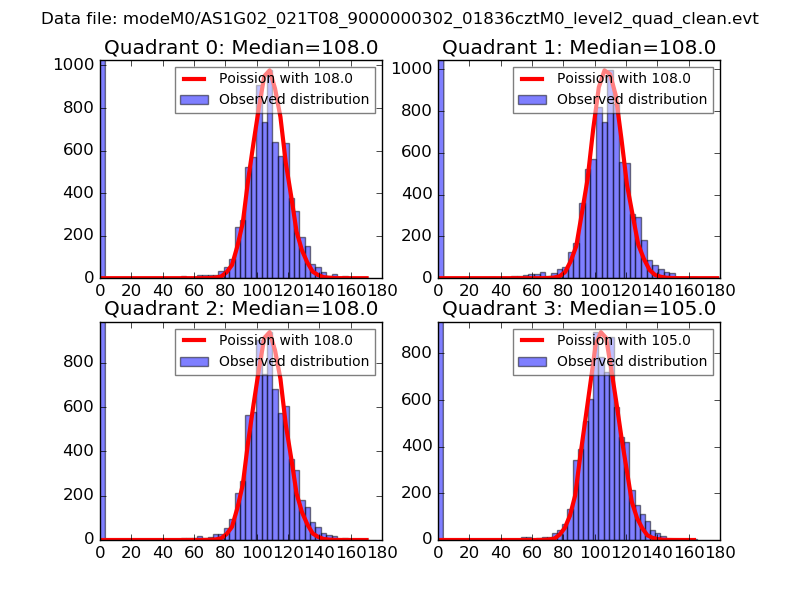
| Comparison with Poisson distribution Blue bars denote a histogram of data divided into 1 sec bins. Red curve is a Poisson curve with rate = median count rate of data. |
 |
 |
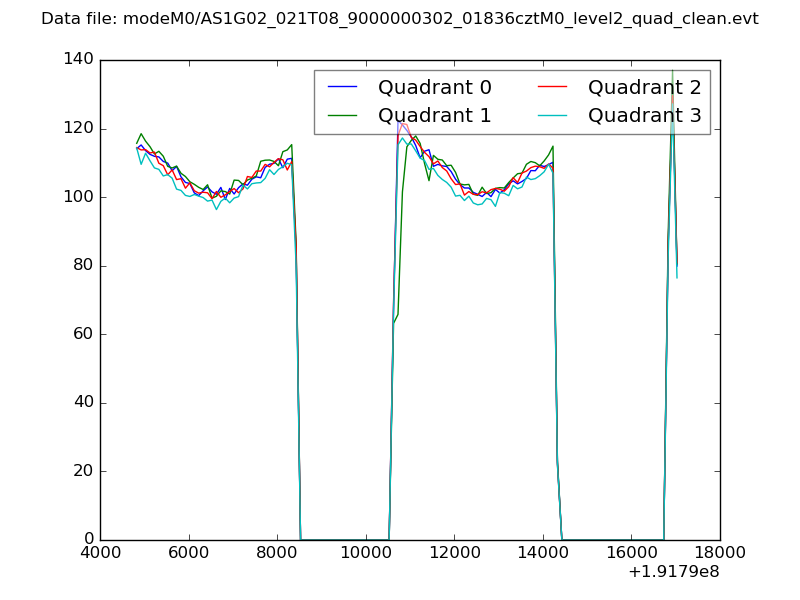
| Quadrant-wise count rates Data is divided into 100 sec bins |
 |
|
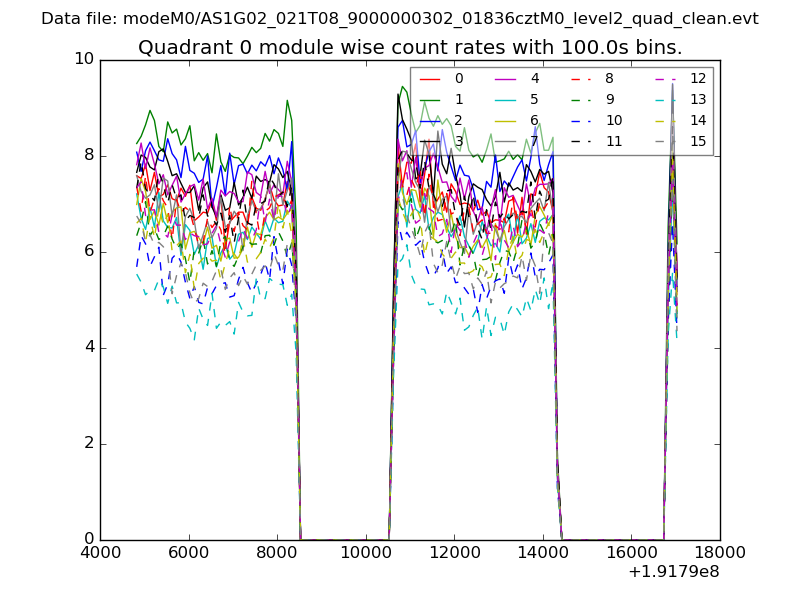
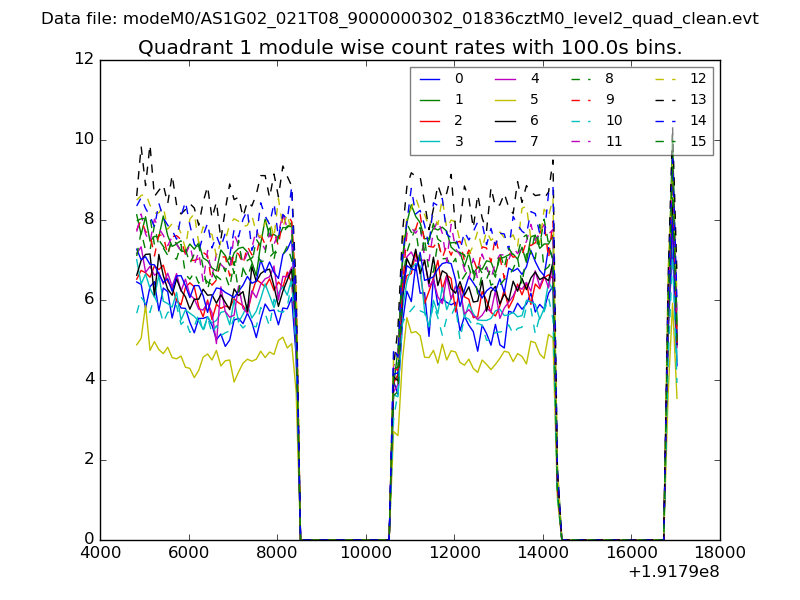
| Module-wise count rates for Quadrant A Data is divided into 100 sec bins |
 |
 |
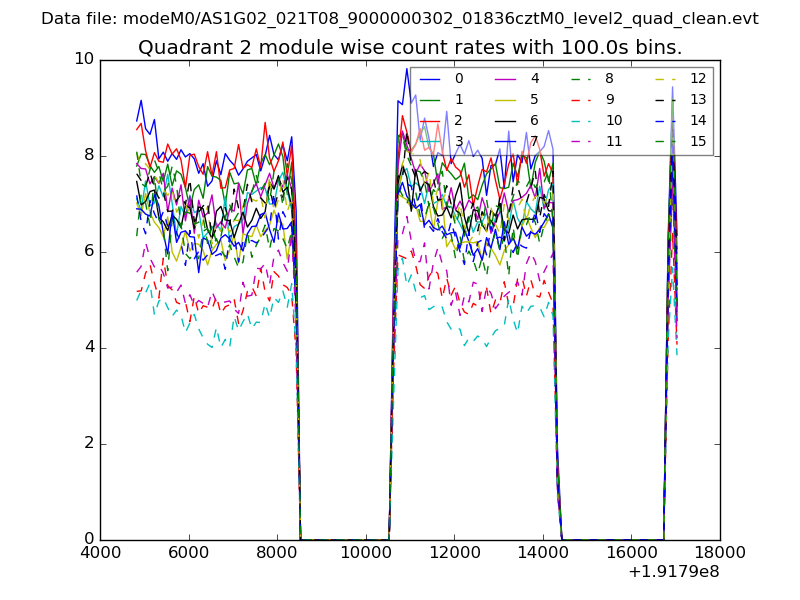
| Module-wise count rates for Quadrant B Data is divided into 100 sec bins |
 |
 |
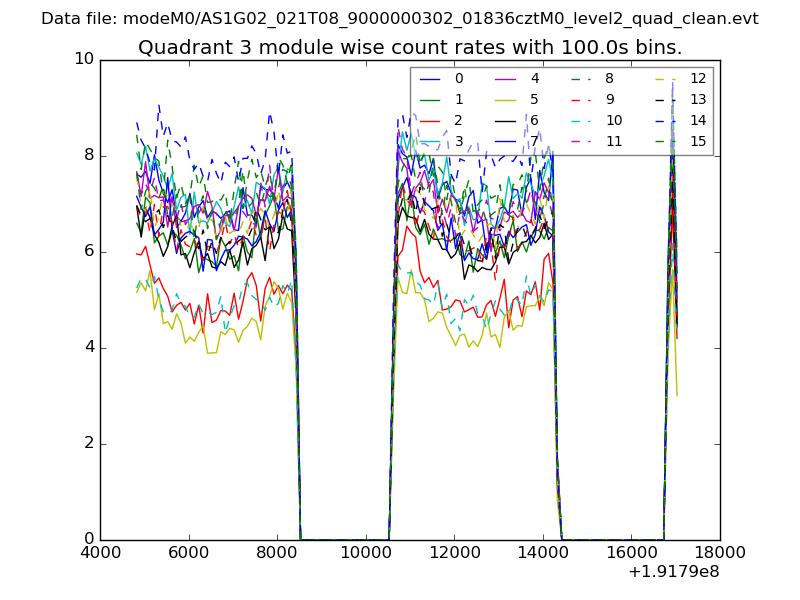
| Module-wise count rates for Quadrant C Data is divided into 100 sec bins |
 |
 |
| Module-wise count rates for Quadrant D Data is divided into 100 sec bins |
 |
 |
| Parameter | Plot |
|---|---|
| CZT HV Monitor | 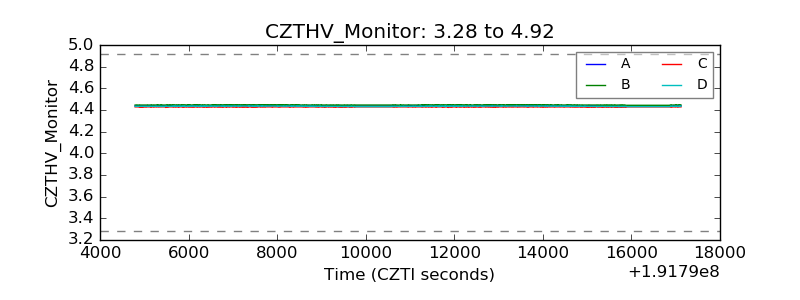 |
| D_VDD | 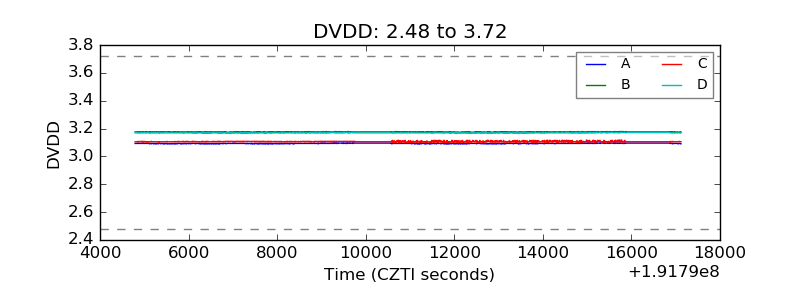 |
| Temperature 1 | 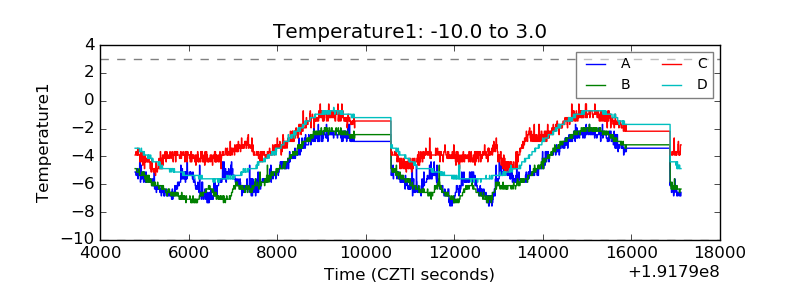 |
| Veto HV Monitor | 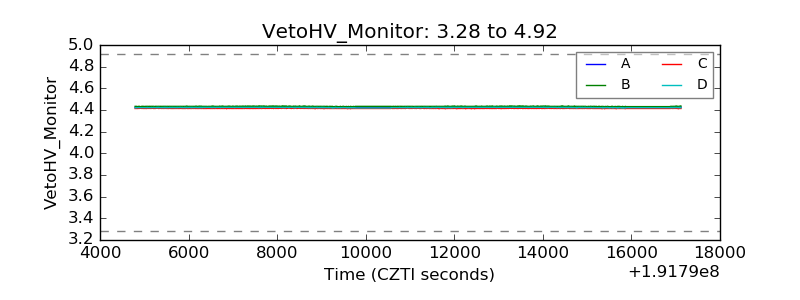 |
| Veto LLD | 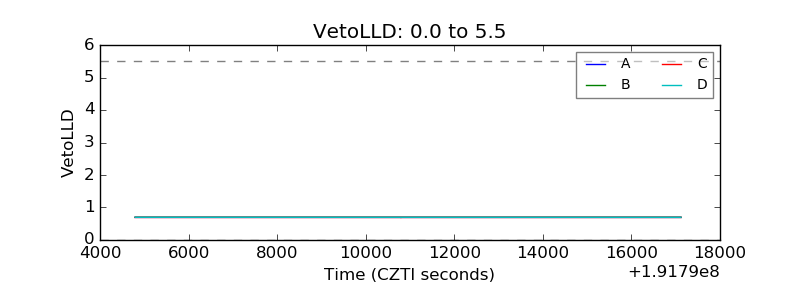 |
| Alpha Counter | 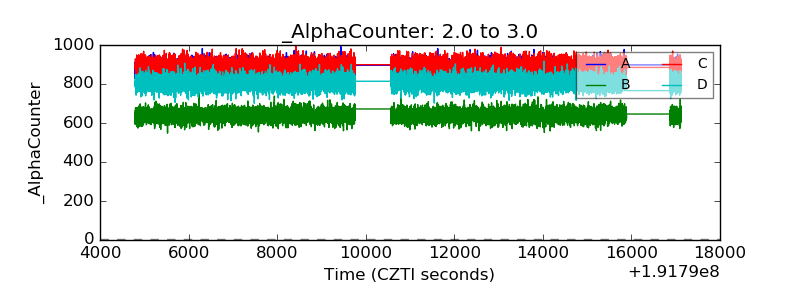 |
| _CPM_Rate | 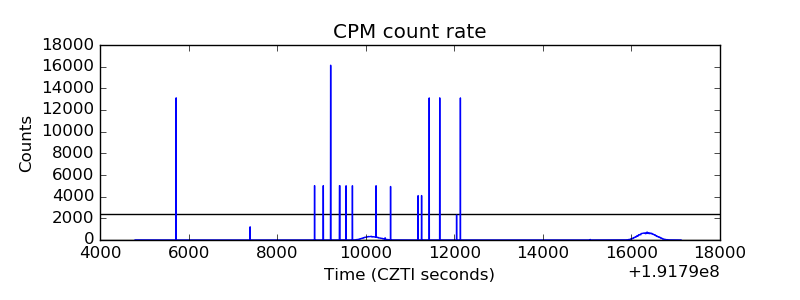 |
| CZT Counter |  |
| +2.5 Volts monitor | 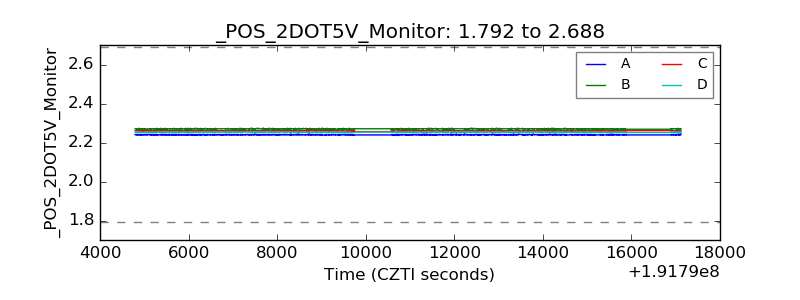 |
| +5 Volts monitor |  |
| _ROLL_ROT | 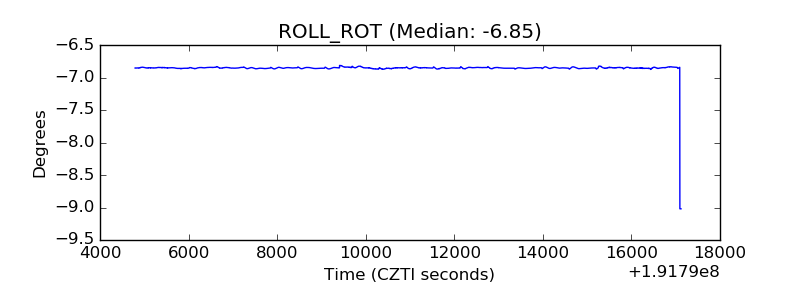 |
| _Roll_DEC | 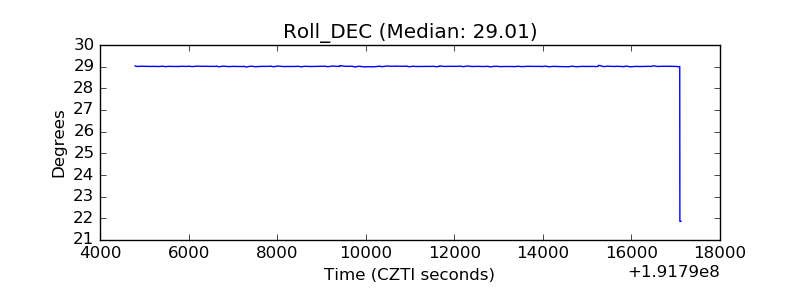 |
| _Roll_RA | 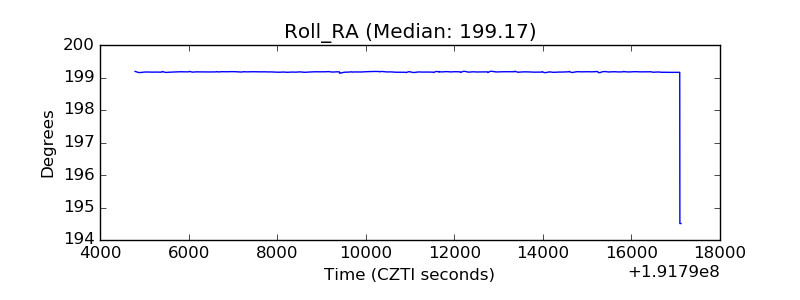 |
| Veto Counter | 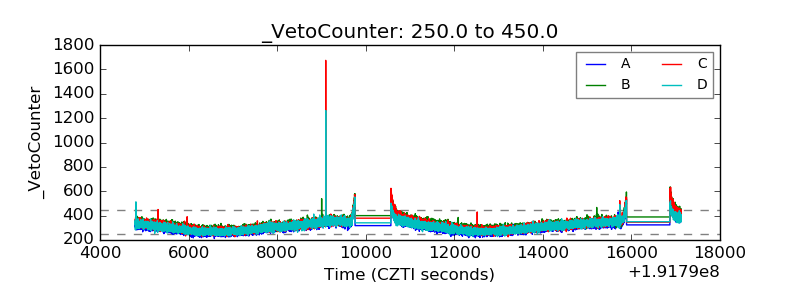 |