| Param | Original file | Final file |
|---|---|---|
| Filename | modeM0/AS1G02_021T10_9000000304_01851cztM0_level2.evt | modeM0/AS1G02_021T10_9000000304_01851cztM0_level2_quad_clean.evt |
| Size (bytes) | 1,003,769,280 | 76,674,240 |
| Size | 957.3 MB | 73.1 MB |
| Events in quadrant A | 7,914,916 | 465,323 |
| Events in quadrant B | 7,878,216 | 478,113 |
| Events in quadrant C | 7,371,929 | 467,807 |
| Events in quadrant D | 6,798,544 | 453,147 |
| Mode SS | |||
|---|---|---|---|
| Quadrant | BADHDUFLAG | Total packets | Discarded packets |
| A | 0 | 130 | 0 |
| B | 0 | 130 | 0 |
| C | 0 | 130 | 0 |
| D | 0 | 130 | 0 |
| Mode M0 | |||
|---|---|---|---|
| Quadrant | BADHDUFLAG | Total packets | Discarded packets |
| A | 0 | 28215 | 2 |
| B | 0 | 28076 | 2 |
| C | 0 | 26560 | 10 |
| D | 0 | 24933 | 2 |
| Mode M9 | |||
|---|---|---|---|
| Quadrant | BADHDUFLAG | Total packets | Discarded packets |
| A | 0 | 1 | 0 |
| B | 1 | 1 | 0 |
| C | 1 | -1 | -1 |
| D | 1 | -1 | -1 |
| Quadrant | Total seconds | Saturated seconds | Saturation percentage |
|---|---|---|---|
| A | 6561 | 13 | 0.198141% |
| B | 6561 | 5 | 0.076208% |
| C | 6559 | 12 | 0.182955% |
| D | 6561 | 8 | 0.121933% |
Noise dominated data is calculated using 1-second bins in cleaned event files. If a bin has >2000 counts, and if more than 50% of those come from <1% of pixels, then it is considered to be noise-dominated and hence unusable.
| Quadrant | # 1 sec bins | Bins with >0 counts | Bins with >2000 counts | High rate bins dominated by noise | Noise dominated (total time) | Noise dominated (detector-on time) | Marked lightcurve |
|---|---|---|---|---|---|---|---|
| A | 7801 | 6562 | 351 | 351 | 4.50% | 5.35% | 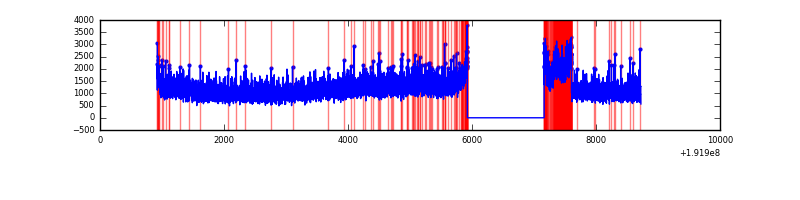 |
| B | 7801 | 6562 | 155 | 155 | 1.99% | 2.36% | 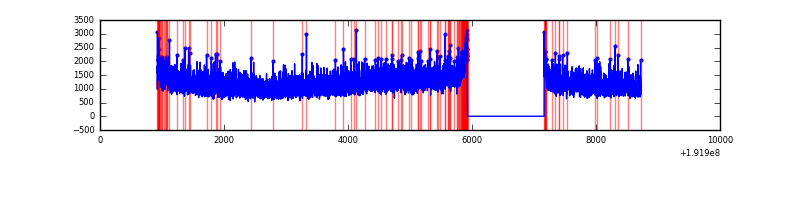 |
| C | 7801 | 6561 | 137 | 137 | 1.76% | 2.09% | 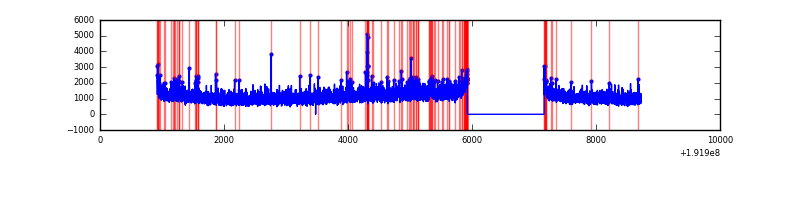 |
| D | 7801 | 6562 | 80 | 80 | 1.03% | 1.22% | 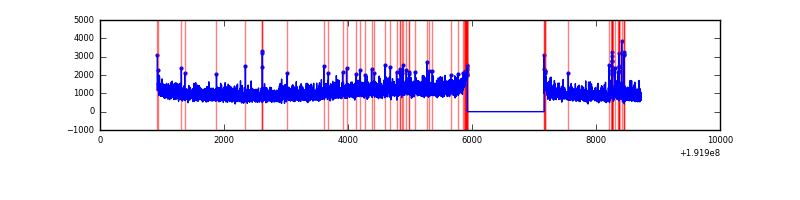 |
Top three noisy pixels from each quadrant. If the there are fewer than three noisy pixels in the level2.evt file, extra rows are filled as -1
| Pixel properties | Quadrant properties | ||||||
|---|---|---|---|---|---|---|---|
| Quadrant | DetID | PixID | Counts | Sigma | Mean | Median | Sigma |
| A | 15 | 236 | 374042 | 793.79 | 1972 | 1987 | 468.7 |
| A | 10 | 2 | 4870 | 6.15 | 1972 | 1987 | 468.7 |
| A | -1 | -1 | -1 | -1.0 | 1972 | 1987 | 468.7 |
| B | 0 | 220 | 18813 | 34.47 | 2072 | 2082 | 485.4 |
| B | 8 | 3 | 9621 | 15.53 | 2072 | 2082 | 485.4 |
| B | 4 | 48 | 7083 | 10.3 | 2072 | 2082 | 485.4 |
| C | 14 | 223 | 47839 | 88.43 | 1864 | 1928 | 519.2 |
| C | 9 | 191 | 26367 | 47.07 | 1864 | 1928 | 519.2 |
| C | 14 | 48 | 23405 | 41.37 | 1864 | 1928 | 519.2 |
| D | 1 | 84 | 67479 | 118.94 | 1793 | 1859 | 551.7 |
| D | 10 | 255 | 12604 | 19.48 | 1793 | 1859 | 551.7 |
| D | 2 | 54 | 11525 | 17.52 | 1793 | 1859 | 551.7 |
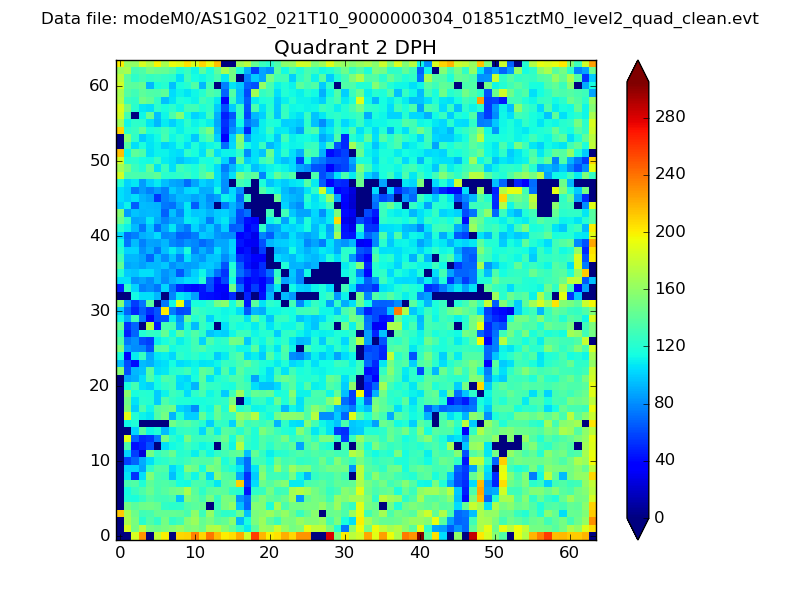
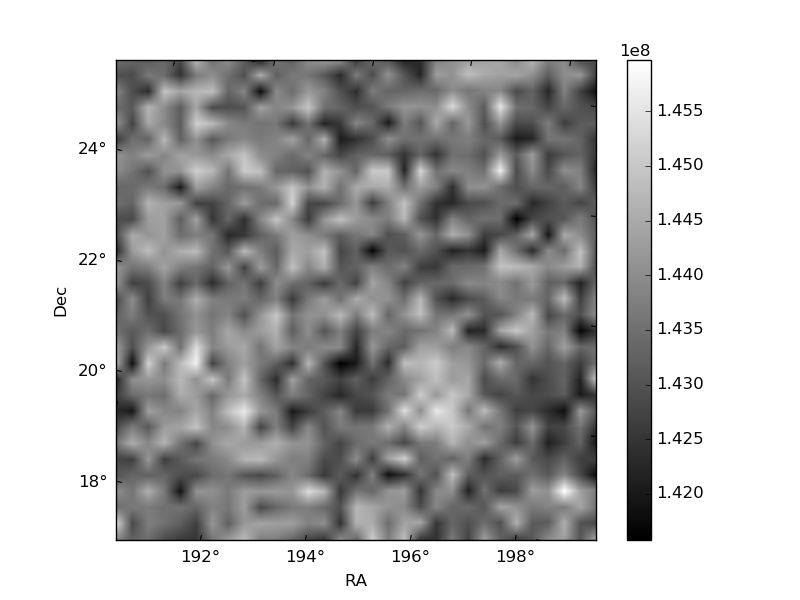
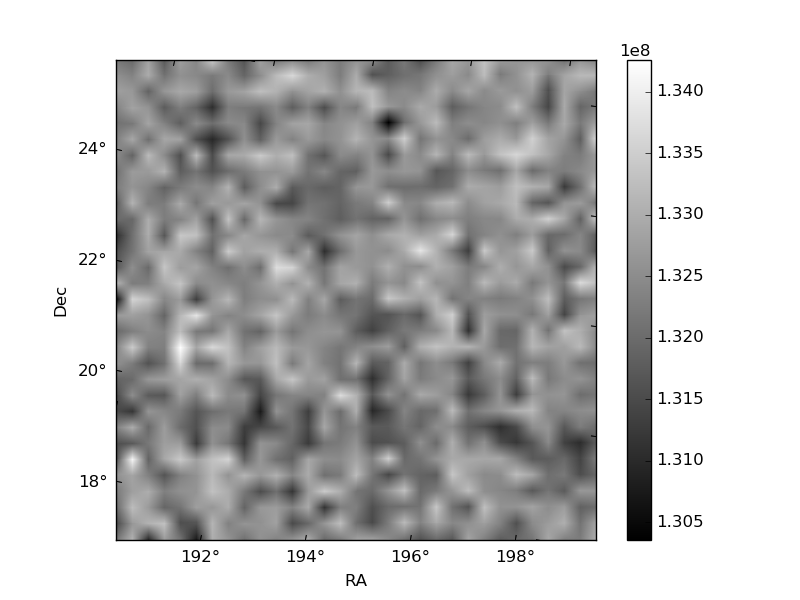
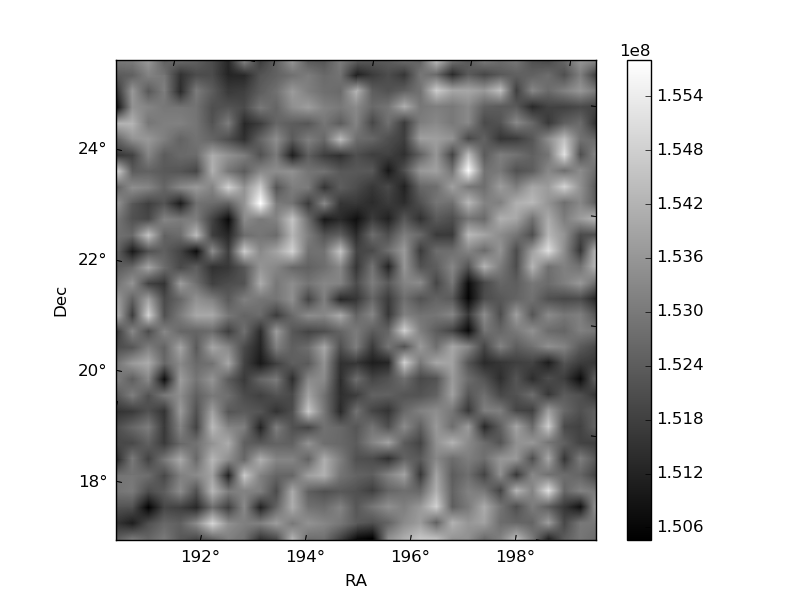
Histogram calculated using DETX and DETY for each event in the final _common_clean file
| Quadrant A | 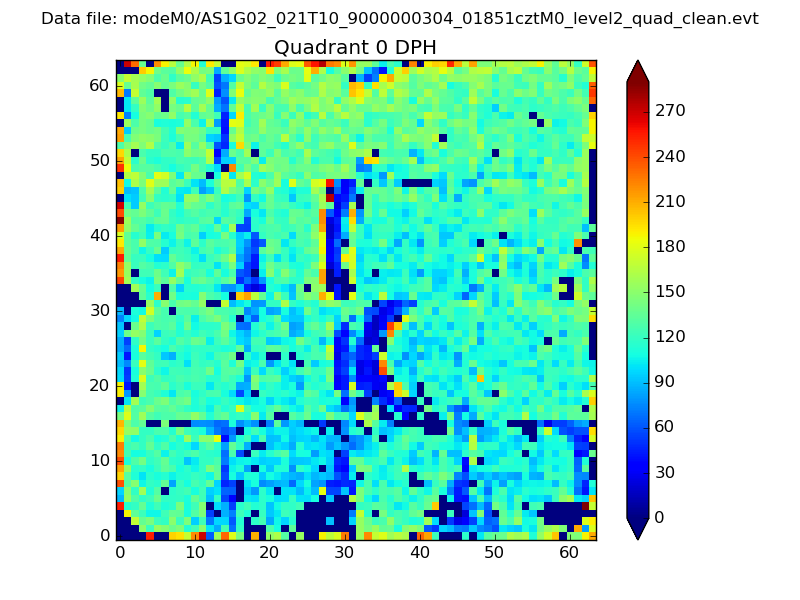 |
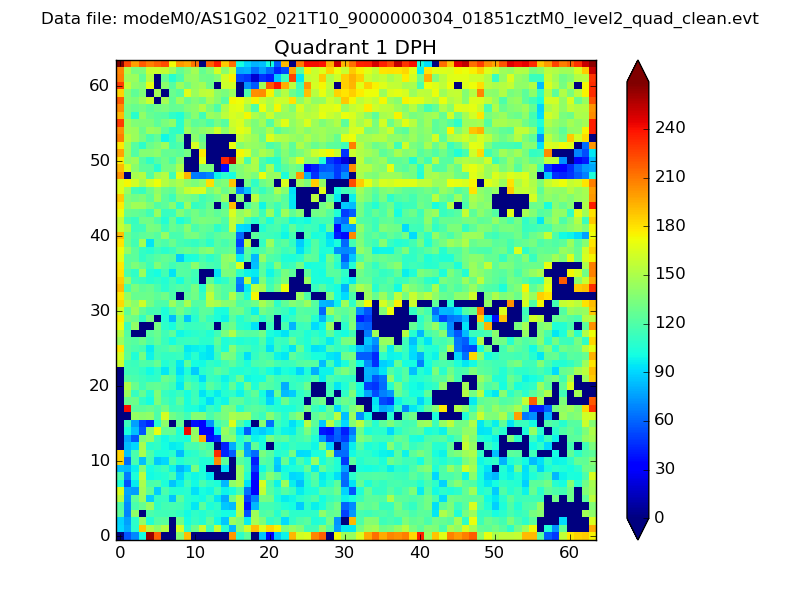 |
Quadrant B |
|---|---|---|---|
| Quadrant D | 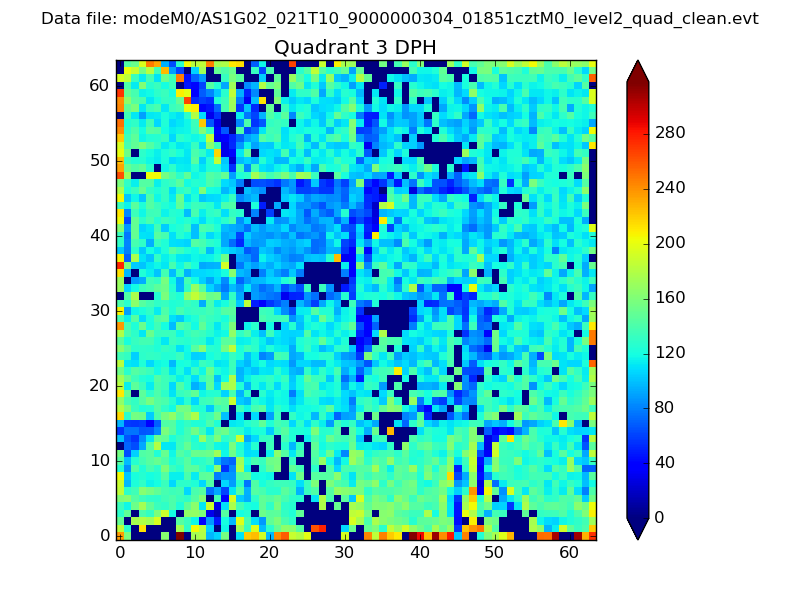 |
 |
Quadrant C |
| Plot type | Count rate plots | Images |
|---|---|---|
| Comparison with Poisson distribution Blue bars denote a histogram of data divided into 1 sec bins. Red curve is a Poisson curve with rate = median count rate of data. |
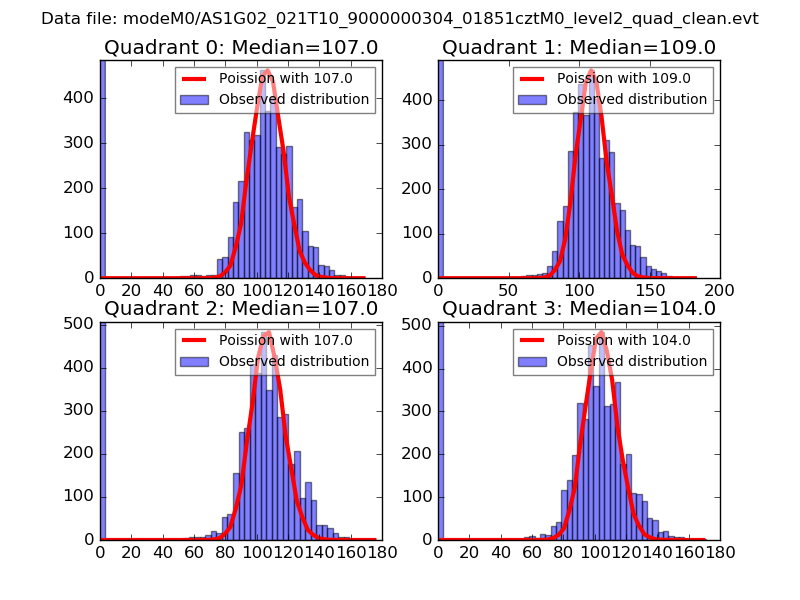 |
 |
| Quadrant-wise count rates Data is divided into 100 sec bins |
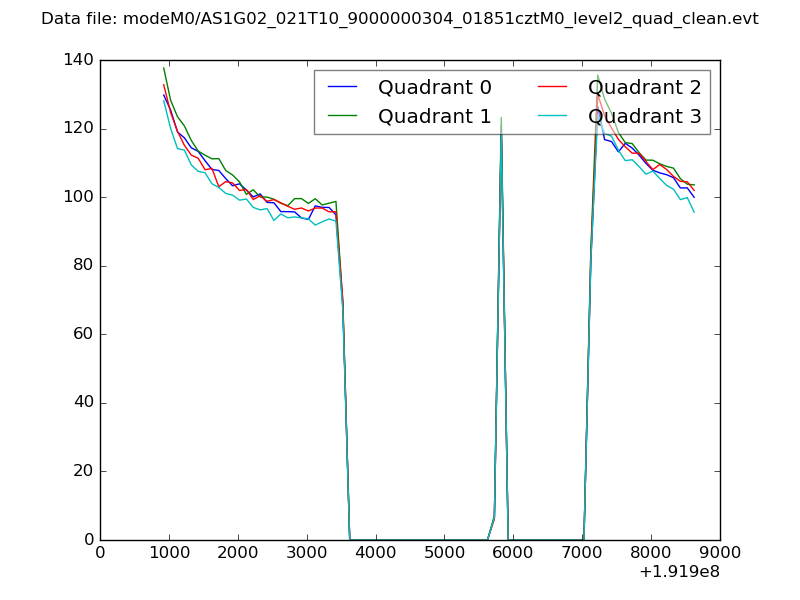 |
|
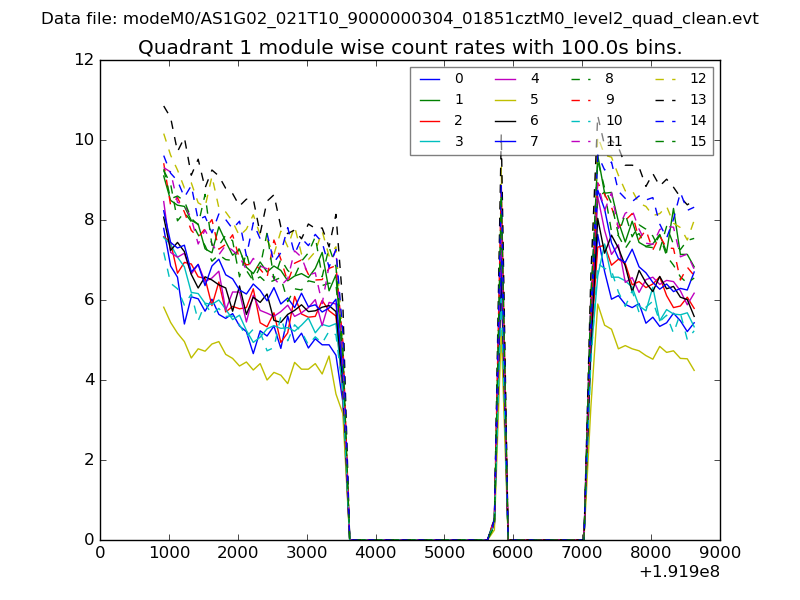
| Module-wise count rates for Quadrant A Data is divided into 100 sec bins |
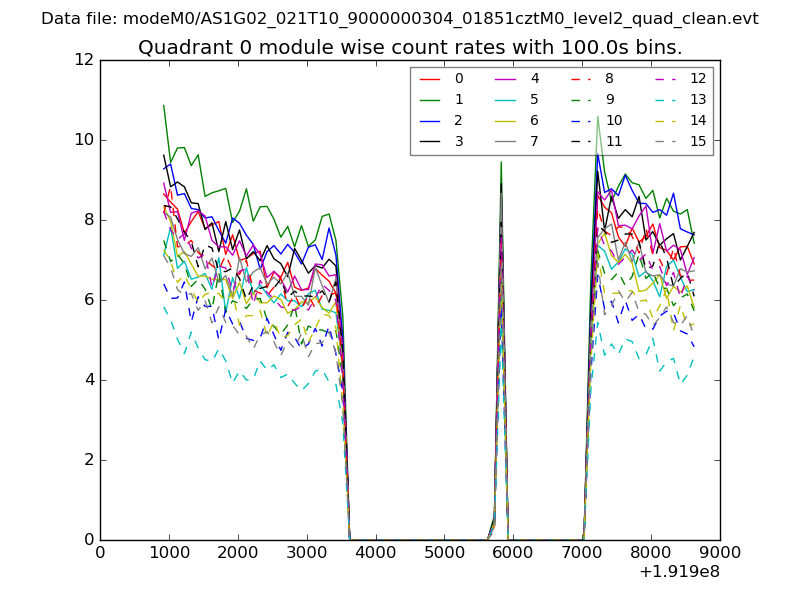 |
 |
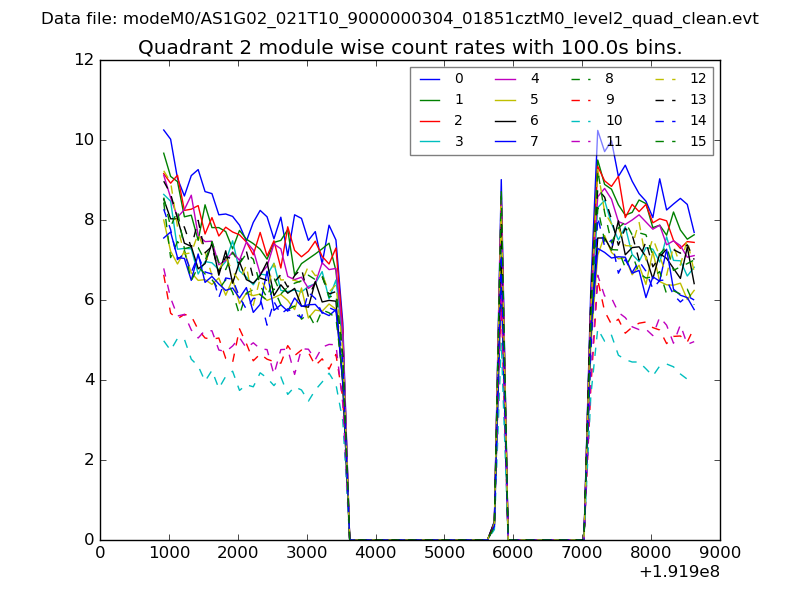
| Module-wise count rates for Quadrant B Data is divided into 100 sec bins |
 |
 |
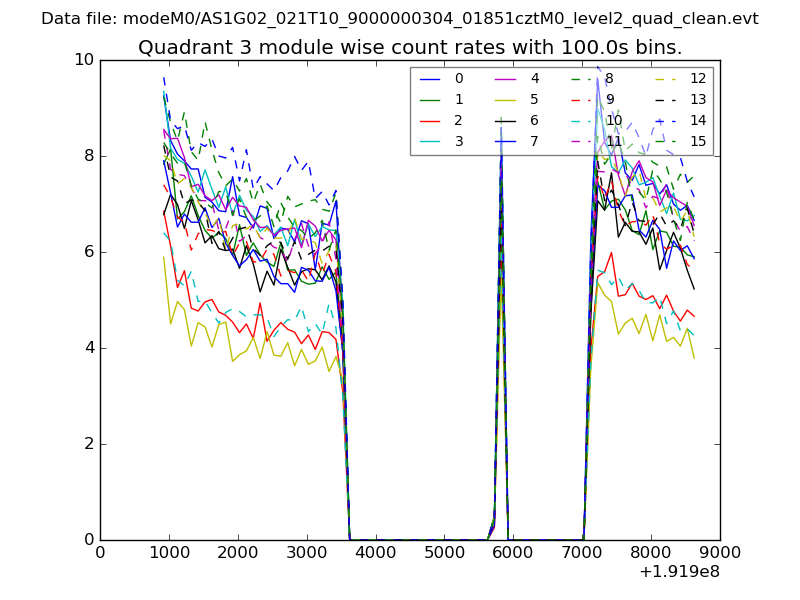
| Module-wise count rates for Quadrant C Data is divided into 100 sec bins |
 |
 |
| Module-wise count rates for Quadrant D Data is divided into 100 sec bins |
 |
 |
| Parameter | Plot |
|---|---|
| CZT HV Monitor | 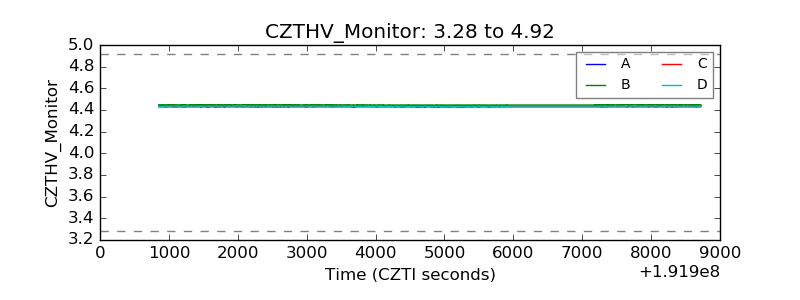 |
| D_VDD | 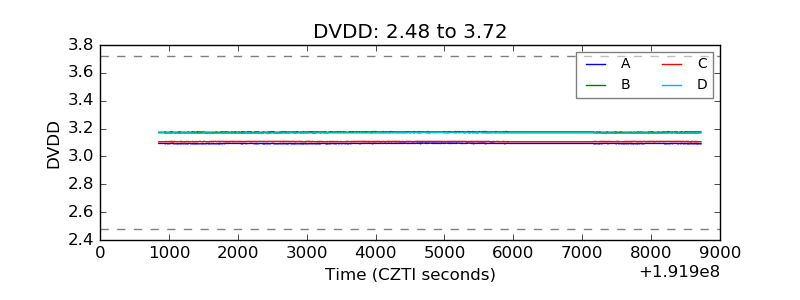 |
| Temperature 1 | 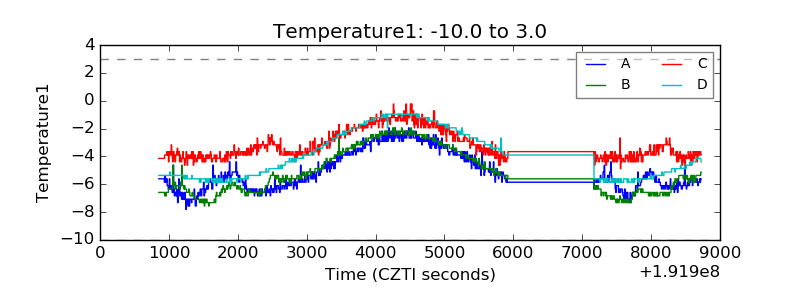 |
| Veto HV Monitor | 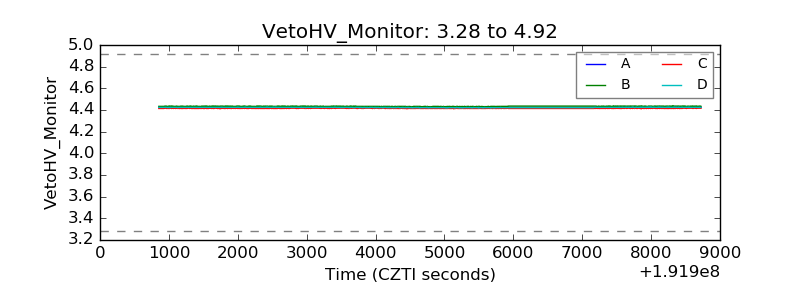 |
| Veto LLD | 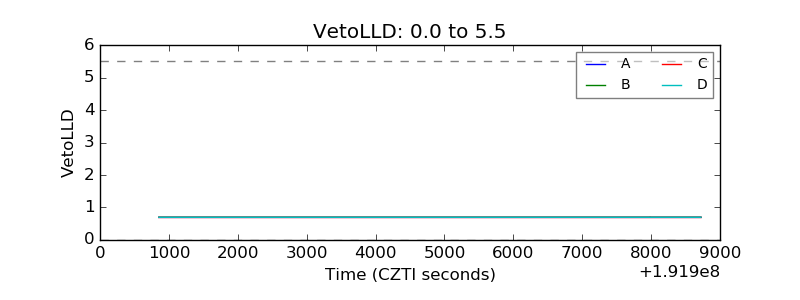 |
| Alpha Counter | 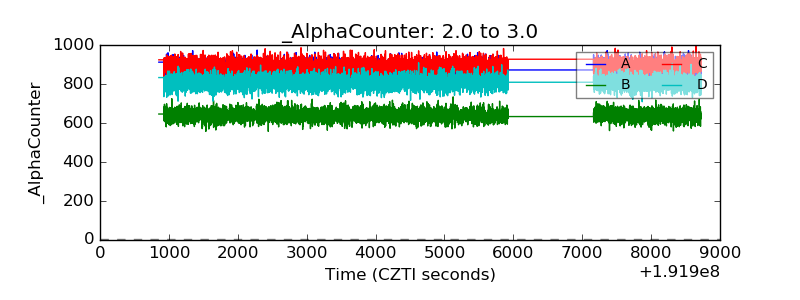 |
| _CPM_Rate | 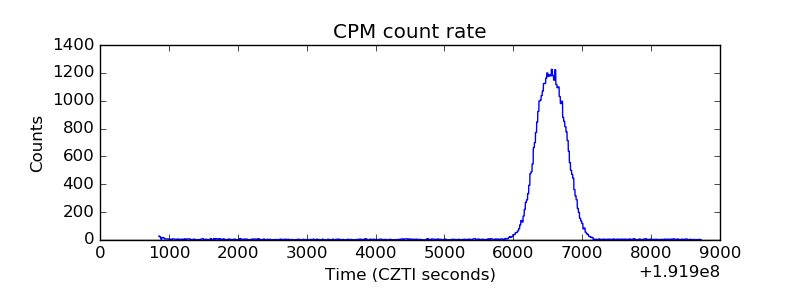 |
| CZT Counter | 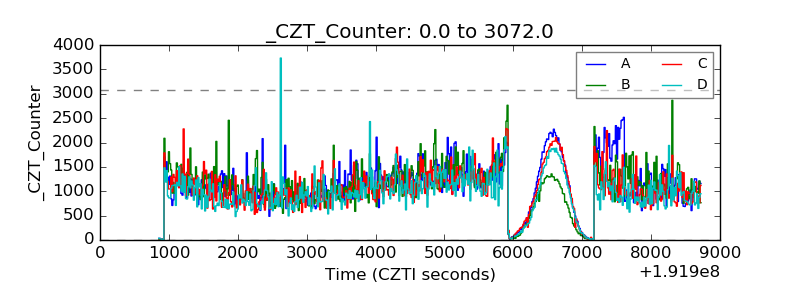 |
| +2.5 Volts monitor |  |
| +5 Volts monitor |  |
| _ROLL_ROT | 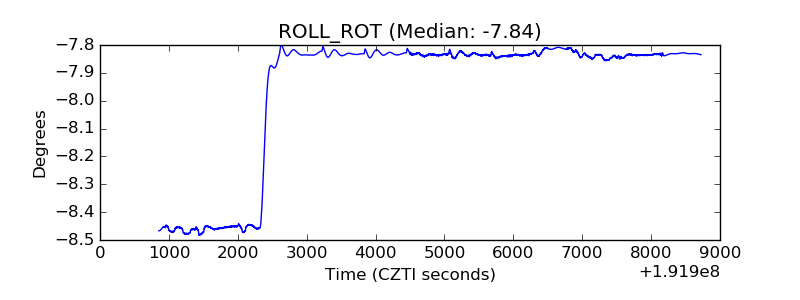 |
| _Roll_DEC | 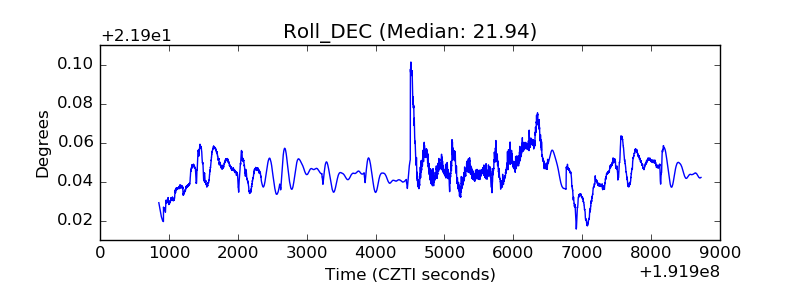 |
| _Roll_RA | 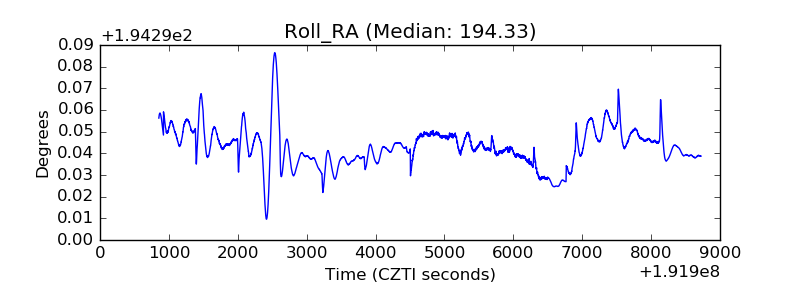 |
| Veto Counter | 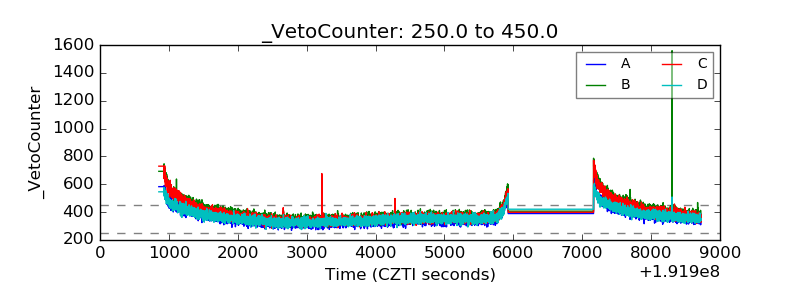 |