| Param | Original file | Final file |
|---|---|---|
| Filename | modeM0/AS1G02_021T10_9000000304_01854cztM0_level2.evt | modeM0/AS1G02_021T10_9000000304_01854cztM0_level2_quad_clean.evt |
| Size (bytes) | 1,028,666,880 | 71,645,760 |
| Size | 981.0 MB | 68.3 MB |
| Events in quadrant A | 7,951,298 | 432,223 |
| Events in quadrant B | 8,017,299 | 437,429 |
| Events in quadrant C | 7,474,806 | 430,360 |
| Events in quadrant D | 7,281,492 | 418,651 |
| Mode SS | |||
|---|---|---|---|
| Quadrant | BADHDUFLAG | Total packets | Discarded packets |
| A | 0 | 128 | 0 |
| B | 0 | 128 | 0 |
| C | 0 | 128 | 0 |
| D | 0 | 128 | 0 |
| Mode M0 | |||
|---|---|---|---|
| Quadrant | BADHDUFLAG | Total packets | Discarded packets |
| A | 0 | 28221 | 12 |
| B | 0 | 28393 | 2 |
| C | 0 | 26802 | 2 |
| D | 0 | 26223 | 2 |
| Mode M9 | |||
|---|---|---|---|
| Quadrant | BADHDUFLAG | Total packets | Discarded packets |
| A | 0 | 1 | 0 |
| B | 1 | 1 | 0 |
| C | 1 | -1 | -1 |
| D | 1 | -1 | -1 |
| Quadrant | Total seconds | Saturated seconds | Saturation percentage |
|---|---|---|---|
| A | 6461 | 46 | 0.711964% |
| B | 6463 | 32 | 0.495126% |
| C | 6463 | 23 | 0.355872% |
| D | 6463 | 73 | 1.129506% |
Noise dominated data is calculated using 1-second bins in cleaned event files. If a bin has >2000 counts, and if more than 50% of those come from <1% of pixels, then it is considered to be noise-dominated and hence unusable.
| Quadrant | # 1 sec bins | Bins with >0 counts | Bins with >2000 counts | High rate bins dominated by noise | Noise dominated (total time) | Noise dominated (detector-on time) | Marked lightcurve |
|---|---|---|---|---|---|---|---|
| A | 7503 | 6464 | 242 | 242 | 3.23% | 3.74% |  |
| B | 7503 | 6465 | 232 | 232 | 3.09% | 3.59% | 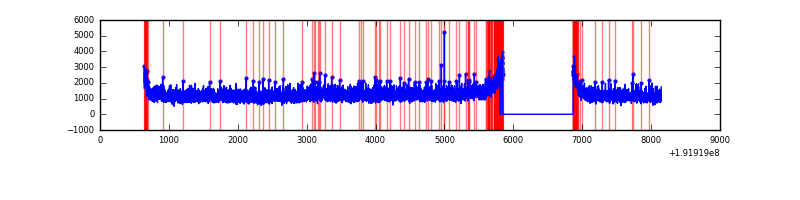 |
| C | 7503 | 6465 | 176 | 176 | 2.35% | 2.72% | 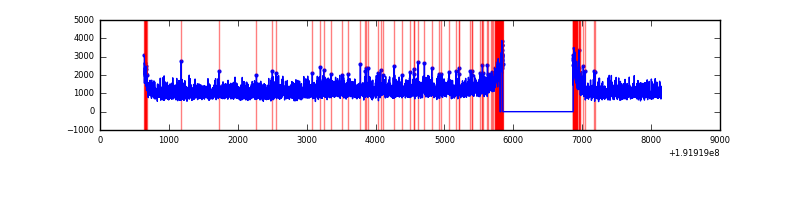 |
| D | 7503 | 6465 | 196 | 196 | 2.61% | 3.03% | 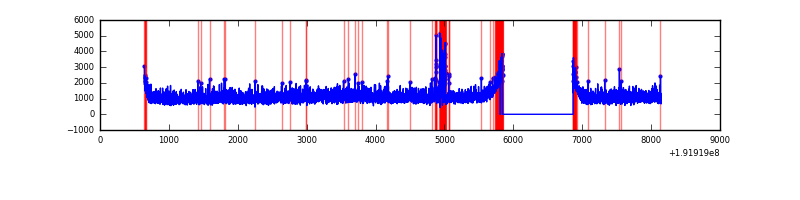 |
Top three noisy pixels from each quadrant. If the there are fewer than three noisy pixels in the level2.evt file, extra rows are filled as -1
| Pixel properties | Quadrant properties | ||||||
|---|---|---|---|---|---|---|---|
| Quadrant | DetID | PixID | Counts | Sigma | Mean | Median | Sigma |
| A | 0 | 231 | 96284 | 189.15 | 2055 | 2069 | 498.1 |
| A | -1 | -1 | -1 | -1.0 | 2055 | 2069 | 498.1 |
| A | -1 | -1 | -1 | -1.0 | 2055 | 2069 | 498.1 |
| B | 8 | 3 | 14393 | 24.85 | 2102 | 2116 | 494.1 |
| B | 5 | 6 | 13629 | 23.3 | 2102 | 2116 | 494.1 |
| B | 5 | 189 | 12812 | 21.65 | 2102 | 2116 | 494.1 |
| C | 9 | 236 | 33927 | 60.47 | 1899 | 1966 | 528.6 |
| C | 9 | 54 | 13836 | 22.46 | 1899 | 1966 | 528.6 |
| C | 14 | 48 | 11607 | 18.24 | 1899 | 1966 | 528.6 |
| D | 10 | 102 | 202766 | 343.97 | 1882 | 1952 | 583.8 |
| D | 10 | 215 | 17985 | 27.46 | 1882 | 1952 | 583.8 |
| D | 10 | 172 | 17630 | 26.85 | 1882 | 1952 | 583.8 |
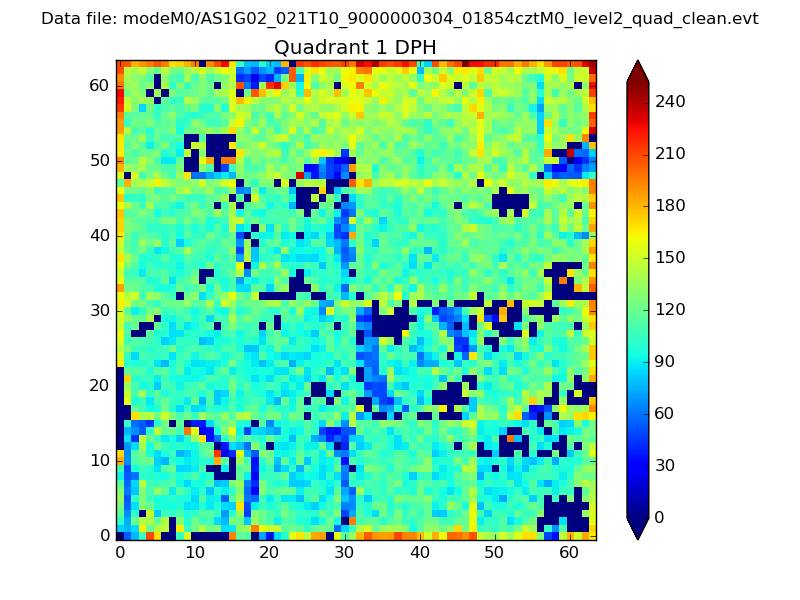
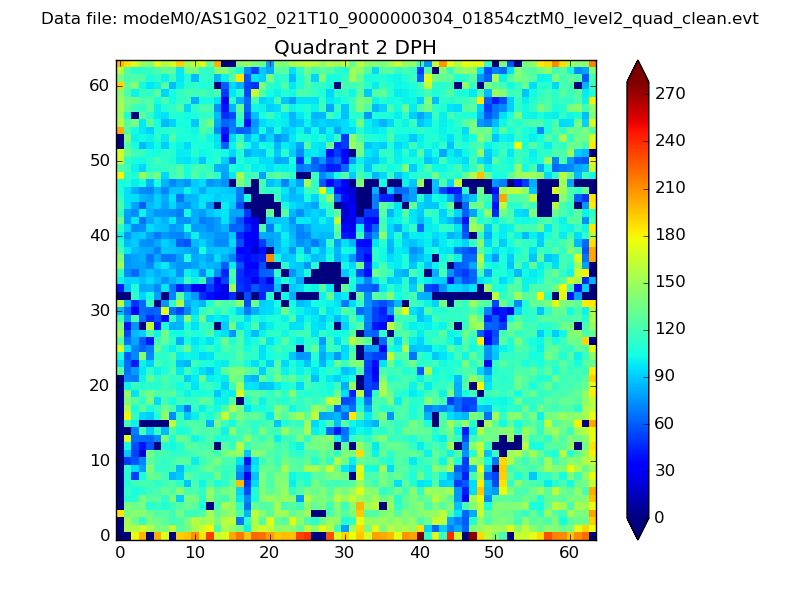
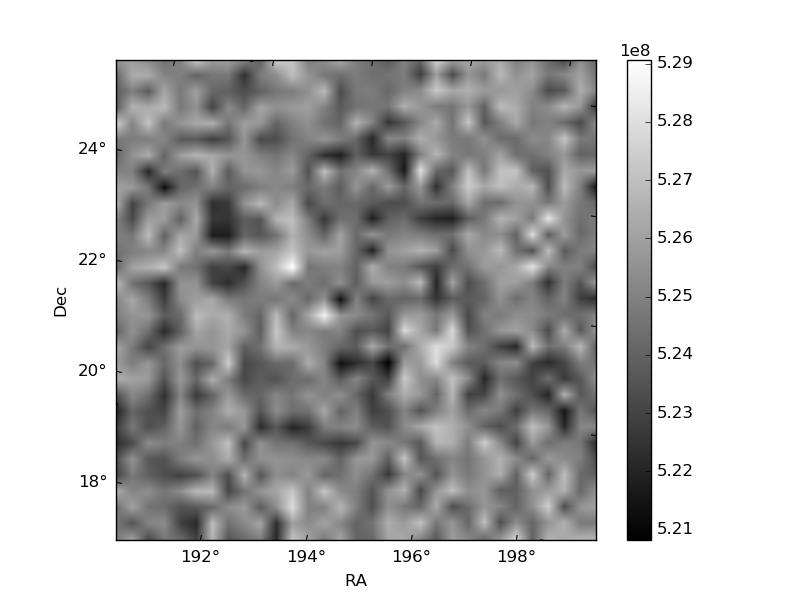
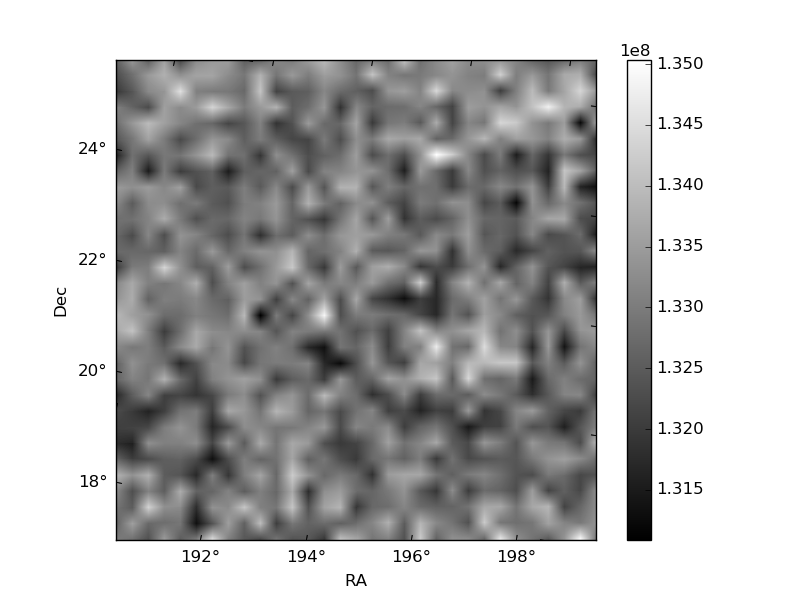
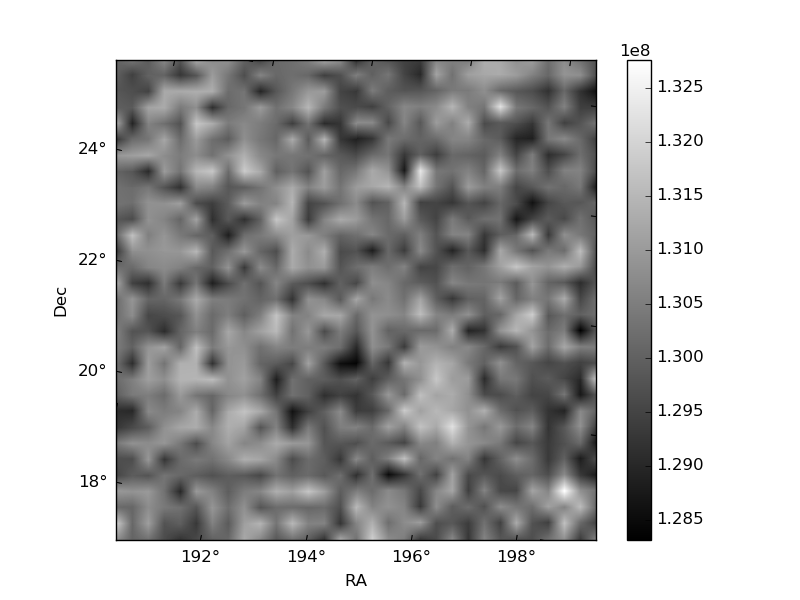
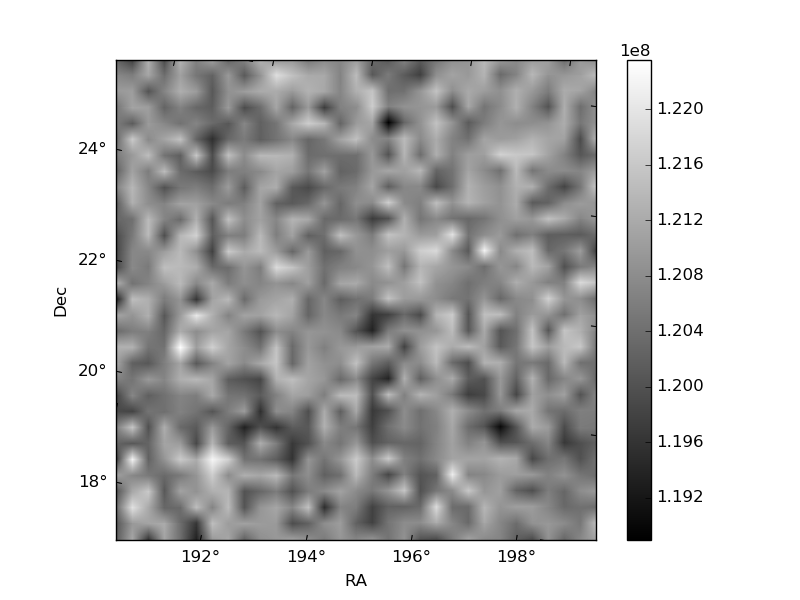
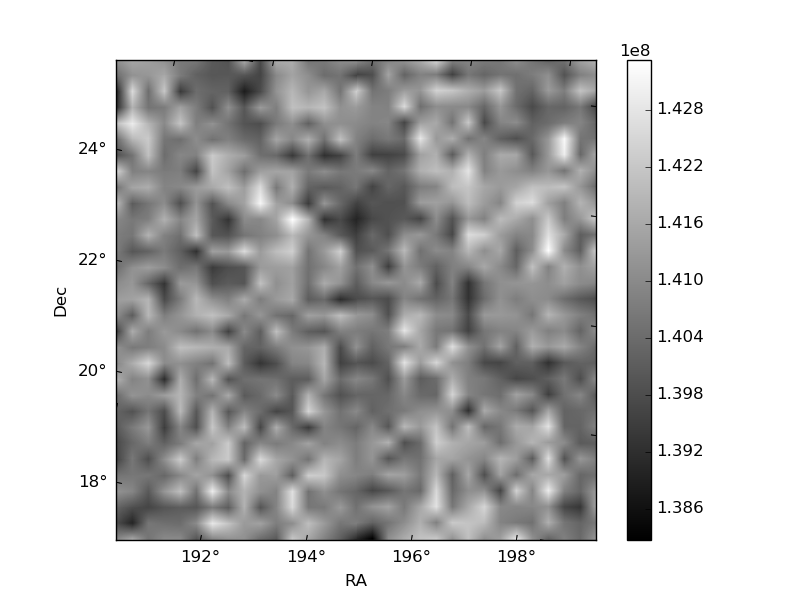
Histogram calculated using DETX and DETY for each event in the final _common_clean file
| Quadrant A | 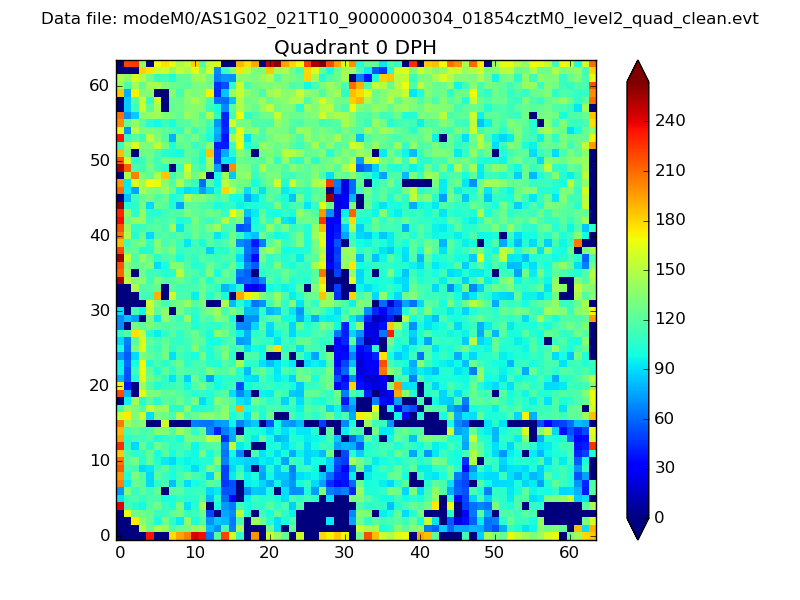 |
 |
Quadrant B |
|---|---|---|---|
| Quadrant D | 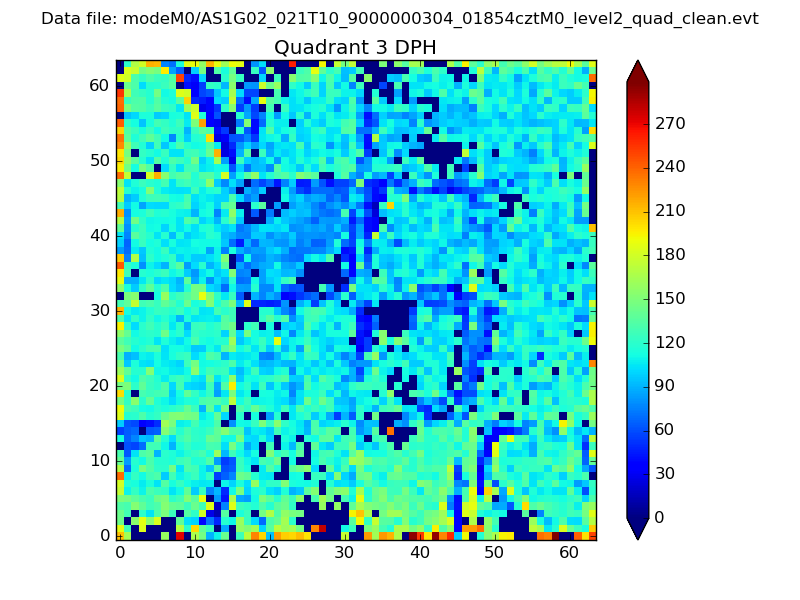 |
 |
Quadrant C |
| Plot type | Count rate plots | Images |
|---|---|---|
| Comparison with Poisson distribution Blue bars denote a histogram of data divided into 1 sec bins. Red curve is a Poisson curve with rate = median count rate of data. |
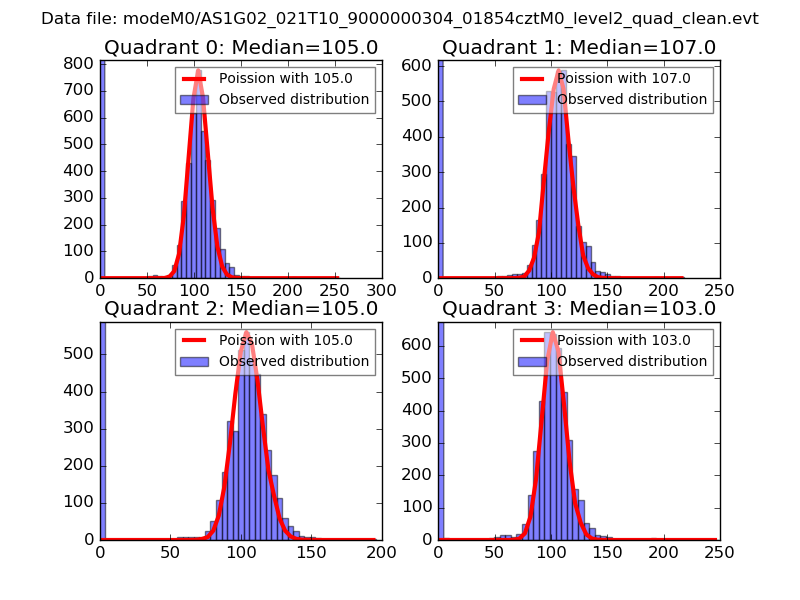 |
 |
| Quadrant-wise count rates Data is divided into 100 sec bins |
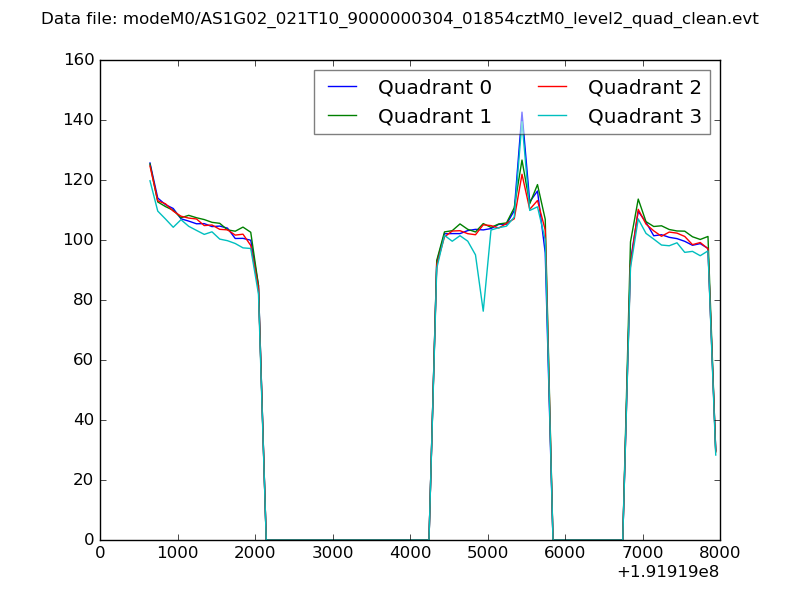 |
|
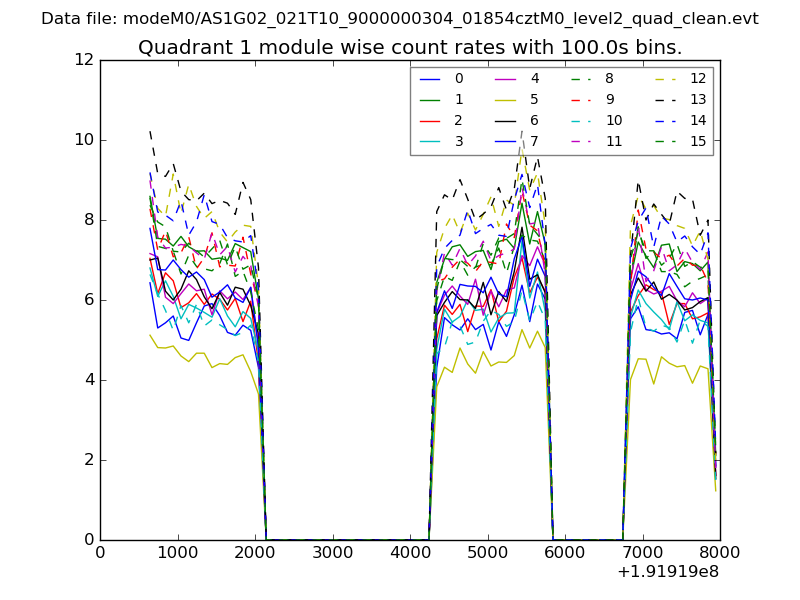
| Module-wise count rates for Quadrant A Data is divided into 100 sec bins |
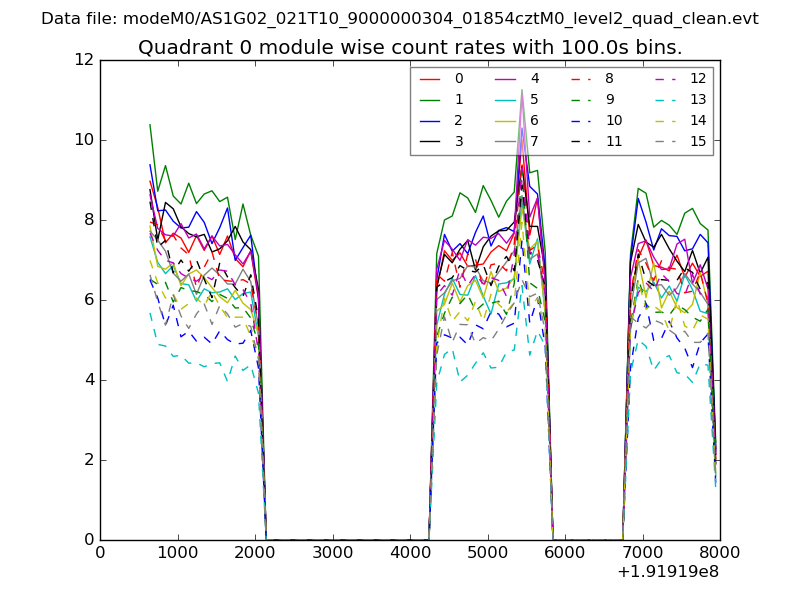 |
 |
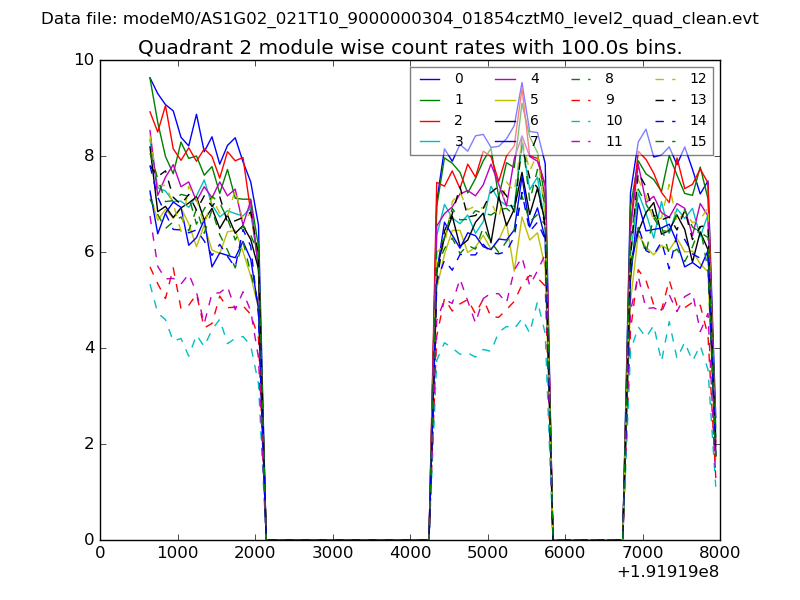
| Module-wise count rates for Quadrant B Data is divided into 100 sec bins |
 |
 |
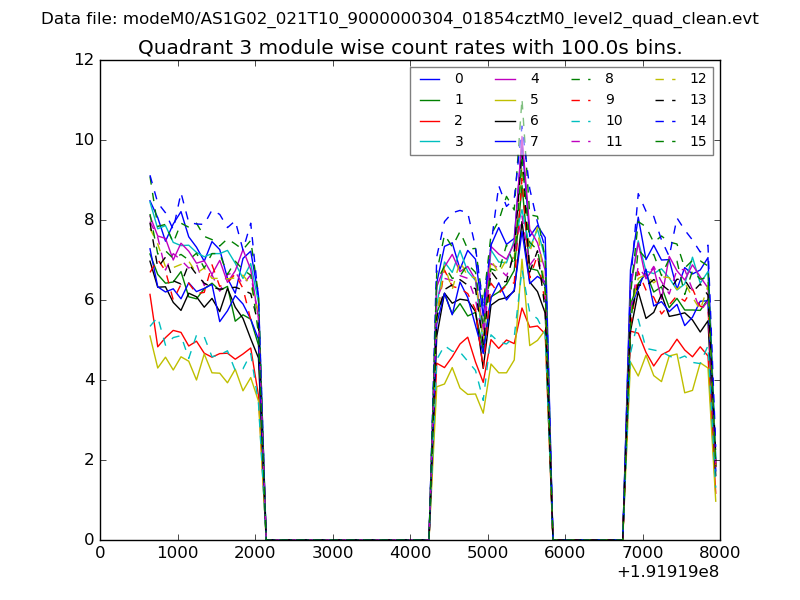
| Module-wise count rates for Quadrant C Data is divided into 100 sec bins |
 |
 |
| Module-wise count rates for Quadrant D Data is divided into 100 sec bins |
 |
 |
| Parameter | Plot |
|---|---|
| CZT HV Monitor | 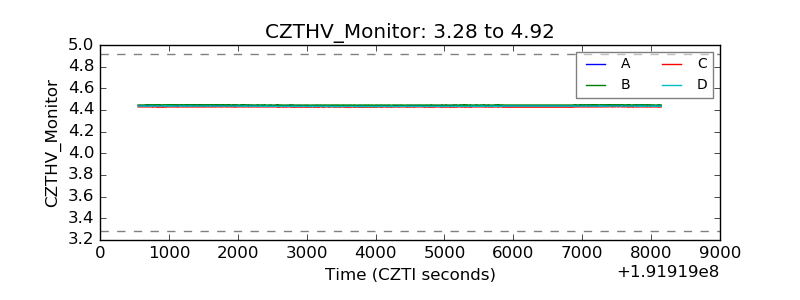 |
| D_VDD | 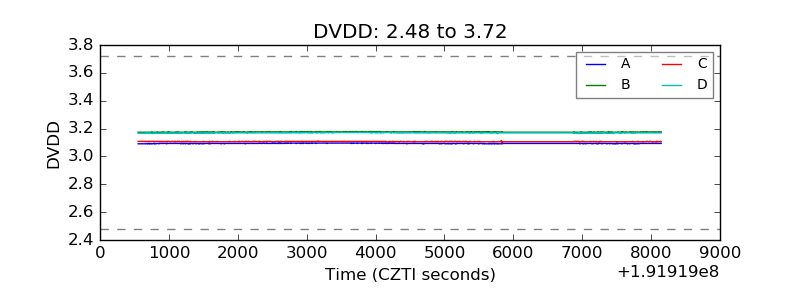 |
| Temperature 1 | 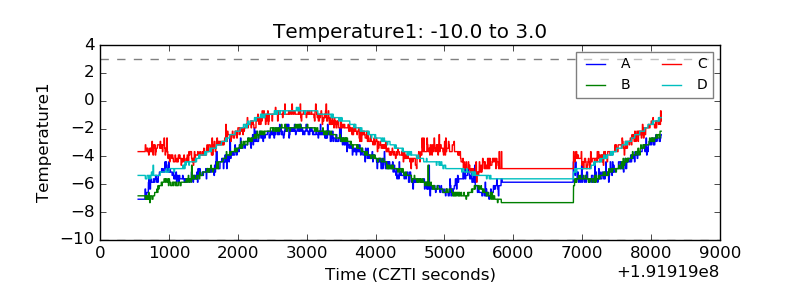 |
| Veto HV Monitor | 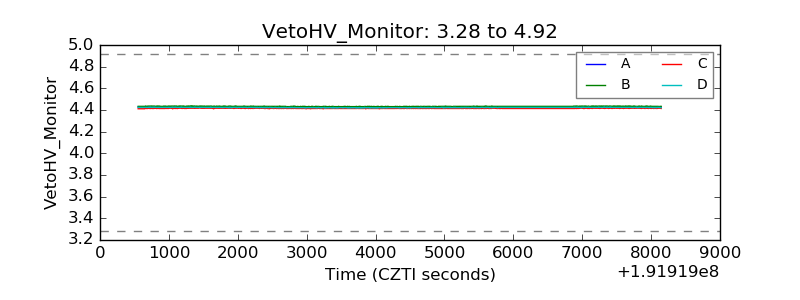 |
| Veto LLD | 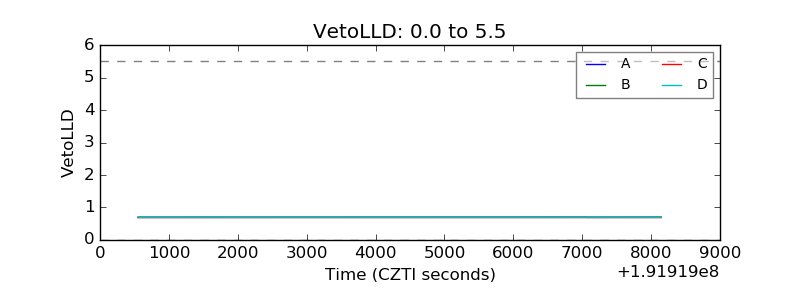 |
| Alpha Counter | 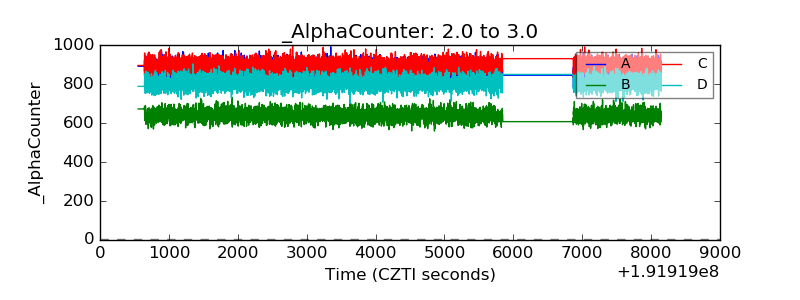 |
| _CPM_Rate | 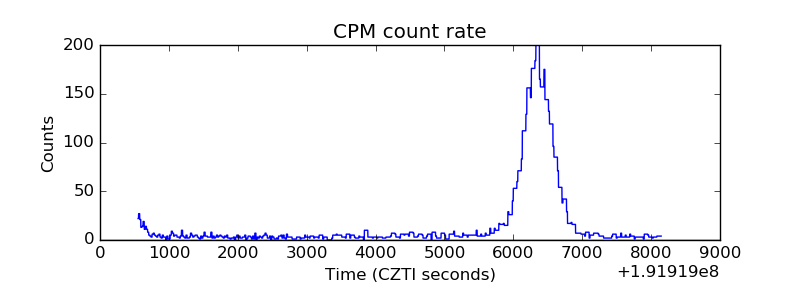 |
| CZT Counter | 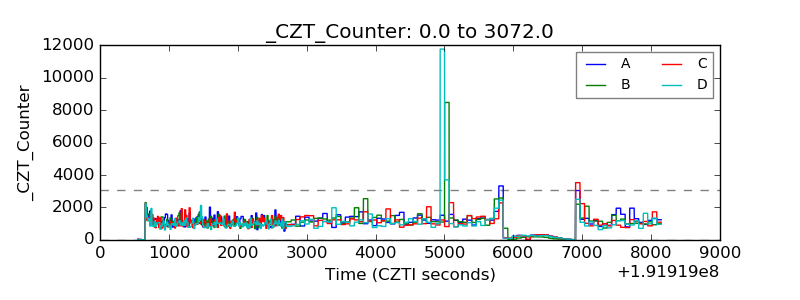 |
| +2.5 Volts monitor |  |
| +5 Volts monitor |  |
| _ROLL_ROT | 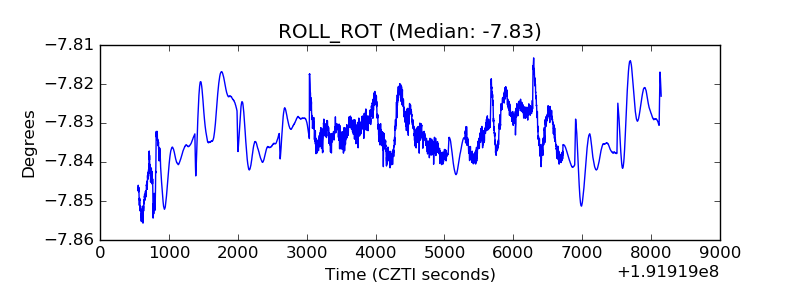 |
| _Roll_DEC | 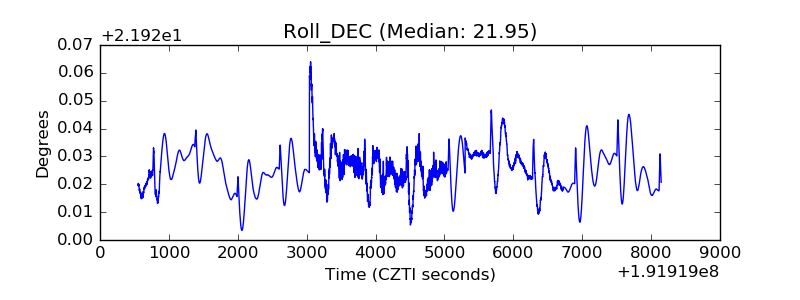 |
| _Roll_RA | 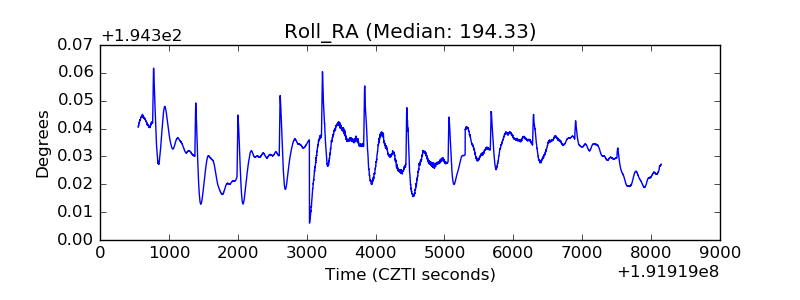 |
| Veto Counter | 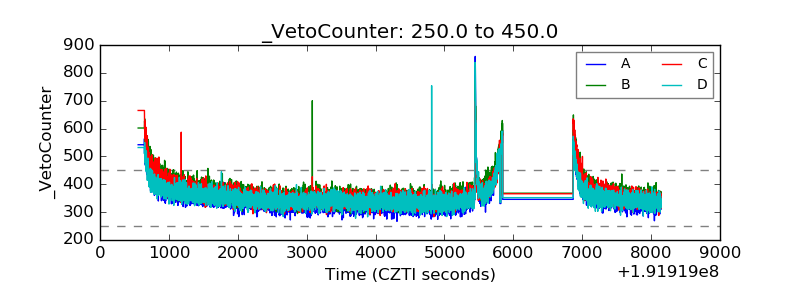 |