| Param | Original file | Final file |
|---|---|---|
| Filename | modeM0/AS1G02_021T07_9000000306cztM0_level2.fits | modeM0/AS1G02_021T07_9000000306cztM0_level2_quad_clean.evt |
| Size (bytes) | 192,047,040 | 208,969,920 |
| Size | 183.2 MB | 199.3 MB |
| Events in quadrant A | 1,102,794 | 1,236,041 |
| Events in quadrant B | 1,096,644 | 1,244,197 |
| Events in quadrant C | 1,092,002 | 1,183,231 |
| Events in quadrant D | 944,600 | 1,085,108 |
| Mode M9 | |||
|---|---|---|---|
| Quadrant | BADHDUFLAG | Total packets | Discarded packets |
| A | 1 | 139865888335912 | 139865609994286 |
| B | 1 | 139865888335912 | 139865609994286 |
| C | 1 | 139865888335912 | 139865609994286 |
| D | 1 | 139865888335912 | 139865609994286 |
| Mode SS | |||
|---|---|---|---|
| Quadrant | BADHDUFLAG | Total packets | Discarded packets |
| A | 0 | 514 | 0 |
| B | 0 | 497 | 0 |
| C | 0 | 556 | 0 |
| D | 0 | 502 | 0 |
| Mode M0 | |||
|---|---|---|---|
| Quadrant | BADHDUFLAG | Total packets | Discarded packets |
| A | 0 | 104865 | 0 |
| B | 0 | 105375 | 0 |
| C | 0 | 100949 | 0 |
| D | 0 | 96959 | 0 |
| Quadrant | Total seconds | Saturated seconds | Saturation percentage |
|---|---|---|---|
| A | 22811 | 376 | 1.648328% |
| B | 22811 | 407 | 1.784227% |
| C | 22809 | 392 | 1.718620% |
| D | 22811 | 363 | 1.591338% |
Noise dominated data is calculated using 1-second bins in cleaned event files. If a bin has >2000 counts, and if more than 50% of those come from <1% of pixels, then it is considered to be noise-dominated and hence unusable.
| Quadrant | # 1 sec bins | Bins with >0 counts | Bins with >2000 counts | High rate bins dominated by noise | Noise dominated (total time) | Noise dominated (detector-on time) | Marked lightcurve |
|---|---|---|---|---|---|---|---|
| A | 72582 | 22811 | 0 | 0 | 0.00% | 0.00% | 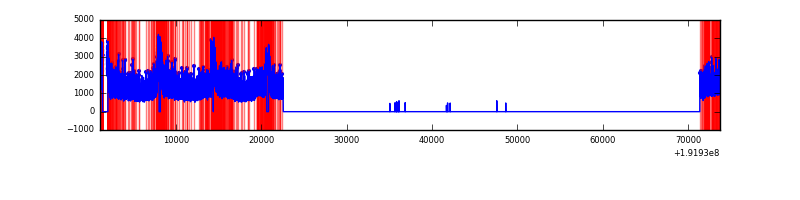 |
| B | 72582 | 22811 | 0 | 0 | 0.00% | 0.00% |  |
| C | 72582 | 22810 | 0 | 0 | 0.00% | 0.00% |  |
| D | 72582 | 22812 | 0 | 0 | 0.00% | 0.00% |  |
Top three noisy pixels from each quadrant. If the there are fewer than three noisy pixels in the level2.evt file, extra rows are filled as -1
| Pixel properties | Quadrant properties | ||||||
|---|---|---|---|---|---|---|---|
| Quadrant | DetID | PixID | Counts | Sigma | Mean | Median | Sigma |
| A | 0 | 29 | 1054 | 11.3 | 285 | 267 | 69.6 |
| A | 7 | 110 | 894 | 9.0 | 285 | 267 | 69.6 |
| A | 0 | 30 | 828 | 8.06 | 285 | 267 | 69.6 |
| B | 2 | 9 | 874 | 10.99 | 290 | 276 | 54.4 |
| B | 5 | 128 | 714 | 8.05 | 290 | 276 | 54.4 |
| B | 2 | 8 | 709 | 7.95 | 290 | 276 | 54.4 |
| C | 12 | 241 | 756 | 6.82 | 288 | 267 | 71.7 |
| C | 9 | 242 | 737 | 6.56 | 288 | 267 | 71.7 |
| C | 3 | 126 | 722 | 6.35 | 288 | 267 | 71.7 |
| D | 3 | 30 | 701 | 7.09 | 269 | 246 | 64.1 |
| D | 6 | 44 | 698 | 7.05 | 269 | 246 | 64.1 |
| D | 3 | 14 | 690 | 6.92 | 269 | 246 | 64.1 |
Histogram calculated using DETX and DETY for each event in the final _common_clean file
| Quadrant A | 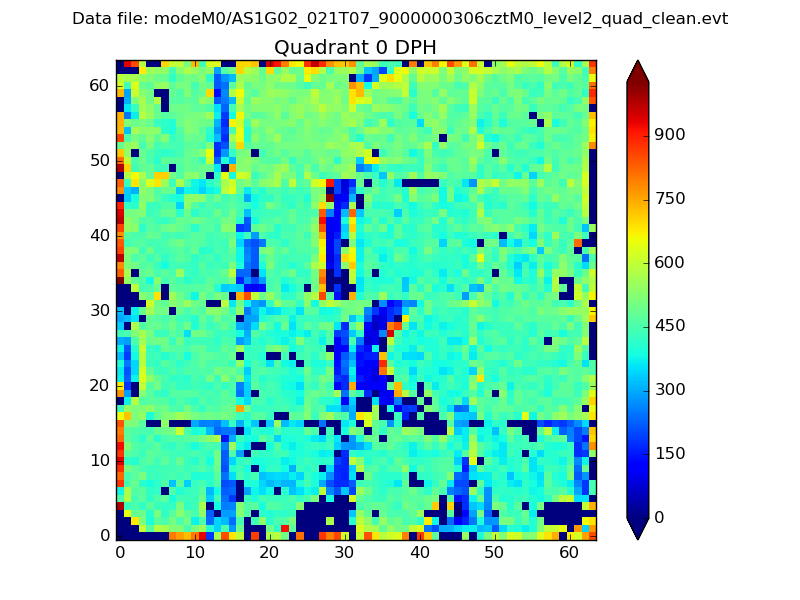 |
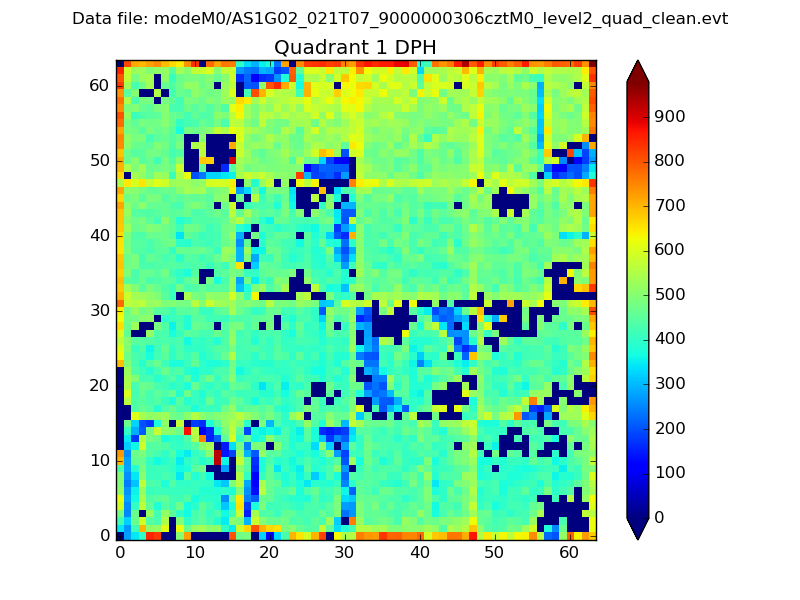 |
Quadrant B |
|---|---|---|---|
| Quadrant D |  |
 |
Quadrant C |
| Plot type | Count rate plots | Images |
|---|---|---|
| Comparison with Poisson distribution Blue bars denote a histogram of data divided into 1 sec bins. Red curve is a Poisson curve with rate = median count rate of data. |
 |
 |
| Quadrant-wise count rates Data is divided into 100 sec bins |
 |
|
| Module-wise count rates for Quadrant A Data is divided into 100 sec bins |
 |
 |
| Module-wise count rates for Quadrant B Data is divided into 100 sec bins |
 |
 |
| Module-wise count rates for Quadrant C Data is divided into 100 sec bins |
 |
 |
| Module-wise count rates for Quadrant D Data is divided into 100 sec bins |
 |
 |
| Parameter | Plot |
|---|---|
| CZT HV Monitor |  |
| D_VDD |  |
| Temperature 1 | 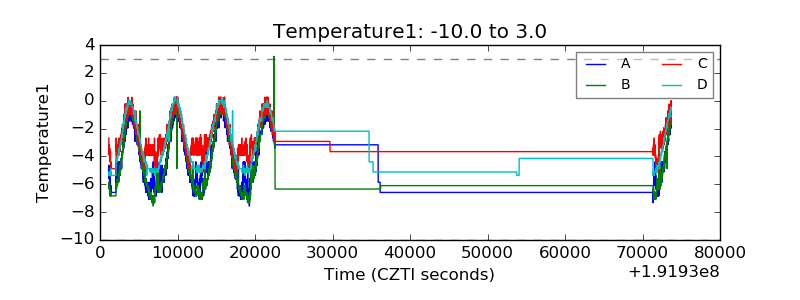 |
| Veto HV Monitor |  |
| Veto LLD |  |
| Alpha Counter |  |
| _CPM_Rate |  |
| CZT Counter |  |
| +2.5 Volts monitor |  |
| +5 Volts monitor |  |
| _ROLL_ROT | 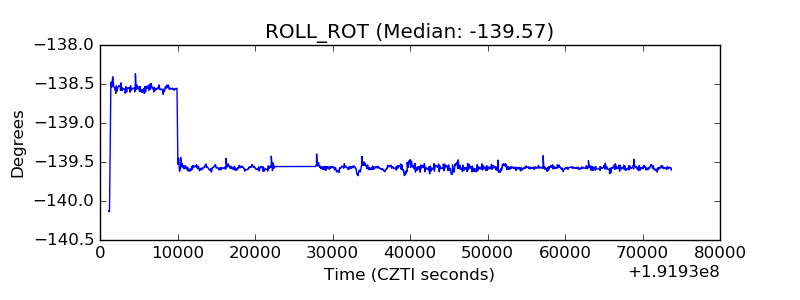 |
| _Roll_DEC |  |
| _Roll_RA |  |
| Veto Counter |  |