| Param | Original file | Final file |
|---|---|---|
| Filename | modeM0/AS1T01_052T01_9000000308cztM0_level2.fits | modeM0/AS1T01_052T01_9000000308cztM0_level2_quad_clean.evt |
| Size (bytes) | 710,657,280 | 760,587,840 |
| Size | 677.7 MB | 725.4 MB |
| Events in quadrant A | 4,100,290 | 4,479,410 |
| Events in quadrant B | 4,152,280 | 4,585,519 |
| Events in quadrant C | 4,097,978 | 4,364,265 |
| Events in quadrant D | 3,533,900 | 3,969,592 |
| Mode M0 | |||
|---|---|---|---|
| Quadrant | BADHDUFLAG | Total packets | Discarded packets |
| A | 0 | 410910 | 0 |
| B | 0 | 369093 | 0 |
| C | 0 | 348827 | 0 |
| D | 0 | 340312 | 0 |
| Mode SS | |||
|---|---|---|---|
| Quadrant | BADHDUFLAG | Total packets | Discarded packets |
| A | 0 | 1647 | 0 |
| B | 0 | 1646 | 0 |
| C | 0 | 1648 | 0 |
| D | 0 | 1640 | 0 |
| Mode M9 | |||
|---|---|---|---|
| Quadrant | BADHDUFLAG | Total packets | Discarded packets |
| A | 1 | 140072051415080 | 140071768424494 |
| B | 1 | 140072051415080 | 140071768424494 |
| C | 1 | 140072051415080 | 140071768424494 |
| D | 1 | 140072051415080 | 140071768424494 |
| Quadrant | Total seconds | Saturated seconds | Saturation percentage |
|---|---|---|---|
| A | 82193 | 1437 | 1.748324% |
| B | 82236 | 786 | 0.955786% |
| C | 82231 | 737 | 0.896256% |
| D | 82253 | 927 | 1.127011% |
Noise dominated data is calculated using 1-second bins in cleaned event files. If a bin has >2000 counts, and if more than 50% of those come from <1% of pixels, then it is considered to be noise-dominated and hence unusable.
| Quadrant | # 1 sec bins | Bins with >0 counts | Bins with >2000 counts | High rate bins dominated by noise | Noise dominated (total time) | Noise dominated (detector-on time) | Marked lightcurve |
|---|---|---|---|---|---|---|---|
| A | 112510 | 82334 | 0 | 0 | 0.00% | 0.00% |  |
| B | 112510 | 82367 | 0 | 0 | 0.00% | 0.00% |  |
| C | 112510 | 82330 | 0 | 0 | 0.00% | 0.00% |  |
| D | 112510 | 82366 | 0 | 0 | 0.00% | 0.00% | 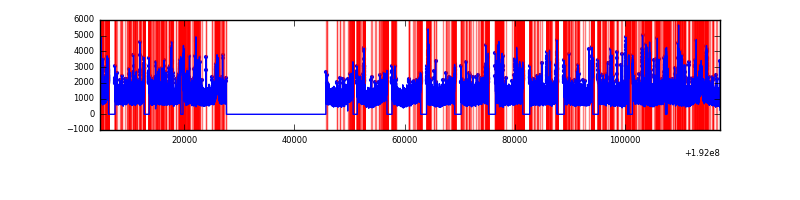 |
Top three noisy pixels from each quadrant. If the there are fewer than three noisy pixels in the level2.evt file, extra rows are filled as -1
| Pixel properties | Quadrant properties | ||||||
|---|---|---|---|---|---|---|---|
| Quadrant | DetID | PixID | Counts | Sigma | Mean | Median | Sigma |
| A | 0 | 29 | 3871 | 11.46 | 1063 | 988 | 251.6 |
| A | 7 | 110 | 3637 | 10.53 | 1063 | 988 | 251.6 |
| A | 14 | 79 | 3000 | 8.0 | 1063 | 988 | 251.6 |
| B | 2 | 9 | 3271 | 11.15 | 1095 | 1039 | 200.2 |
| B | 5 | 128 | 2794 | 8.76 | 1095 | 1039 | 200.2 |
| B | 14 | 254 | 2628 | 7.94 | 1095 | 1039 | 200.2 |
| C | 12 | 241 | 2771 | 6.78 | 1080 | 998 | 261.4 |
| C | 9 | 242 | 2767 | 6.77 | 1080 | 998 | 261.4 |
| C | 1 | 81 | 2644 | 6.3 | 1080 | 998 | 261.4 |
| D | 1 | 19 | 2599 | 7.12 | 1009 | 924 | 235.3 |
| D | 6 | 44 | 2544 | 6.89 | 1009 | 924 | 235.3 |
| D | 3 | 30 | 2530 | 6.83 | 1009 | 924 | 235.3 |
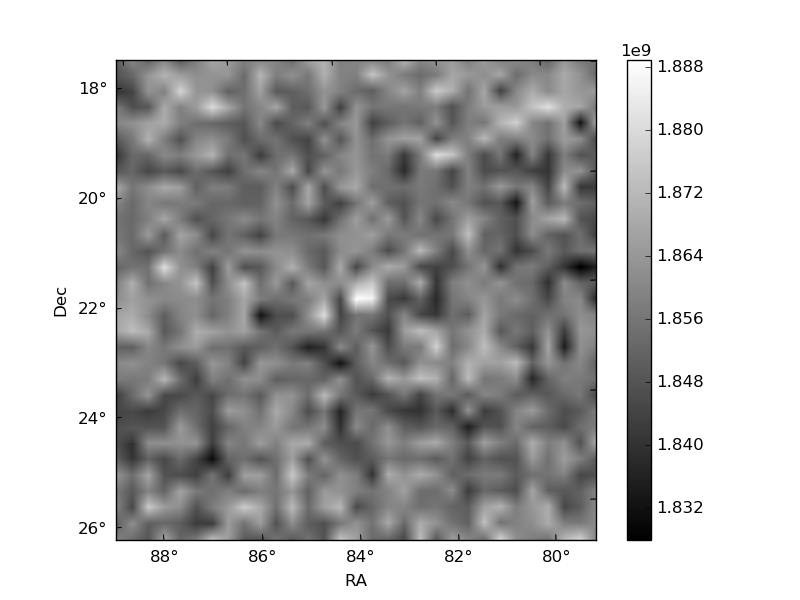
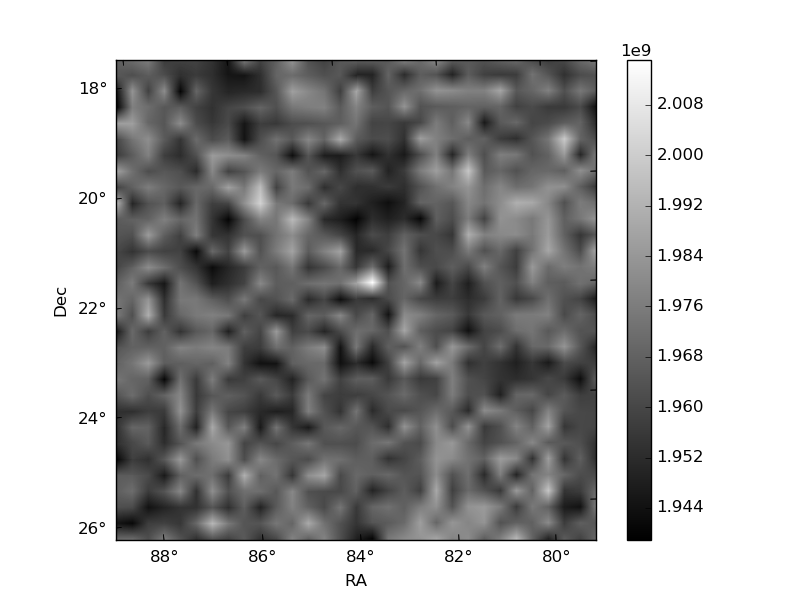
Histogram calculated using DETX and DETY for each event in the final _common_clean file
| Quadrant A |  |
 |
Quadrant B |
|---|---|---|---|
| Quadrant D |  |
 |
Quadrant C |
| Plot type | Count rate plots | Images |
|---|---|---|
| Comparison with Poisson distribution Blue bars denote a histogram of data divided into 1 sec bins. Red curve is a Poisson curve with rate = median count rate of data. |
 |
 |
| Quadrant-wise count rates Data is divided into 100 sec bins |
 |
|
| Module-wise count rates for Quadrant A Data is divided into 100 sec bins |
 |
 |
| Module-wise count rates for Quadrant B Data is divided into 100 sec bins |
 |
 |
| Module-wise count rates for Quadrant C Data is divided into 100 sec bins |
 |
 |
| Module-wise count rates for Quadrant D Data is divided into 100 sec bins |
 |
 |
| Parameter | Plot |
|---|---|
| CZT HV Monitor |  |
| D_VDD |  |
| Temperature 1 |  |
| Veto HV Monitor |  |
| Veto LLD |  |
| Alpha Counter |  |
| _CPM_Rate |  |
| CZT Counter |  |
| +2.5 Volts monitor | 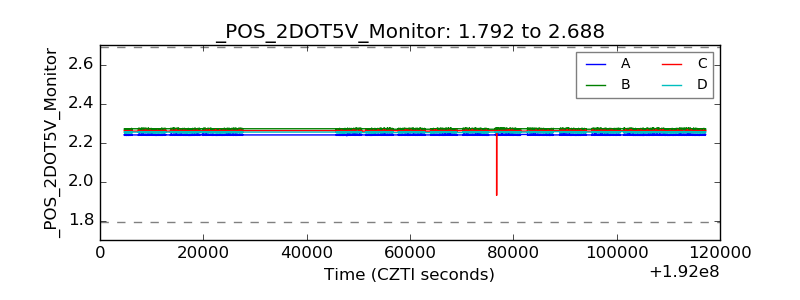 |
| +5 Volts monitor |  |
| _ROLL_ROT |  |
| _Roll_DEC |  |
| _Roll_RA |  |
| Veto Counter |  |