| Param | Original file | Final file |
|---|---|---|
| Filename | modeM0/AS1T01_052T01_9000000308_01876cztM0_level2.evt | modeM0/AS1T01_052T01_9000000308_01876cztM0_level2_quad_clean.evt |
| Size (bytes) | 1,046,952,000 | 78,704,640 |
| Size | 998.5 MB | 75.1 MB |
| Events in quadrant A | 8,922,341 | 482,980 |
| Events in quadrant B | 7,865,823 | 495,087 |
| Events in quadrant C | 7,386,930 | 485,847 |
| Events in quadrant D | 7,100,705 | 465,707 |
| Mode M0 | |||
|---|---|---|---|
| Quadrant | BADHDUFLAG | Total packets | Discarded packets |
| A | 0 | 31109 | 8 |
| B | 0 | 27962 | 1 |
| C | 0 | 26569 | 1 |
| D | 0 | 25737 | 1 |
| Mode SS | |||
|---|---|---|---|
| Quadrant | BADHDUFLAG | Total packets | Discarded packets |
| A | 0 | 132 | 0 |
| B | 0 | 132 | 0 |
| C | 0 | 132 | 0 |
| D | 0 | 132 | 0 |
| Mode M9 | |||
|---|---|---|---|
| Quadrant | BADHDUFLAG | Total packets | Discarded packets |
| A | 0 | 1 | 0 |
| B | 1 | 1 | 0 |
| C | 1 | -1 | -1 |
| D | 1 | -1 | -1 |
| Quadrant | Total seconds | Saturated seconds | Saturation percentage |
|---|---|---|---|
| A | 6496 | 10 | 0.153941% |
| B | 6498 | 15 | 0.230840% |
| C | 6498 | 5 | 0.076947% |
| D | 6498 | 30 | 0.461681% |
Noise dominated data is calculated using 1-second bins in cleaned event files. If a bin has >2000 counts, and if more than 50% of those come from <1% of pixels, then it is considered to be noise-dominated and hence unusable.
| Quadrant | # 1 sec bins | Bins with >0 counts | Bins with >2000 counts | High rate bins dominated by noise | Noise dominated (total time) | Noise dominated (detector-on time) | Marked lightcurve |
|---|---|---|---|---|---|---|---|
| A | 7433 | 6498 | 355 | 355 | 4.78% | 5.46% | 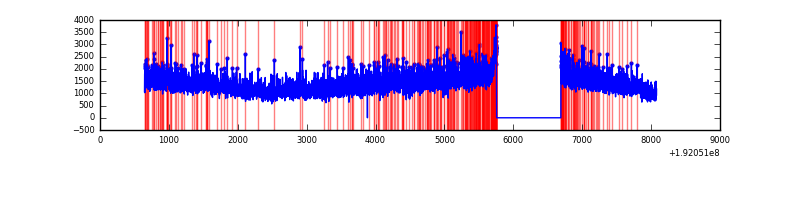 |
| B | 7433 | 6499 | 178 | 178 | 2.39% | 2.74% | 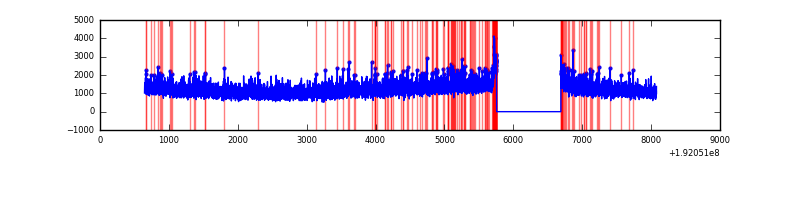 |
| C | 7433 | 6499 | 103 | 103 | 1.39% | 1.58% |  |
| D | 7433 | 6499 | 164 | 164 | 2.21% | 2.52% | 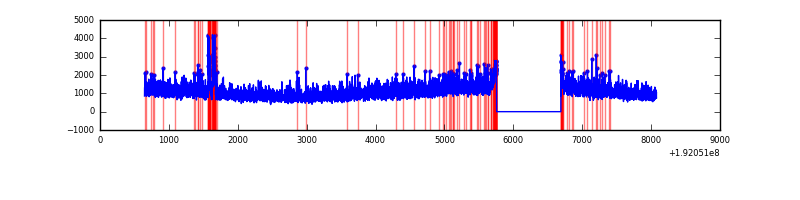 |
Top three noisy pixels from each quadrant. If the there are fewer than three noisy pixels in the level2.evt file, extra rows are filled as -1
| Pixel properties | Quadrant properties | ||||||
|---|---|---|---|---|---|---|---|
| Quadrant | DetID | PixID | Counts | Sigma | Mean | Median | Sigma |
| A | 0 | 231 | 1378955 | 2905.09 | 1967 | 1983 | 474.0 |
| A | 0 | 128 | 20111 | 38.25 | 1967 | 1983 | 474.0 |
| A | 8 | 255 | 8868 | 14.53 | 1967 | 1983 | 474.0 |
| B | 5 | 189 | 15860 | 28.63 | 2061 | 2071 | 481.6 |
| B | 0 | 220 | 15281 | 27.43 | 2061 | 2071 | 481.6 |
| B | 0 | 187 | 14603 | 26.02 | 2061 | 2071 | 481.6 |
| C | 14 | 223 | 12046 | 19.17 | 1885 | 1957 | 526.2 |
| C | 10 | 82 | 11808 | 18.72 | 1885 | 1957 | 526.2 |
| C | 10 | 34 | 10502 | 16.24 | 1885 | 1957 | 526.2 |
| D | 13 | 53 | 177256 | 312.42 | 1821 | 1891 | 561.3 |
| D | 1 | 83 | 44038 | 75.09 | 1821 | 1891 | 561.3 |
| D | 10 | 199 | 29100 | 48.47 | 1821 | 1891 | 561.3 |
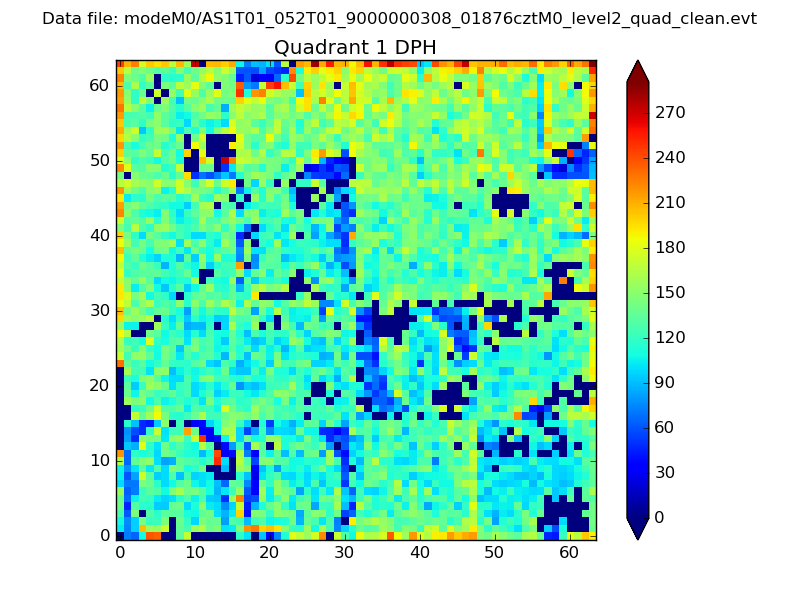
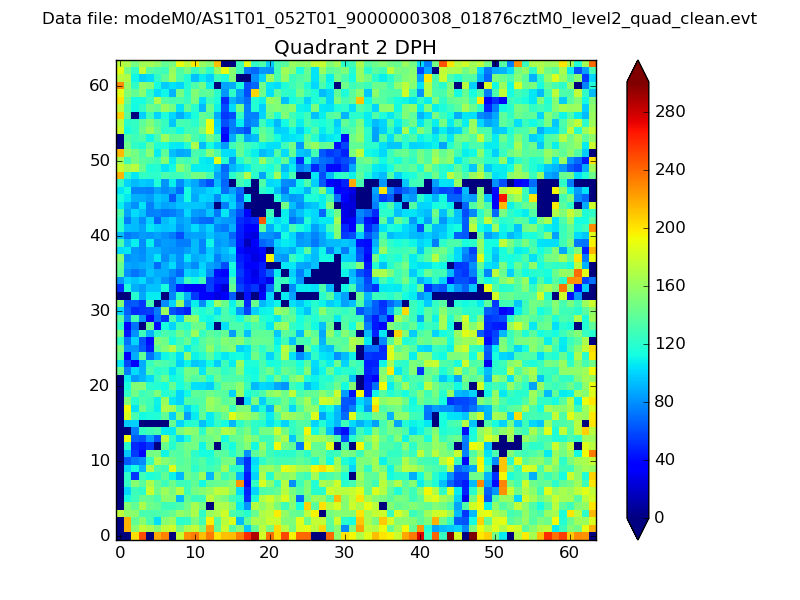
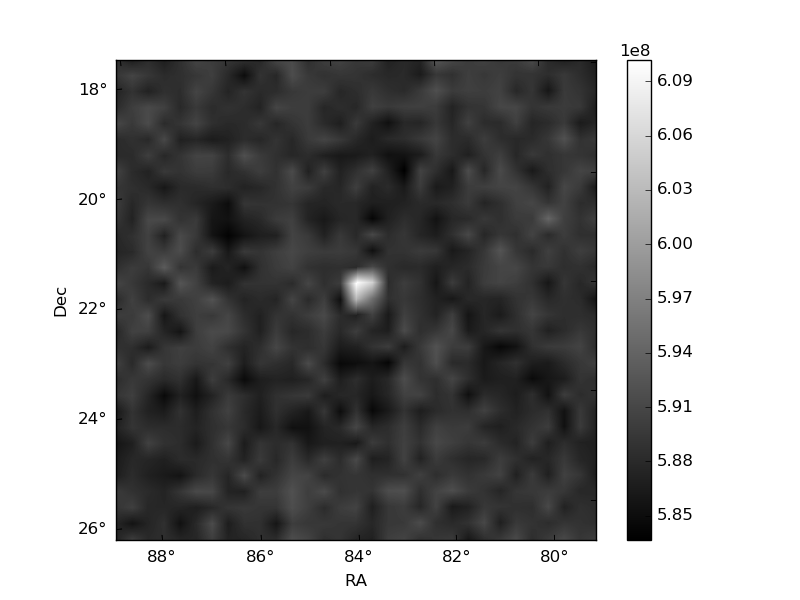
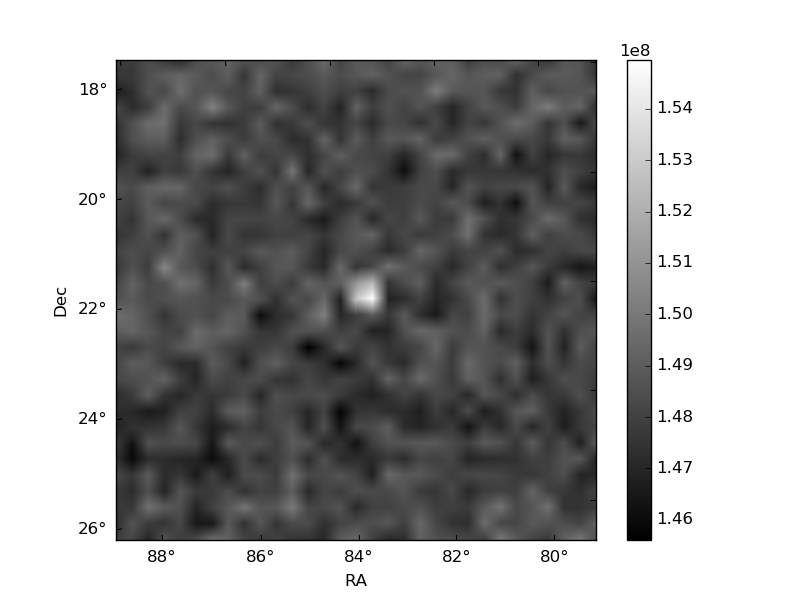
Histogram calculated using DETX and DETY for each event in the final _common_clean file
| Quadrant A | 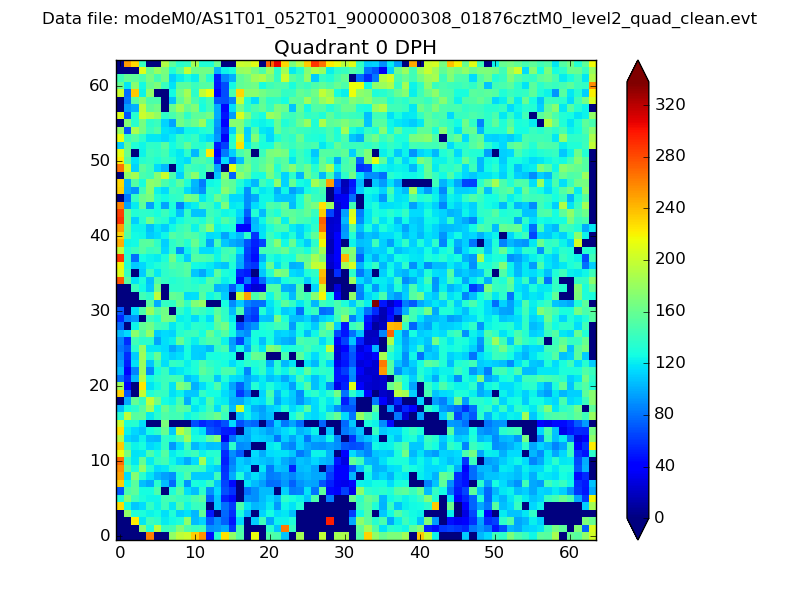 |
 |
Quadrant B |
|---|---|---|---|
| Quadrant D | 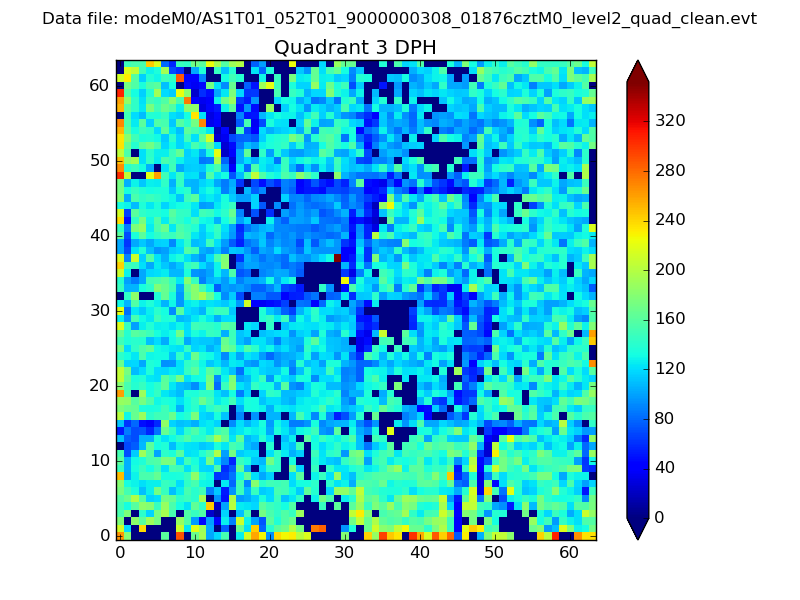 |
 |
Quadrant C |
| Plot type | Count rate plots | Images |
|---|---|---|
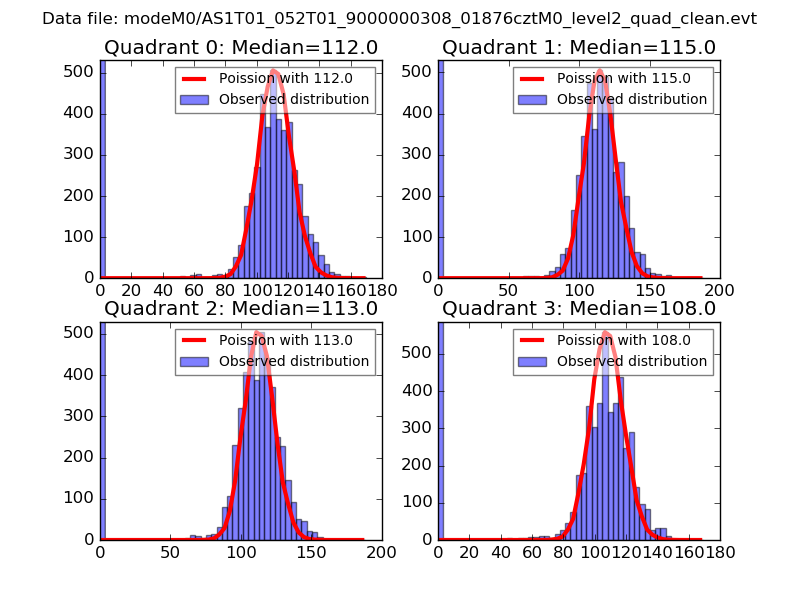
| Comparison with Poisson distribution Blue bars denote a histogram of data divided into 1 sec bins. Red curve is a Poisson curve with rate = median count rate of data. |
 |
 |
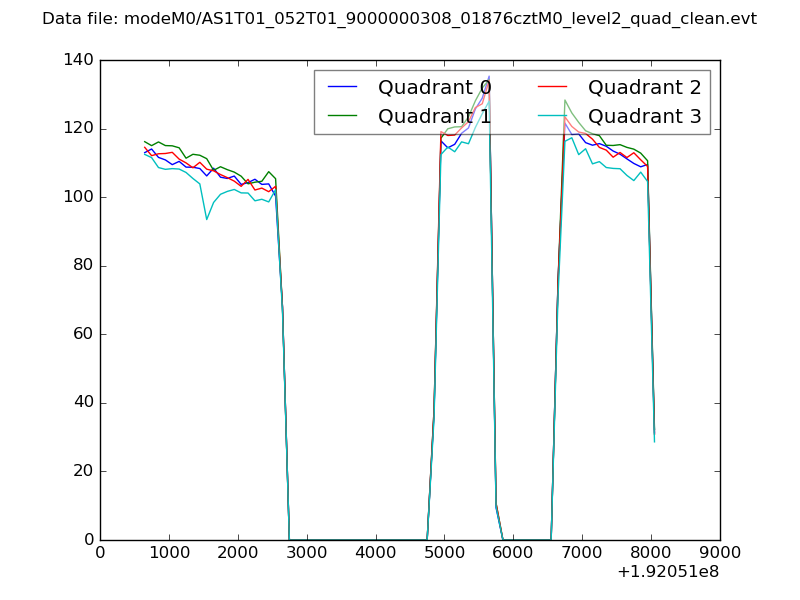
| Quadrant-wise count rates Data is divided into 100 sec bins |
 |
|
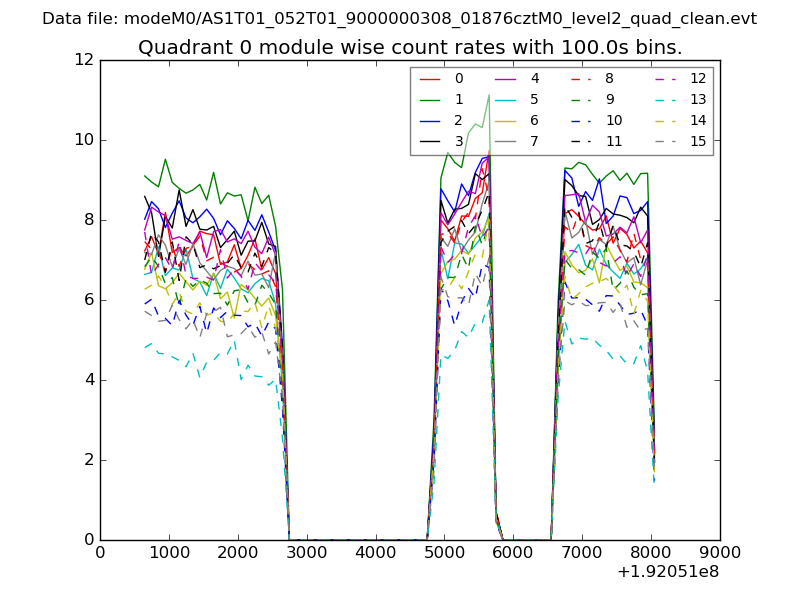
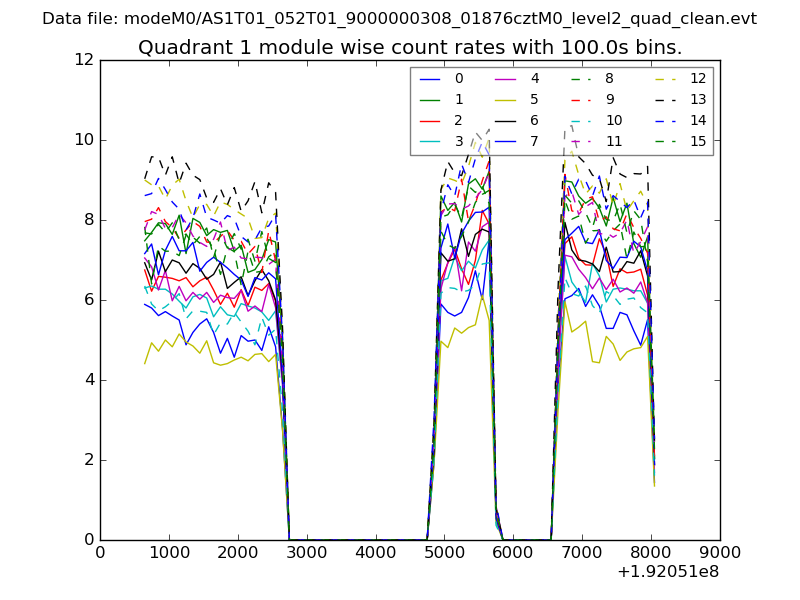
| Module-wise count rates for Quadrant A Data is divided into 100 sec bins |
 |
 |
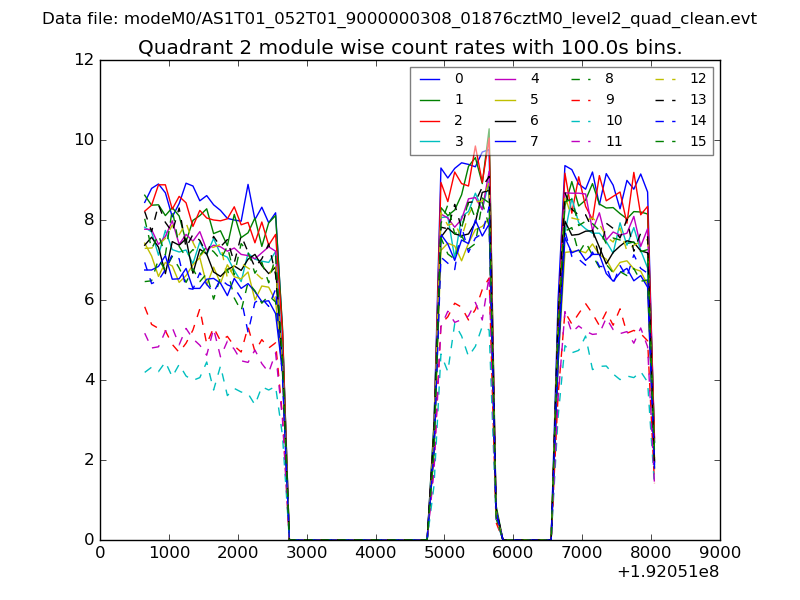
| Module-wise count rates for Quadrant B Data is divided into 100 sec bins |
 |
 |
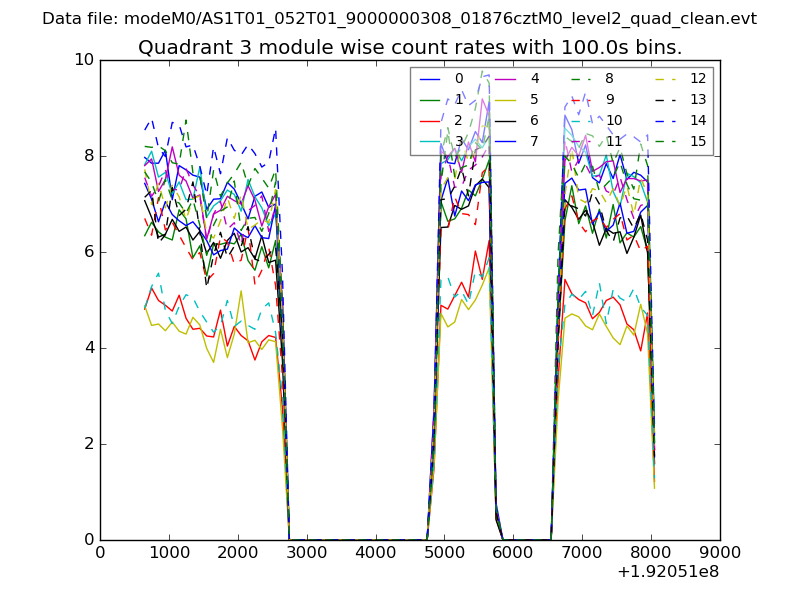
| Module-wise count rates for Quadrant C Data is divided into 100 sec bins |
 |
 |
| Module-wise count rates for Quadrant D Data is divided into 100 sec bins |
 |
 |
| Parameter | Plot |
|---|---|
| CZT HV Monitor | 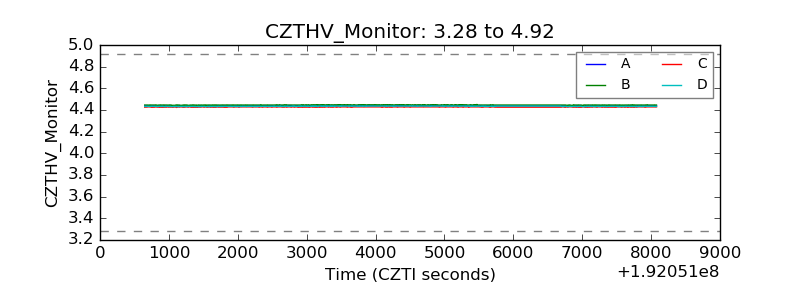 |
| D_VDD | 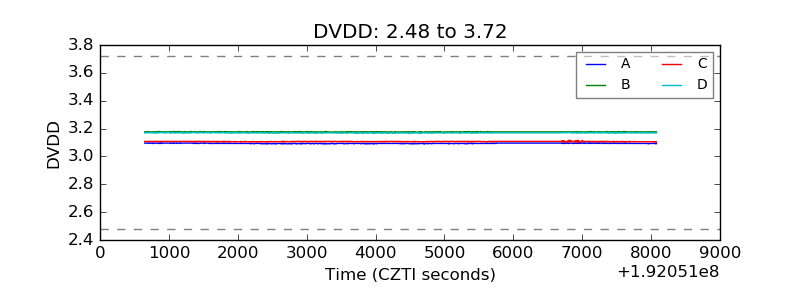 |
| Temperature 1 | 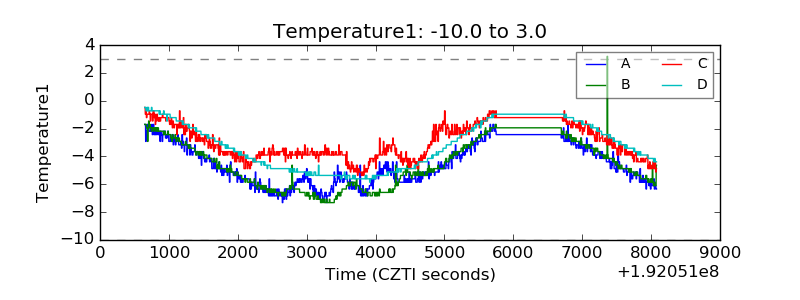 |
| Veto HV Monitor | 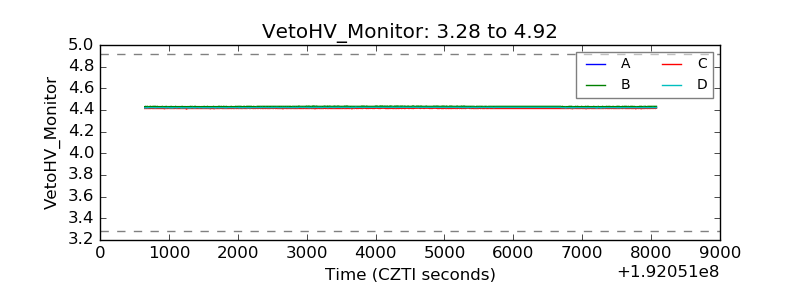 |
| Veto LLD | 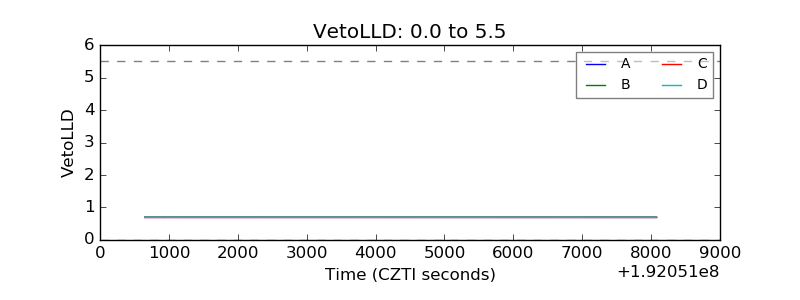 |
| Alpha Counter | 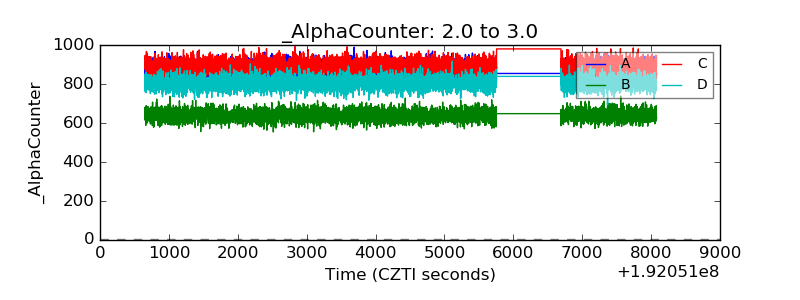 |
| _CPM_Rate | 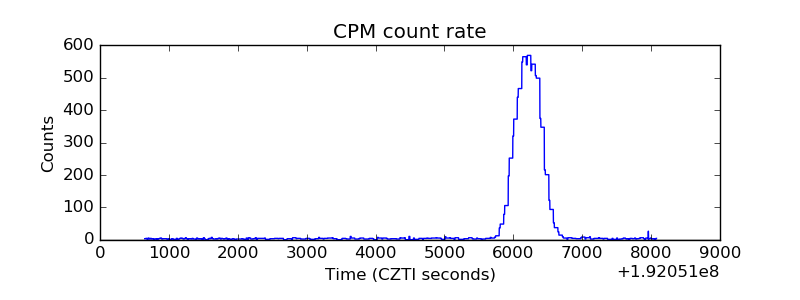 |
| CZT Counter | 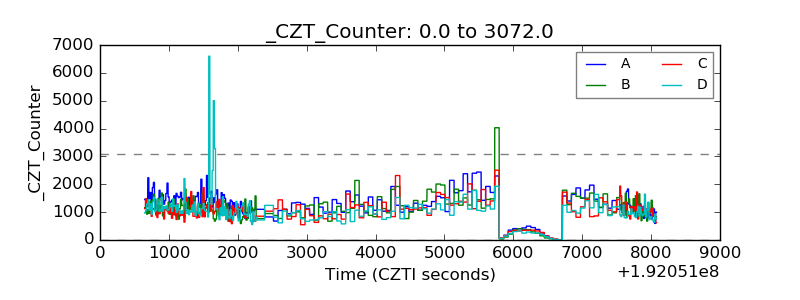 |
| +2.5 Volts monitor |  |
| +5 Volts monitor | 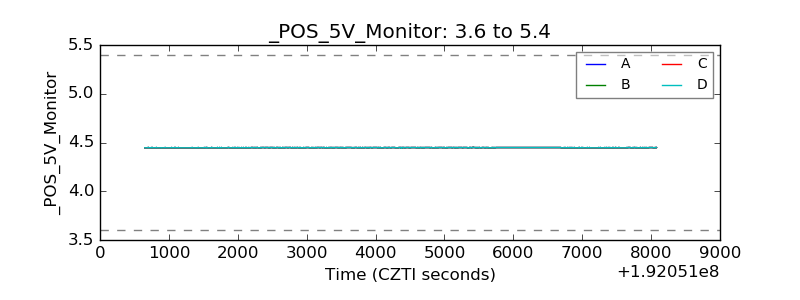 |
| _ROLL_ROT | 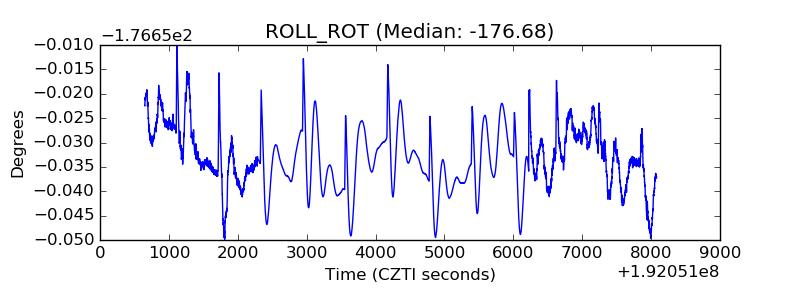 |
| _Roll_DEC | 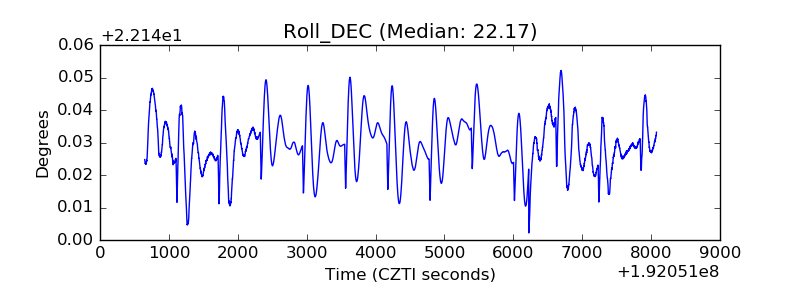 |
| _Roll_RA | 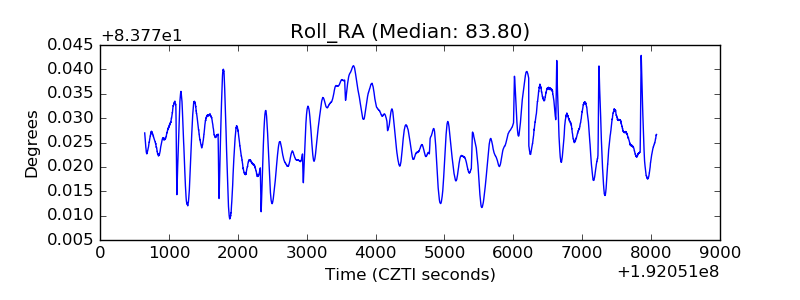 |
| Veto Counter |  |