| Param | Original file | Final file |
|---|---|---|
| Filename | modeM0/AS1T01_054T01_9000000310cztM0_level2.fits | modeM0/AS1T01_054T01_9000000310cztM0_level2_quad_clean.evt |
| Size (bytes) | 901,494,720 | 920,306,880 |
| Size | 859.7 MB | 877.7 MB |
| Events in quadrant A | 5,241,694 | 5,385,540 |
| Events in quadrant B | 5,268,216 | 5,446,213 |
| Events in quadrant C | 5,212,362 | 5,194,549 |
| Events in quadrant D | 4,491,040 | 4,758,210 |
| Mode M9 | |||
|---|---|---|---|
| Quadrant | BADHDUFLAG | Total packets | Discarded packets |
| A | 1 | 140622490155048 | 140621524238382 |
| B | 1 | 140622490155048 | 140621524238382 |
| C | 1 | 140622490155048 | 140621524238382 |
| D | 1 | 140622490155048 | 140621524238382 |
| Mode M0 | |||
|---|---|---|---|
| Quadrant | BADHDUFLAG | Total packets | Discarded packets |
| A | 0 | 487582 | 0 |
| B | 0 | 462490 | 0 |
| C | 0 | 434133 | 0 |
| D | 0 | 424386 | 0 |
| Mode SS | |||
|---|---|---|---|
| Quadrant | BADHDUFLAG | Total packets | Discarded packets |
| A | 0 | 2074 | 0 |
| B | 0 | 2074 | 0 |
| C | 0 | 2074 | 0 |
| D | 0 | 2074 | 0 |
| Quadrant | Total seconds | Saturated seconds | Saturation percentage |
|---|---|---|---|
| A | 103418 | 1169 | 1.130364% |
| B | 103426 | 799 | 0.772533% |
| C | 103420 | 460 | 0.444788% |
| D | 103414 | 1048 | 1.013402% |
Noise dominated data is calculated using 1-second bins in cleaned event files. If a bin has >2000 counts, and if more than 50% of those come from <1% of pixels, then it is considered to be noise-dominated and hence unusable.
| Quadrant | # 1 sec bins | Bins with >0 counts | Bins with >2000 counts | High rate bins dominated by noise | Noise dominated (total time) | Noise dominated (detector-on time) | Marked lightcurve |
|---|---|---|---|---|---|---|---|
| A | 120322 | 103420 | 0 | 0 | 0.00% | 0.00% | 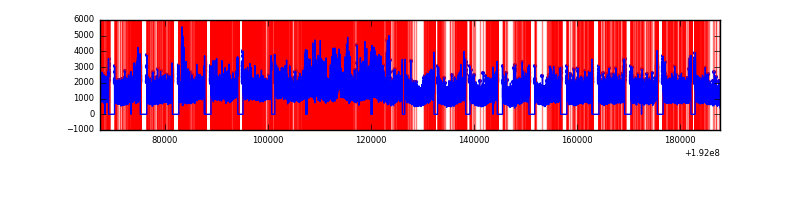 |
| B | 120322 | 103422 | 0 | 0 | 0.00% | 0.00% | 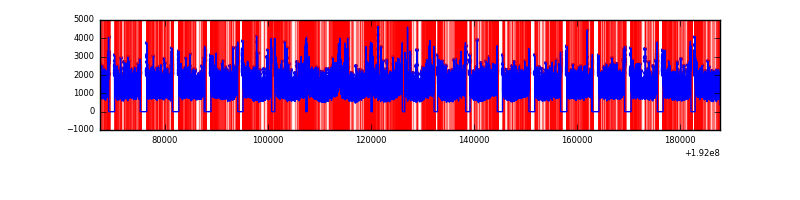 |
| C | 120322 | 103422 | 0 | 0 | 0.00% | 0.00% |  |
| D | 120322 | 103392 | 0 | 0 | 0.00% | 0.00% |  |
Top three noisy pixels from each quadrant. If the there are fewer than three noisy pixels in the level2.evt file, extra rows are filled as -1
| Pixel properties | Quadrant properties | ||||||
|---|---|---|---|---|---|---|---|
| Quadrant | DetID | PixID | Counts | Sigma | Mean | Median | Sigma |
| A | 0 | 29 | 4938 | 11.44 | 1362 | 1266 | 320.8 |
| A | 7 | 110 | 4624 | 10.47 | 1362 | 1266 | 320.8 |
| A | 14 | 79 | 3806 | 7.92 | 1362 | 1266 | 320.8 |
| B | 2 | 9 | 4102 | 10.99 | 1390 | 1317 | 253.3 |
| B | 5 | 128 | 3453 | 8.43 | 1390 | 1317 | 253.3 |
| B | 10 | 225 | 3430 | 8.34 | 1390 | 1317 | 253.3 |
| C | 12 | 241 | 3428 | 6.39 | 1374 | 1266 | 338.1 |
| C | 9 | 242 | 3421 | 6.37 | 1374 | 1266 | 338.1 |
| C | 2 | 127 | 3407 | 6.33 | 1374 | 1266 | 338.1 |
| D | 1 | 19 | 3301 | 7.09 | 1281 | 1171 | 300.2 |
| D | 3 | 14 | 3174 | 6.67 | 1281 | 1171 | 300.2 |
| D | 6 | 44 | 3163 | 6.63 | 1281 | 1171 | 300.2 |
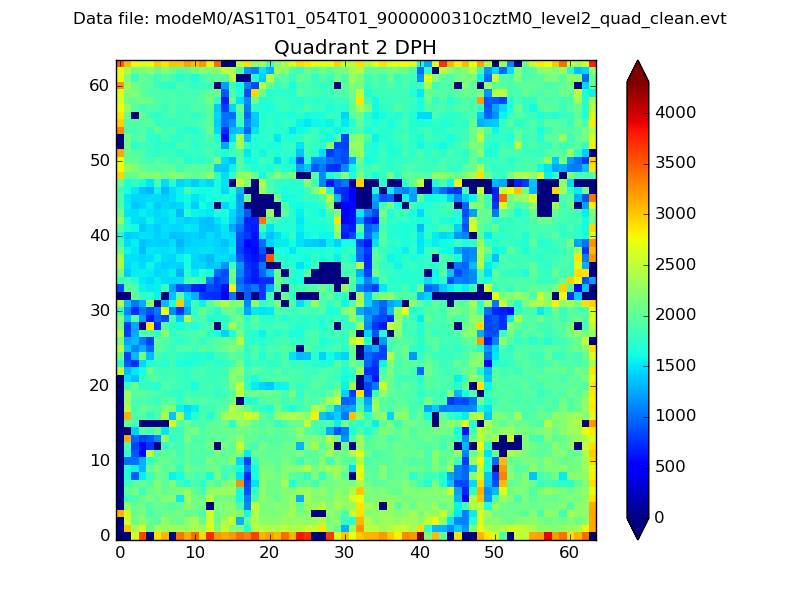
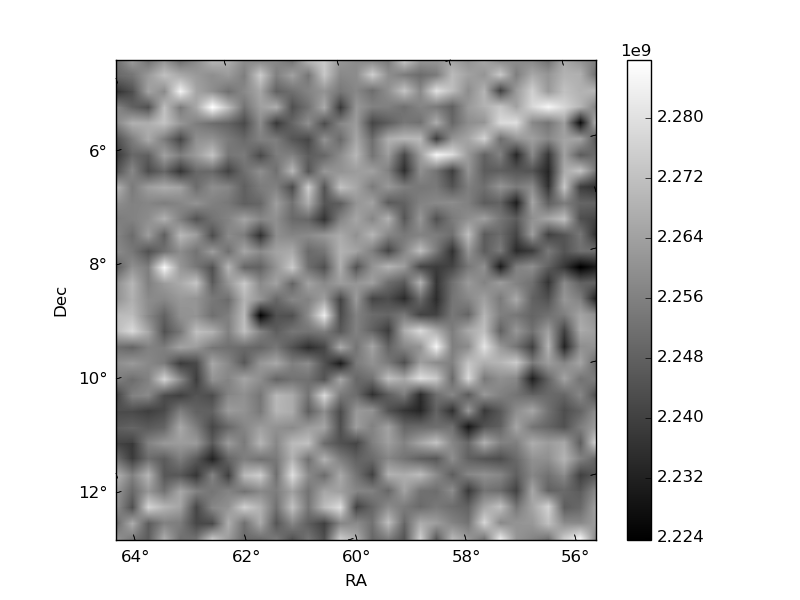
Histogram calculated using DETX and DETY for each event in the final _common_clean file
| Quadrant A | 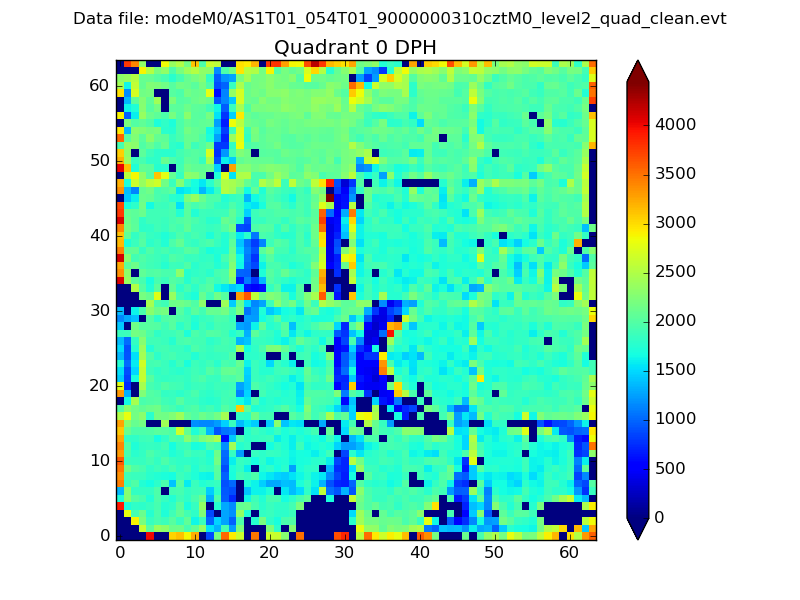 |
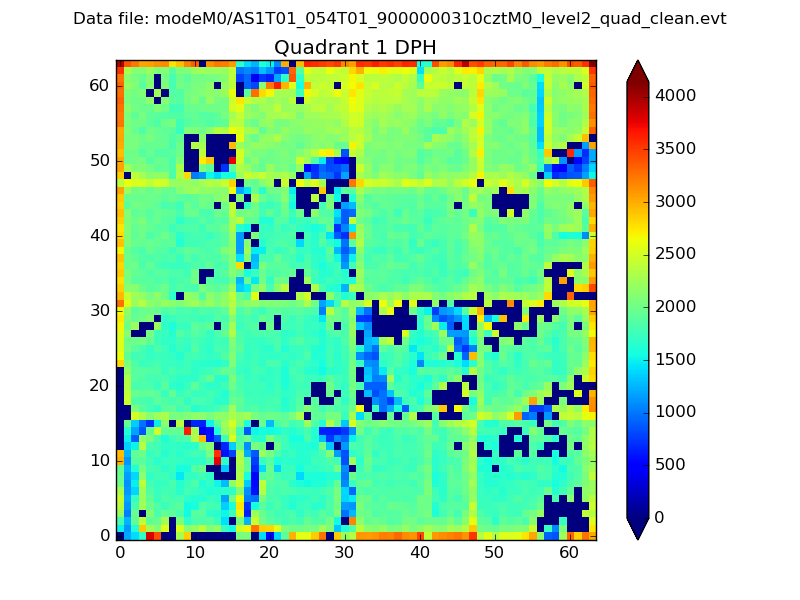 |
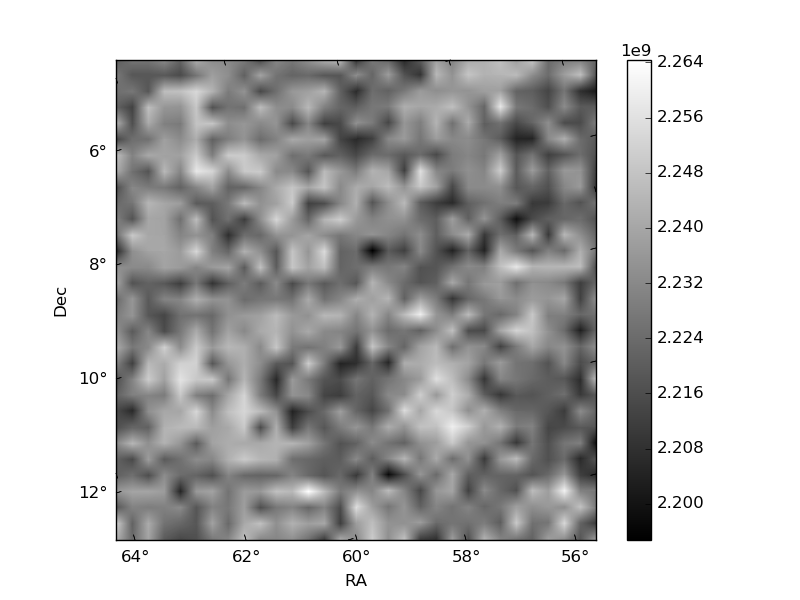
Quadrant B |
|---|---|---|---|
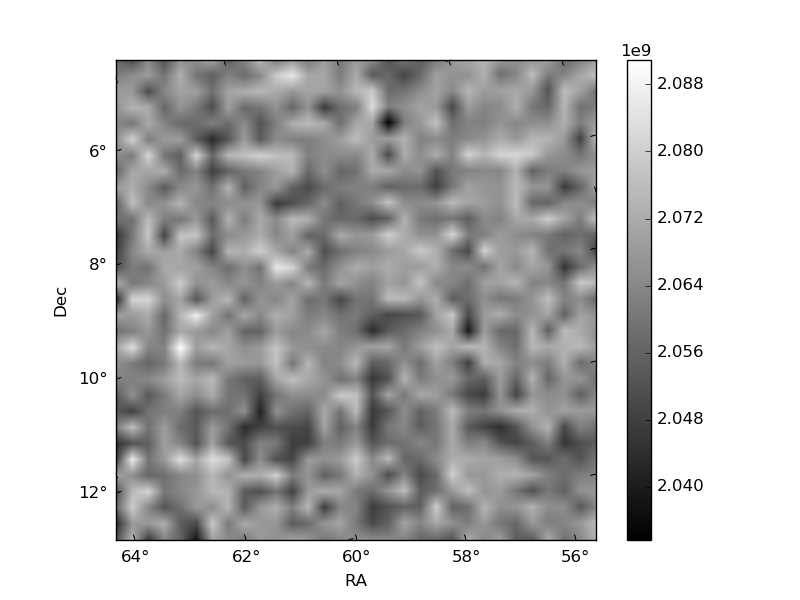
| Quadrant D | 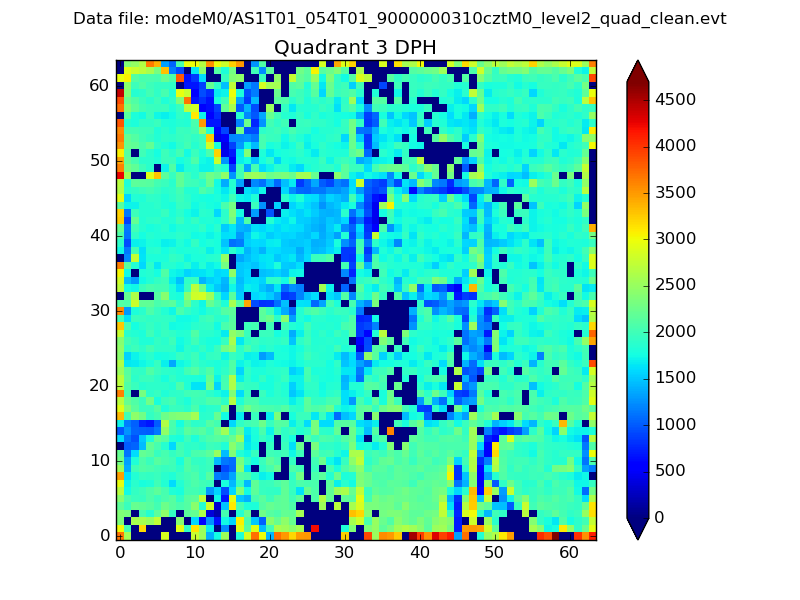 |
 |
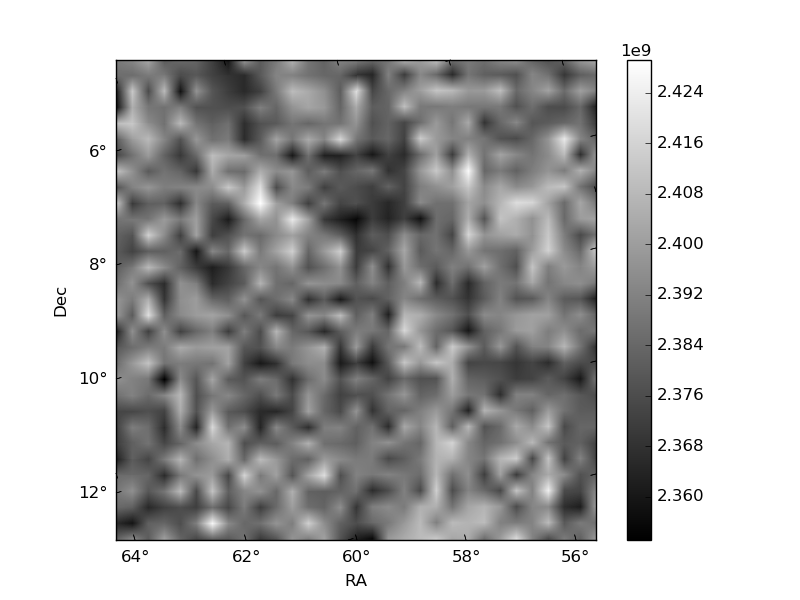
Quadrant C |
| Plot type | Count rate plots | Images |
|---|---|---|
| Comparison with Poisson distribution Blue bars denote a histogram of data divided into 1 sec bins. Red curve is a Poisson curve with rate = median count rate of data. |
 |
 |
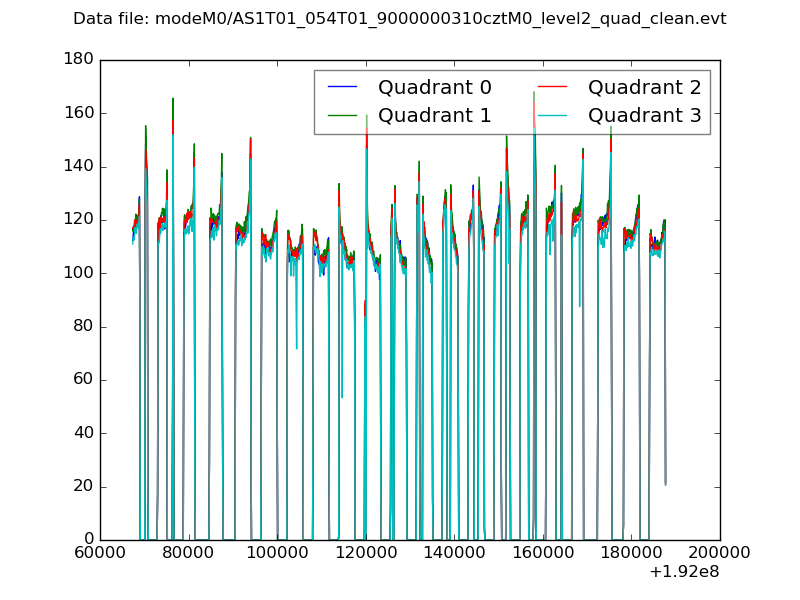
| Quadrant-wise count rates Data is divided into 100 sec bins |
 |
|
| Module-wise count rates for Quadrant A Data is divided into 100 sec bins |
 |
 |
| Module-wise count rates for Quadrant B Data is divided into 100 sec bins |
 |
 |
| Module-wise count rates for Quadrant C Data is divided into 100 sec bins |
 |
 |
| Module-wise count rates for Quadrant D Data is divided into 100 sec bins |
 |
 |
| Parameter | Plot |
|---|---|
| CZT HV Monitor |  |
| D_VDD | 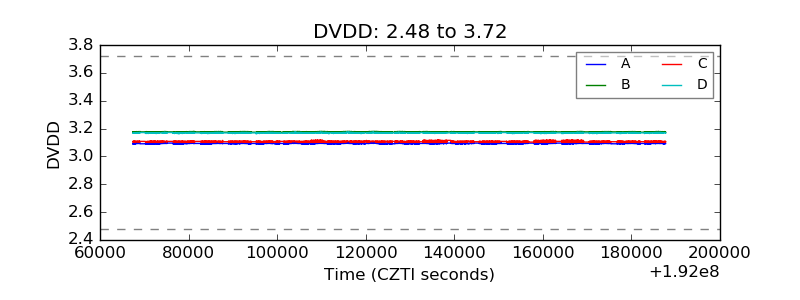 |
| Temperature 1 | 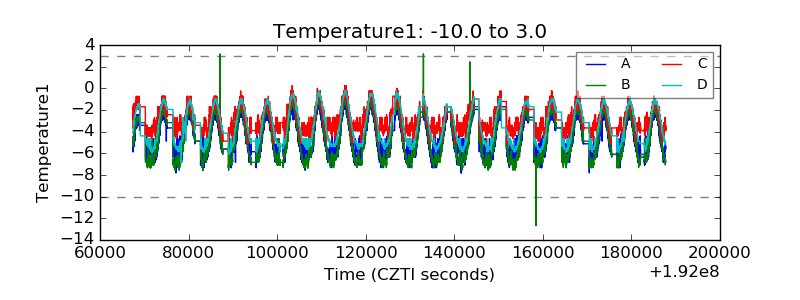 |
| Veto HV Monitor | 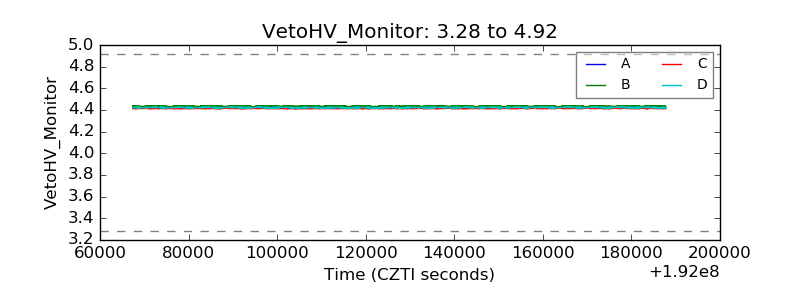 |
| Veto LLD |  |
| Alpha Counter | 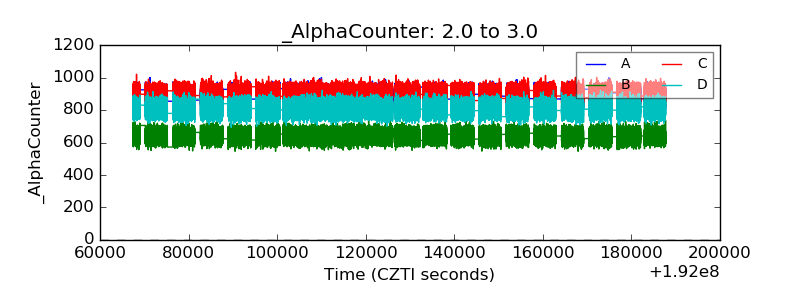 |
| _CPM_Rate | 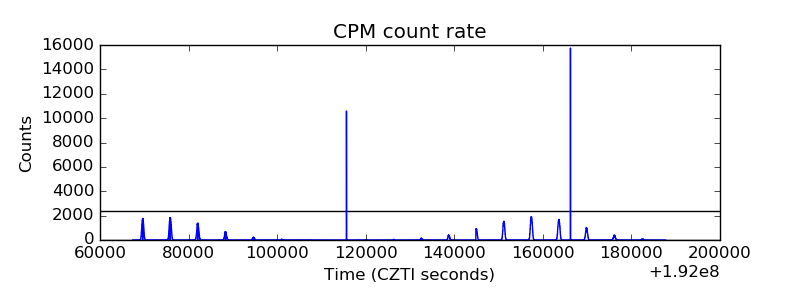 |
| CZT Counter | 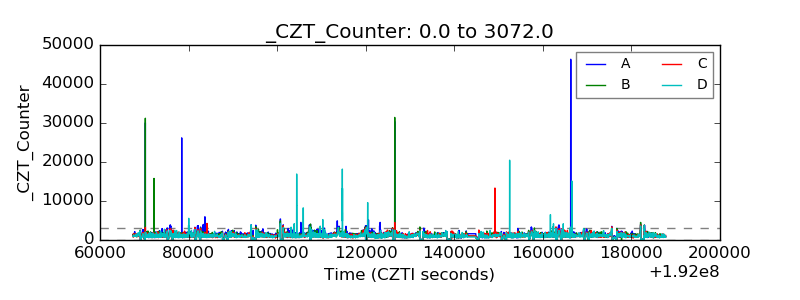 |
| +2.5 Volts monitor | 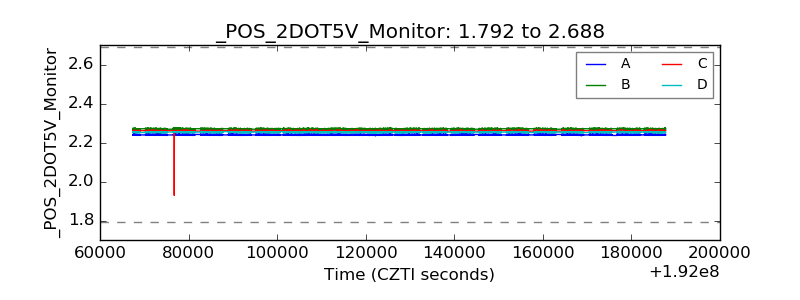 |
| +5 Volts monitor | 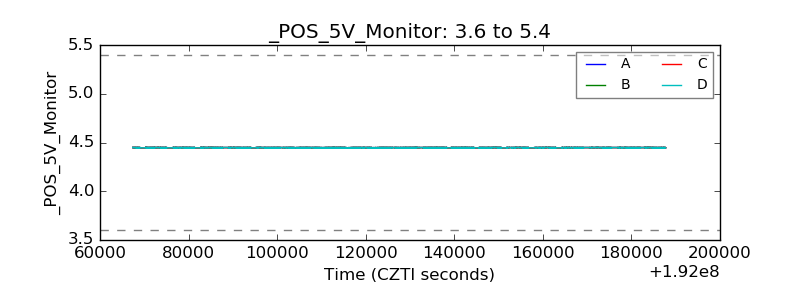 |
| _ROLL_ROT | 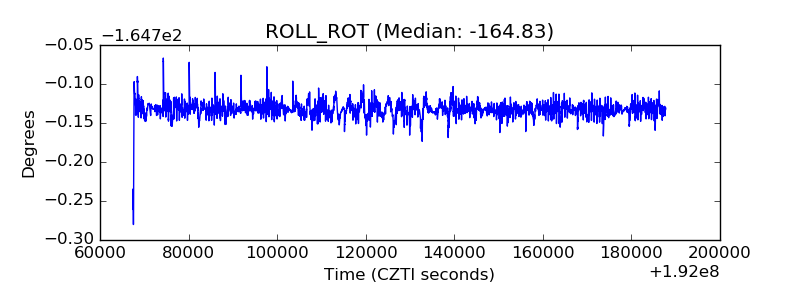 |
| _Roll_DEC | 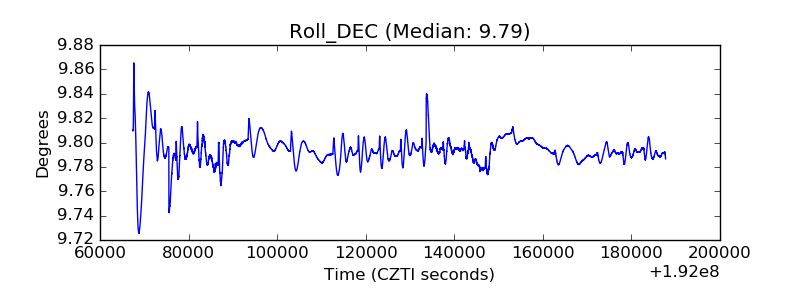 |
| _Roll_RA | 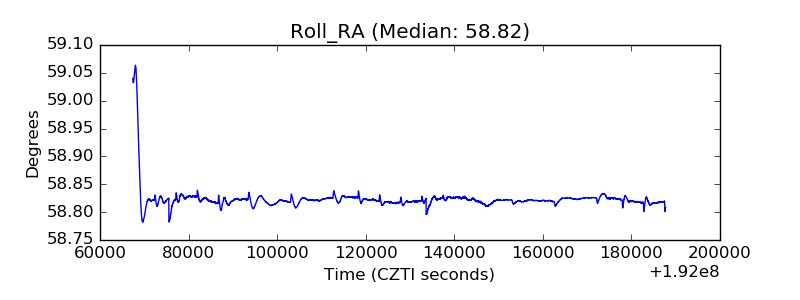 |
| Veto Counter | 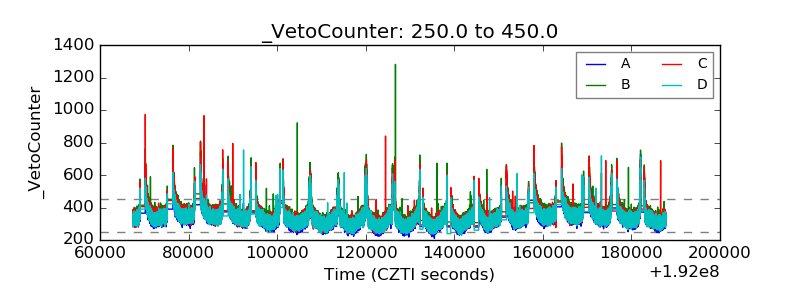 |