| Param | Original file | Final file |
|---|---|---|
| Filename | modeM0/AS1T01_052T01_9000000312cztM0_level2.fits | modeM0/AS1T01_052T01_9000000312cztM0_level2_quad_clean.evt |
| Size (bytes) | 884,810,880 | 961,142,400 |
| Size | 843.8 MB | 916.6 MB |
| Events in quadrant A | 5,127,752 | 5,719,645 |
| Events in quadrant B | 5,143,762 | 5,824,591 |
| Events in quadrant C | 5,097,262 | 5,534,987 |
| Events in quadrant D | 4,357,440 | 4,961,194 |
| Mode SS | |||
|---|---|---|---|
| Quadrant | BADHDUFLAG | Total packets | Discarded packets |
| A | 0 | 2068 | 0 |
| B | 0 | 2068 | 0 |
| C | 0 | 2068 | 0 |
| D | 0 | 2068 | 0 |
| Mode M9 | |||
|---|---|---|---|
| Quadrant | BADHDUFLAG | Total packets | Discarded packets |
| A | 1 | 139658439223336 | 139655156596782 |
| B | 1 | 139658439223336 | 139655156596782 |
| C | 1 | 139658439223336 | 139655156596782 |
| D | 1 | 139658439223336 | 139655156596782 |
| Mode M0 | |||
|---|---|---|---|
| Quadrant | BADHDUFLAG | Total packets | Discarded packets |
| A | 0 | 470603 | 0 |
| B | 0 | 463438 | 0 |
| C | 0 | 436464 | 0 |
| D | 0 | 425262 | 0 |
| Quadrant | Total seconds | Saturated seconds | Saturation percentage |
|---|---|---|---|
| A | 103138 | 1056 | 1.023871% |
| B | 103140 | 835 | 0.809579% |
| C | 103140 | 460 | 0.445996% |
| D | 103136 | 1062 | 1.029708% |
Noise dominated data is calculated using 1-second bins in cleaned event files. If a bin has >2000 counts, and if more than 50% of those come from <1% of pixels, then it is considered to be noise-dominated and hence unusable.
| Quadrant | # 1 sec bins | Bins with >0 counts | Bins with >2000 counts | High rate bins dominated by noise | Noise dominated (total time) | Noise dominated (detector-on time) | Marked lightcurve |
|---|---|---|---|---|---|---|---|
| A | 115169 | 103140 | 0 | 0 | 0.00% | 0.00% |  |
| B | 115169 | 103142 | 0 | 0 | 0.00% | 0.00% |  |
| C | 115169 | 103142 | 0 | 0 | 0.00% | 0.00% |  |
| D | 115169 | 103111 | 0 | 0 | 0.00% | 0.00% | 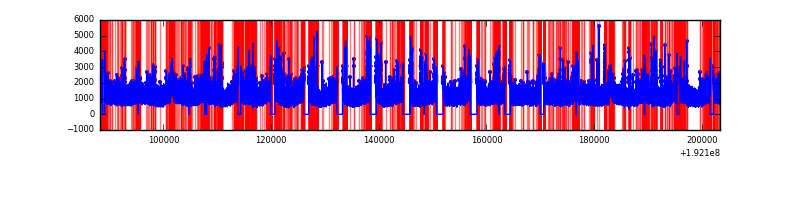 |
Top three noisy pixels from each quadrant. If the there are fewer than three noisy pixels in the level2.evt file, extra rows are filled as -1
| Pixel properties | Quadrant properties | ||||||
|---|---|---|---|---|---|---|---|
| Quadrant | DetID | PixID | Counts | Sigma | Mean | Median | Sigma |
| A | 0 | 29 | 4706 | 11.25 | 1325 | 1236 | 308.5 |
| A | 14 | 188 | 4693 | 11.21 | 1325 | 1236 | 308.5 |
| A | 7 | 110 | 4614 | 10.95 | 1325 | 1236 | 308.5 |
| B | 2 | 9 | 4068 | 10.89 | 1358 | 1282 | 255.8 |
| B | 5 | 128 | 3353 | 8.1 | 1358 | 1282 | 255.8 |
| B | 10 | 225 | 3351 | 8.09 | 1358 | 1282 | 255.8 |
| C | 12 | 241 | 3348 | 6.42 | 1343 | 1238 | 328.7 |
| C | 9 | 242 | 3321 | 6.34 | 1343 | 1238 | 328.7 |
| C | 1 | 81 | 3275 | 6.2 | 1343 | 1238 | 328.7 |
| D | 6 | 44 | 3097 | 6.64 | 1245 | 1137 | 295.2 |
| D | 1 | 19 | 3095 | 6.63 | 1245 | 1137 | 295.2 |
| D | 11 | 82 | 3090 | 6.62 | 1245 | 1137 | 295.2 |
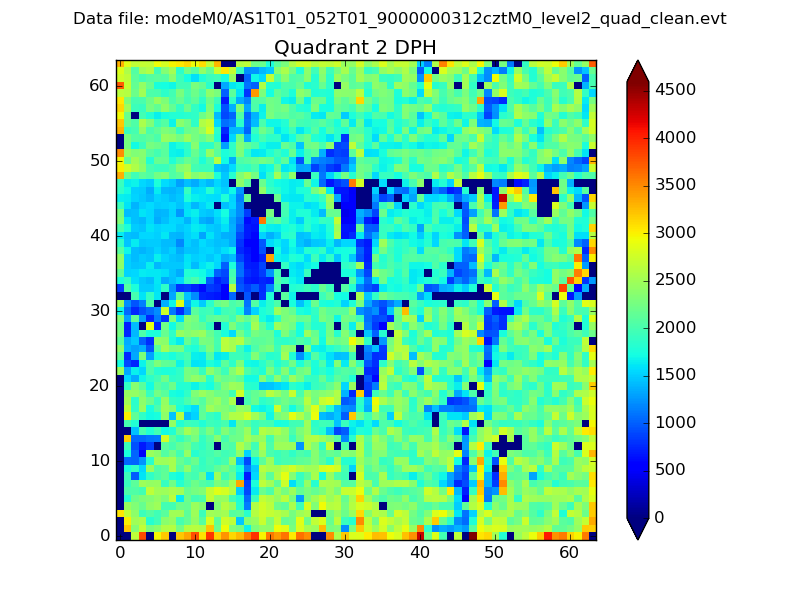
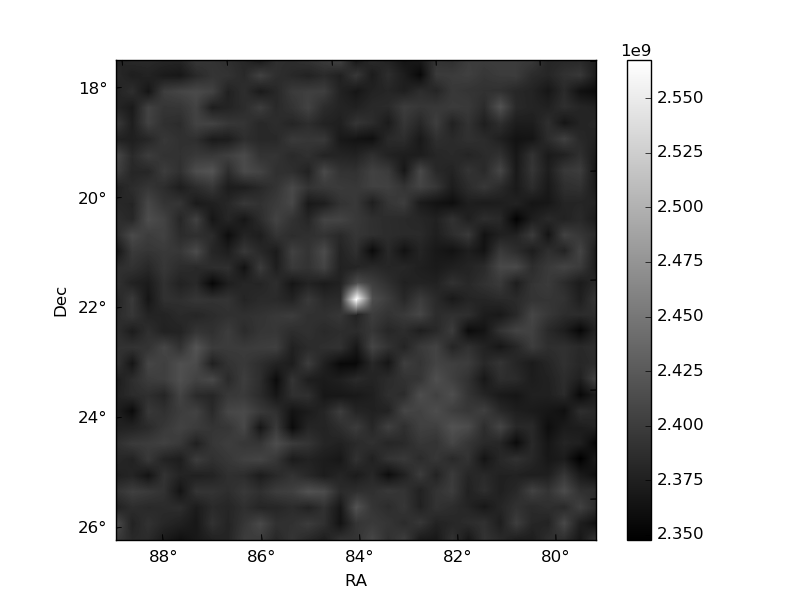
Histogram calculated using DETX and DETY for each event in the final _common_clean file
| Quadrant A |  |
 |
Quadrant B |
|---|---|---|---|
| Quadrant D | 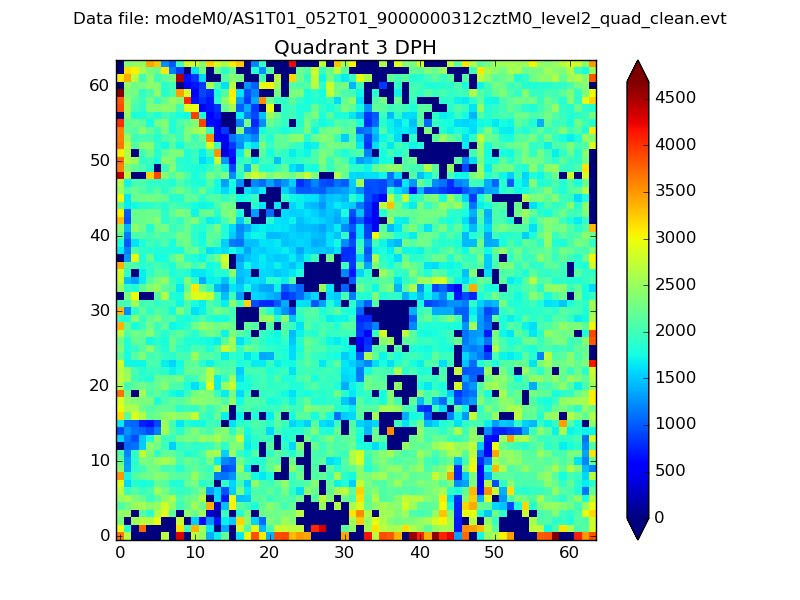 |
 |
Quadrant C |
| Plot type | Count rate plots | Images |
|---|---|---|
| Comparison with Poisson distribution Blue bars denote a histogram of data divided into 1 sec bins. Red curve is a Poisson curve with rate = median count rate of data. |
 |
 |
| Quadrant-wise count rates Data is divided into 100 sec bins |
 |
|
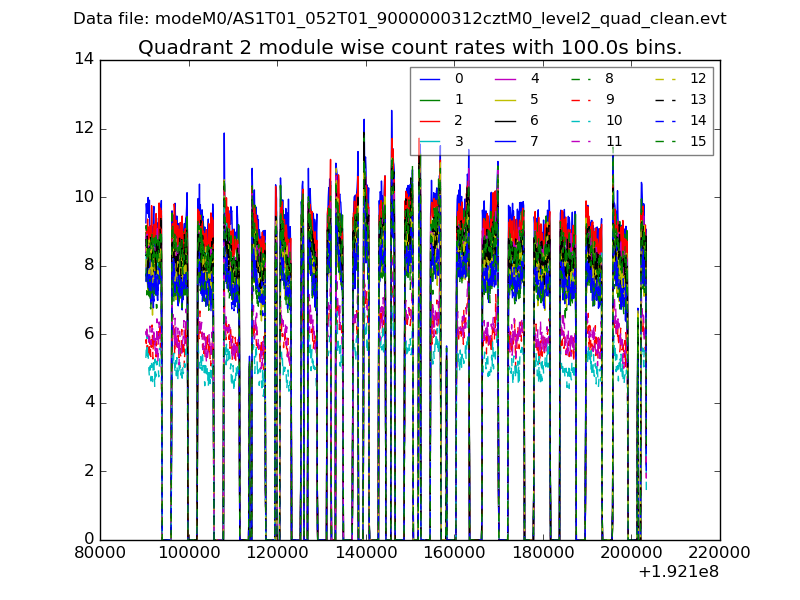
| Module-wise count rates for Quadrant A Data is divided into 100 sec bins |
 |
 |
| Module-wise count rates for Quadrant B Data is divided into 100 sec bins |
 |
 |
| Module-wise count rates for Quadrant C Data is divided into 100 sec bins |
 |
 |
| Module-wise count rates for Quadrant D Data is divided into 100 sec bins |
 |
 |
| Parameter | Plot |
|---|---|
| CZT HV Monitor | 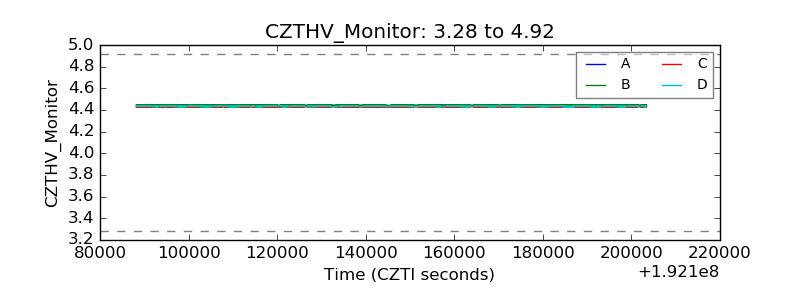 |
| D_VDD | 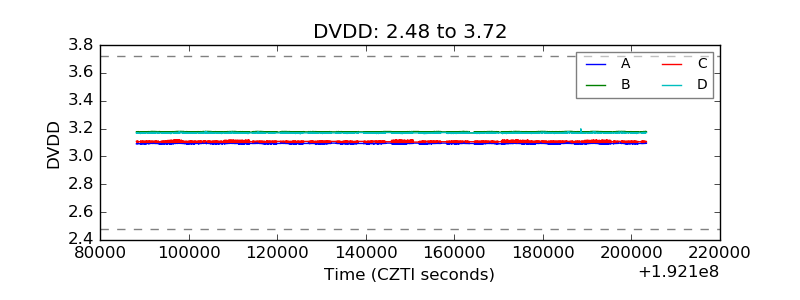 |
| Temperature 1 |  |
| Veto HV Monitor | 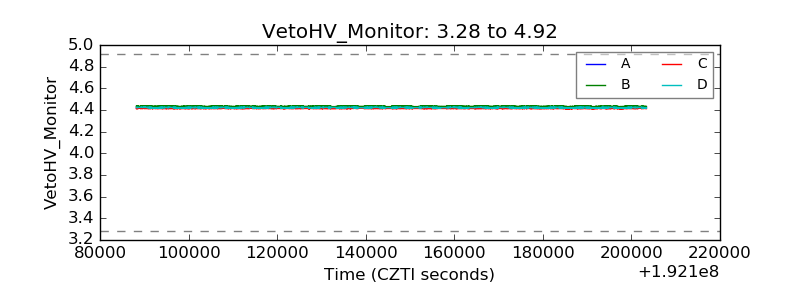 |
| Veto LLD | 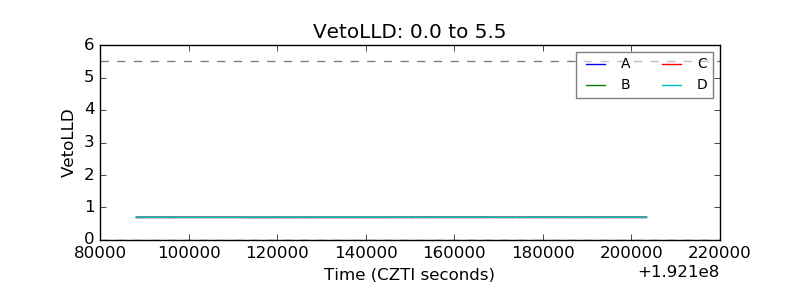 |
| Alpha Counter |  |
| _CPM_Rate | 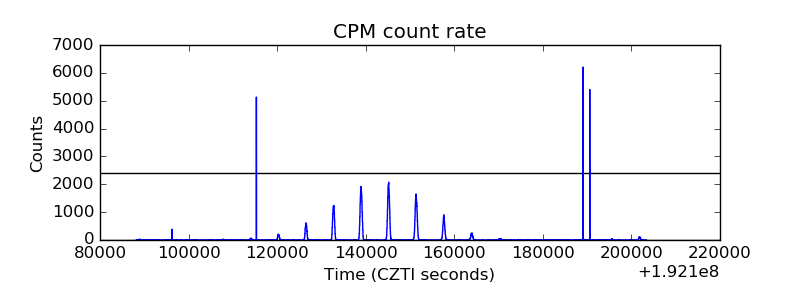 |
| CZT Counter | 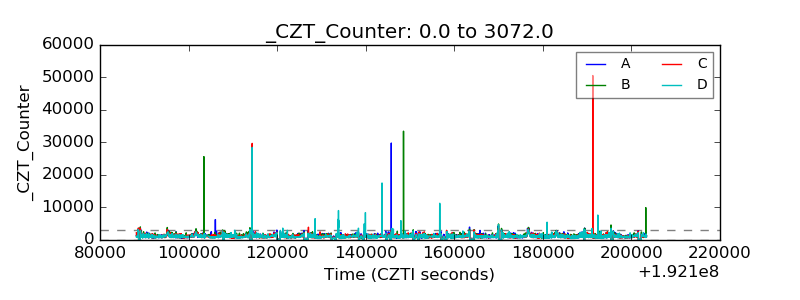 |
| +2.5 Volts monitor | 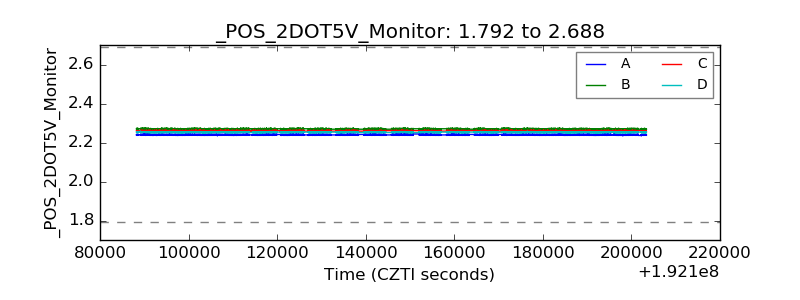 |
| +5 Volts monitor |  |
| _ROLL_ROT |  |
| _Roll_DEC | 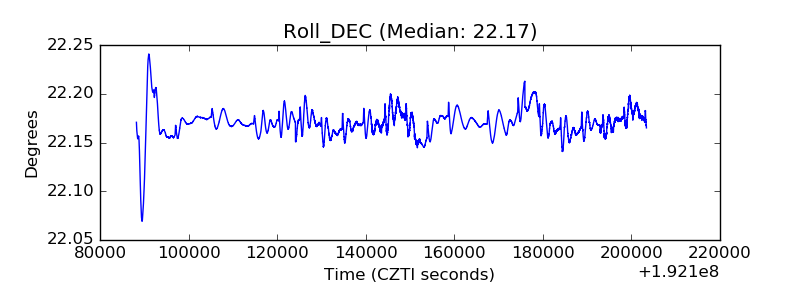 |
| _Roll_RA |  |
| Veto Counter |  |