| Param | Original file | Final file |
|---|---|---|
| Filename | modeM0/AS1T01_055T01_9000000314cztM0_level2.fits | modeM0/AS1T01_055T01_9000000314cztM0_level2_quad_clean.evt |
| Size (bytes) | 1,795,752,000 | 1,833,189,120 |
| Size | 1.7 GB | 1.7 GB |
| Events in quadrant A | 10,419,394 | 10,740,371 |
| Events in quadrant B | 10,416,446 | 10,769,938 |
| Events in quadrant C | 10,325,174 | 10,279,686 |
| Events in quadrant D | 8,937,844 | 9,445,702 |
| Mode M0 | |||
|---|---|---|---|
| Quadrant | BADHDUFLAG | Total packets | Discarded packets |
| A | 0 | 906817 | 0 |
| B | 0 | 926182 | 0 |
| C | 0 | 866548 | 0 |
| D | 0 | 838164 | 0 |
| Mode SS | |||
|---|---|---|---|
| Quadrant | BADHDUFLAG | Total packets | Discarded packets |
| A | 0 | 4172 | 0 |
| B | 0 | 4172 | 0 |
| C | 0 | 4172 | 0 |
| D | 0 | 4172 | 0 |
| Mode M9 | |||
|---|---|---|---|
| Quadrant | BADHDUFLAG | Total packets | Discarded packets |
| A | 1 | 139697866270760 | 139693811302446 |
| B | 1 | 139697866270760 | 139693811302446 |
| C | 1 | 139697866270760 | 139693811302446 |
| D | 1 | 139697866270760 | 139693811302446 |
| Quadrant | Total seconds | Saturated seconds | Saturation percentage |
|---|---|---|---|
| A | 208551 | 1296 | 0.621431% |
| B | 208549 | 1827 | 0.876053% |
| C | 208554 | 708 | 0.339480% |
| D | 208562 | 1233 | 0.591191% |
Noise dominated data is calculated using 1-second bins in cleaned event files. If a bin has >2000 counts, and if more than 50% of those come from <1% of pixels, then it is considered to be noise-dominated and hence unusable.
| Quadrant | # 1 sec bins | Bins with >0 counts | Bins with >2000 counts | High rate bins dominated by noise | Noise dominated (total time) | Noise dominated (detector-on time) | Marked lightcurve |
|---|---|---|---|---|---|---|---|
| A | 245767 | 208566 | 0 | 0 | 0.00% | 0.00% |  |
| B | 245767 | 208398 | 0 | 0 | 0.00% | 0.00% |  |
| C | 245767 | 208566 | 0 | 0 | 0.00% | 0.00% |  |
| D | 245767 | 208567 | 0 | 0 | 0.00% | 0.00% |  |
Top three noisy pixels from each quadrant. If the there are fewer than three noisy pixels in the level2.evt file, extra rows are filled as -1
| Pixel properties | Quadrant properties | ||||||
|---|---|---|---|---|---|---|---|
| Quadrant | DetID | PixID | Counts | Sigma | Mean | Median | Sigma |
| A | 0 | 29 | 9566 | 11.22 | 2705 | 2517 | 628.1 |
| A | 7 | 110 | 9123 | 10.52 | 2705 | 2517 | 628.1 |
| A | 0 | 30 | 7466 | 7.88 | 2705 | 2517 | 628.1 |
| B | 2 | 9 | 8395 | 11.76 | 2747 | 2603 | 492.7 |
| B | 5 | 128 | 6966 | 8.86 | 2747 | 2603 | 492.7 |
| B | 10 | 225 | 6816 | 8.55 | 2747 | 2603 | 492.7 |
| C | 2 | 127 | 6726 | 6.4 | 2722 | 2509 | 658.9 |
| C | 9 | 242 | 6660 | 6.3 | 2722 | 2509 | 658.9 |
| C | 3 | 235 | 6588 | 6.19 | 2722 | 2509 | 658.9 |
| D | 1 | 19 | 6523 | 6.97 | 2549 | 2330 | 601.6 |
| D | 6 | 44 | 6246 | 6.51 | 2549 | 2330 | 601.6 |
| D | 11 | 82 | 6243 | 6.5 | 2549 | 2330 | 601.6 |
Histogram calculated using DETX and DETY for each event in the final _common_clean file
| Quadrant A | 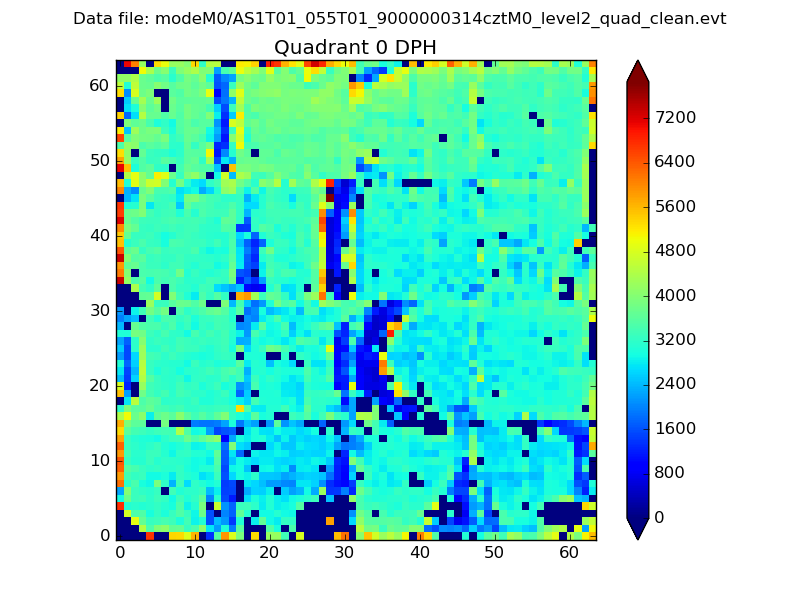 |
 |
Quadrant B |
|---|---|---|---|
| Quadrant D |  |
 |
Quadrant C |
| Plot type | Count rate plots | Images |
|---|---|---|
| Comparison with Poisson distribution Blue bars denote a histogram of data divided into 1 sec bins. Red curve is a Poisson curve with rate = median count rate of data. |
 |
 |
| Quadrant-wise count rates Data is divided into 100 sec bins |
 |
|
| Module-wise count rates for Quadrant A Data is divided into 100 sec bins |
 |
 |
| Module-wise count rates for Quadrant B Data is divided into 100 sec bins |
 |
 |
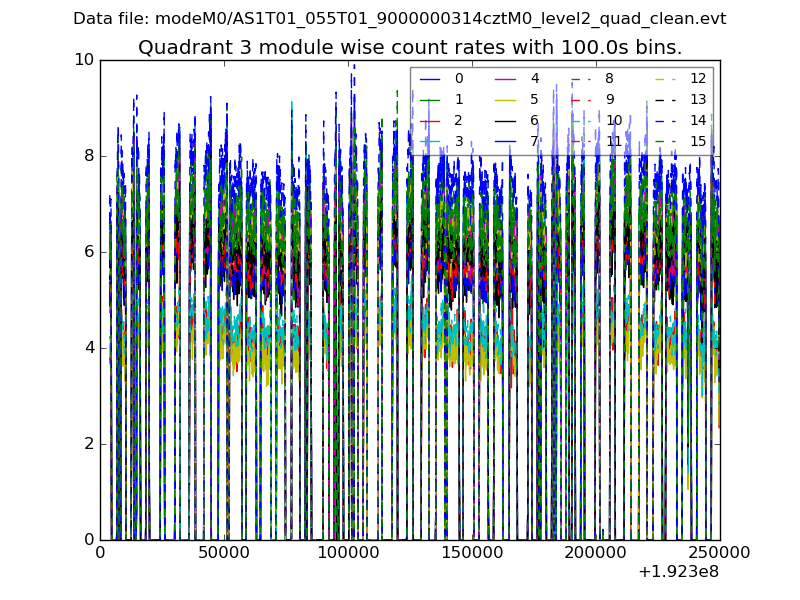
| Module-wise count rates for Quadrant C Data is divided into 100 sec bins |
 |
 |
| Module-wise count rates for Quadrant D Data is divided into 100 sec bins |
 |
 |
| Parameter | Plot |
|---|---|
| CZT HV Monitor |  |
| D_VDD | 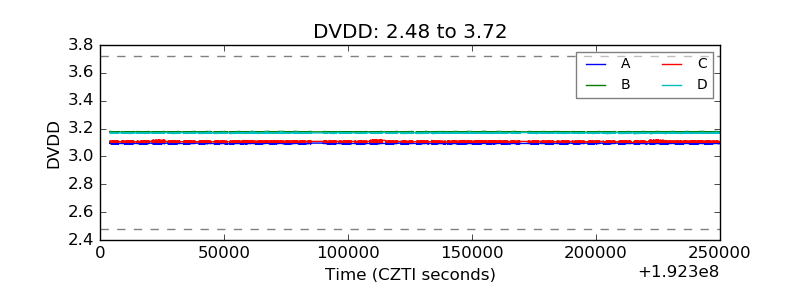 |
| Temperature 1 |  |
| Veto HV Monitor |  |
| Veto LLD | 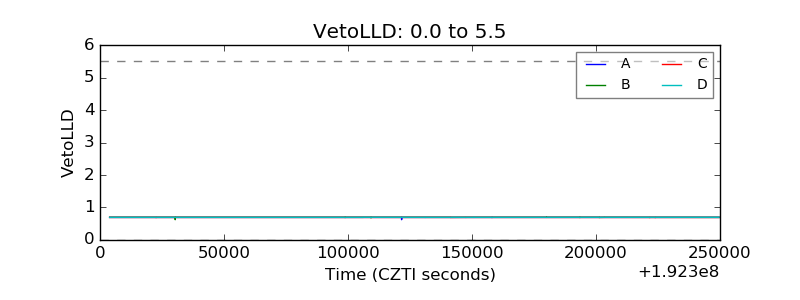 |
| Alpha Counter |  |
| _CPM_Rate | 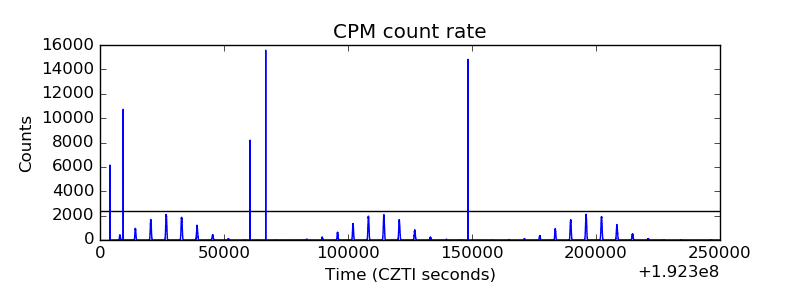 |
| CZT Counter |  |
| +2.5 Volts monitor |  |
| +5 Volts monitor |  |
| _ROLL_ROT | 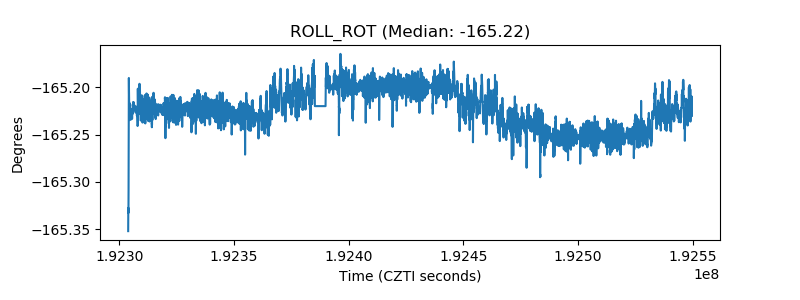 |
| _Roll_DEC | 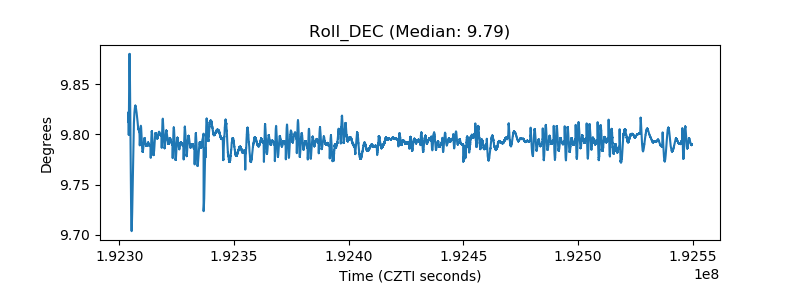 |
| _Roll_RA | 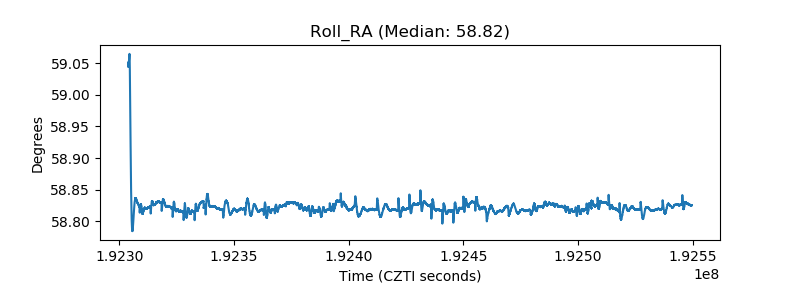 |
| Veto Counter |  |