| Param | Original file | Final file |
|---|---|---|
| Filename | modeM0/AS1P01_010T01_9000000318cztM0_level2.fits | modeM0/AS1P01_010T01_9000000318cztM0_level2_quad_clean.evt |
| Size (bytes) | 2,000,223,360 | 951,200,640 |
| Size | 1.9 GB | 907.1 MB |
| Events in quadrant A | 4,341,488 | 2,581,328 |
| Events in quadrant B | 13,648,161 | 2,613,128 |
| Events in quadrant C | 13,005,391 | 2,483,995 |
| Events in quadrant D | 10,513,377 | 2,277,044 |
| Mode M9 | |||
|---|---|---|---|
| Quadrant | BADHDUFLAG | Total packets | Discarded packets |
| A | 1 | 140537533085736 | 140535624892462 |
| B | 1 | 140537533085736 | 140535624892462 |
| C | 1 | 140537533085736 | 140535624892462 |
| D | 1 | 140537533085736 | 140535624892462 |
| Mode M0 | |||
|---|---|---|---|
| Quadrant | BADHDUFLAG | Total packets | Discarded packets |
| A | 0 | 1243557 | 0 |
| B | 0 | 1273925 | 0 |
| C | 0 | 1165670 | 0 |
| D | 0 | 1095632 | 0 |
| Mode SS | |||
|---|---|---|---|
| Quadrant | BADHDUFLAG | Total packets | Discarded packets |
| A | 0 | 5783 | 0 |
| B | 0 | 5848 | 0 |
| C | 0 | 5845 | 0 |
| D | 0 | 5843 | 0 |
| Quadrant | Total seconds | Saturated seconds | Saturation percentage |
|---|---|---|---|
| A | 282144 | 2735 | 0.969363% |
| B | 282757 | 1982 | 0.700955% |
| C | 274144 | 2103 | 0.767115% |
| D | 257633 | 5522 | 2.143359% |
Noise dominated data is calculated using 1-second bins in cleaned event files. If a bin has >2000 counts, and if more than 50% of those come from <1% of pixels, then it is considered to be noise-dominated and hence unusable.
| Quadrant | # 1 sec bins | Bins with >0 counts | Bins with >2000 counts | High rate bins dominated by noise | Noise dominated (total time) | Noise dominated (detector-on time) | Marked lightcurve |
|---|---|---|---|---|---|---|---|
| A | 472078 | 144877 | 0 | 0 | 0.00% | 0.00% |  |
| B | 1048573 | 408494 | 0 | 0 | 0.00% | 0.00% |  |
| C | 1048573 | 383321 | 0 | 0 | 0.00% | 0.00% |  |
| D | 1048573 | 355665 | 0 | 0 | 0.00% | 0.00% |  |
Top three noisy pixels from each quadrant. If the there are fewer than three noisy pixels in the level2.evt file, extra rows are filled as -1
| Pixel properties | Quadrant properties | ||||||
|---|---|---|---|---|---|---|---|
| Quadrant | DetID | PixID | Counts | Sigma | Mean | Median | Sigma |
| A | 0 | 29 | 3997 | 11.27 | 1124 | 1052 | 261.4 |
| A | 7 | 110 | 3897 | 10.88 | 1124 | 1052 | 261.4 |
| A | 9 | 19 | 3091 | 7.8 | 1124 | 1052 | 261.4 |
| B | 2 | 9 | 10928 | 11.8 | 3617 | 3438 | 634.7 |
| B | 5 | 128 | 9001 | 8.76 | 3617 | 3438 | 634.7 |
| B | 14 | 254 | 8970 | 8.72 | 3617 | 3438 | 634.7 |
| C | 12 | 241 | 8911 | 6.98 | 3428 | 3172 | 822.4 |
| C | 2 | 127 | 8623 | 6.63 | 3428 | 3172 | 822.4 |
| C | 9 | 242 | 8480 | 6.45 | 3428 | 3172 | 822.4 |
| D | 1 | 19 | 7653 | 6.98 | 3002 | 2750 | 702.6 |
| D | 6 | 44 | 7592 | 6.89 | 3002 | 2750 | 702.6 |
| D | 11 | 82 | 7548 | 6.83 | 3002 | 2750 | 702.6 |
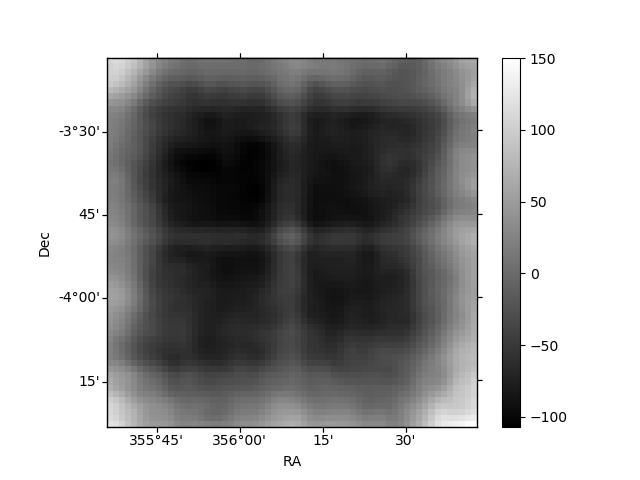
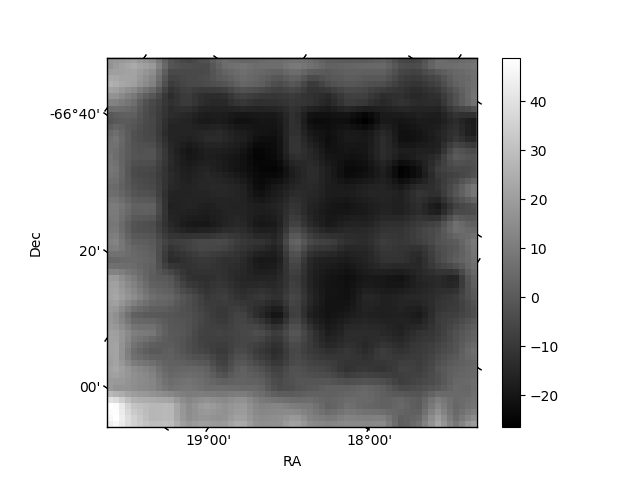
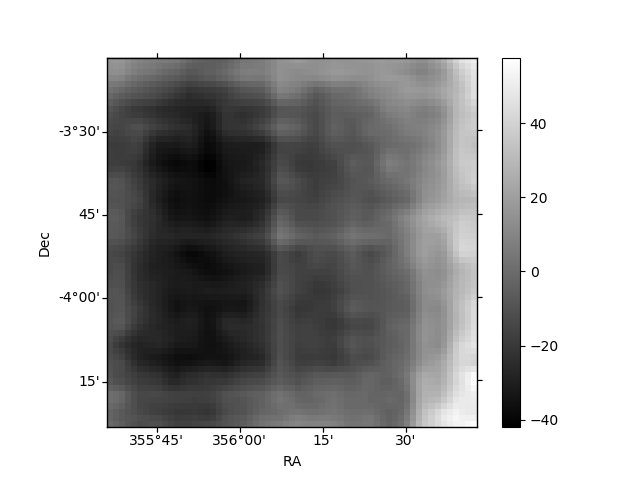
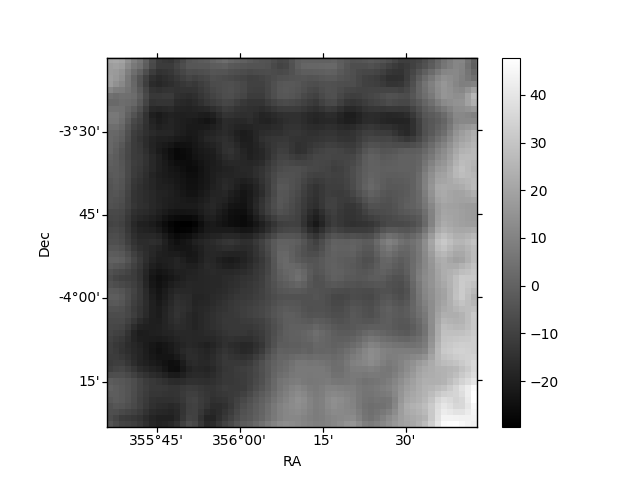
Histogram calculated using DETX and DETY for each event in the final _common_clean file
| Quadrant A | 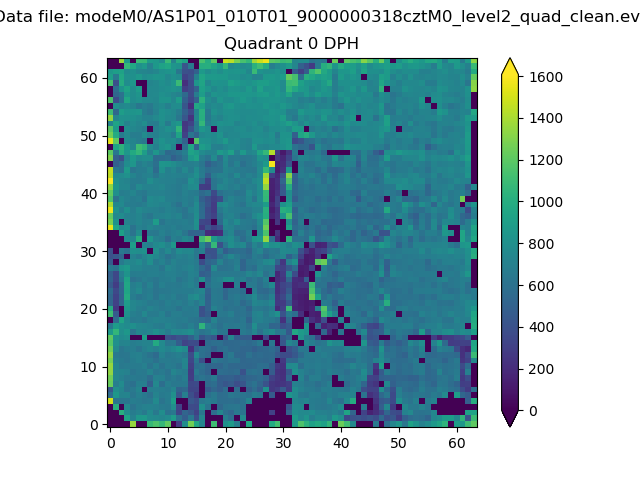 |
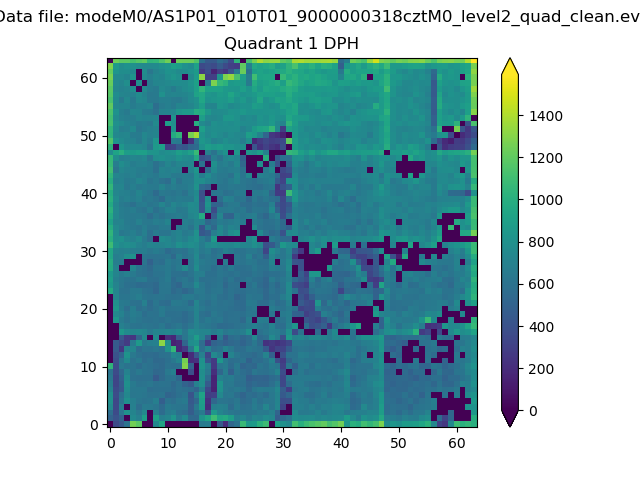 |
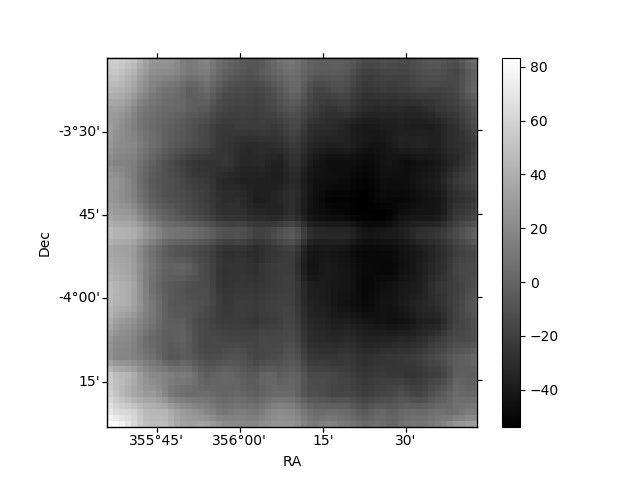
Quadrant B |
|---|---|---|---|
| Quadrant D | 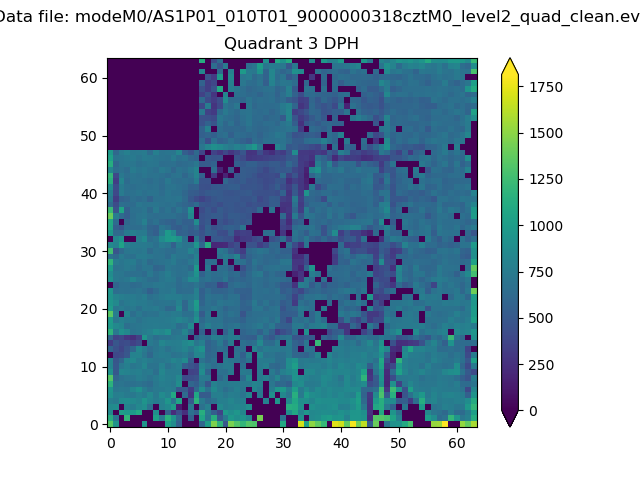 |
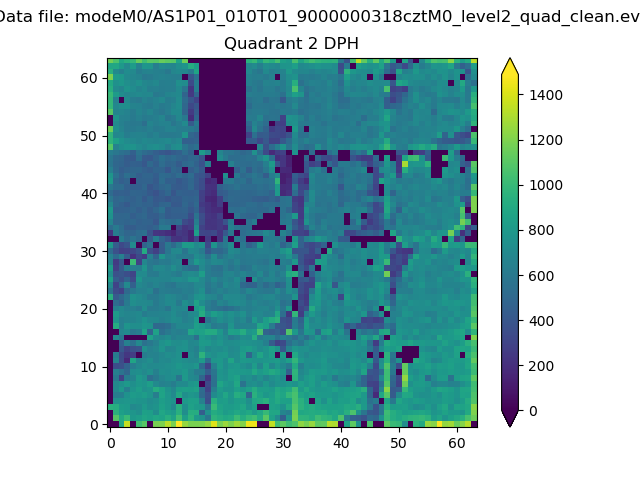 |
Quadrant C |
| Plot type | Count rate plots | Images |
|---|---|---|
| Comparison with Poisson distribution Blue bars denote a histogram of data divided into 1 sec bins. Red curve is a Poisson curve with rate = median count rate of data. |
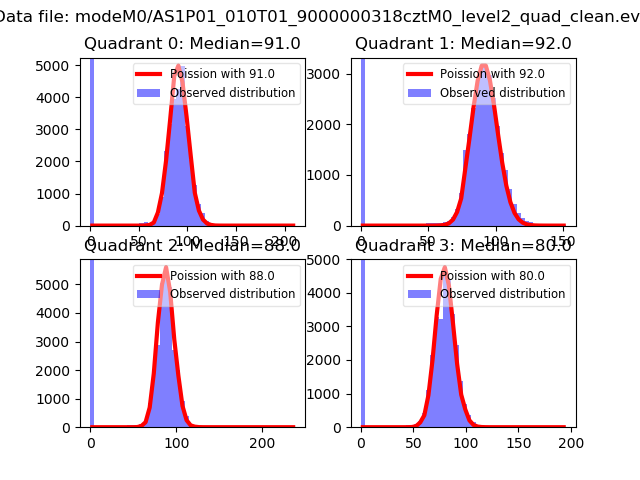 |
 |
| Quadrant-wise count rates Data is divided into 100 sec bins |
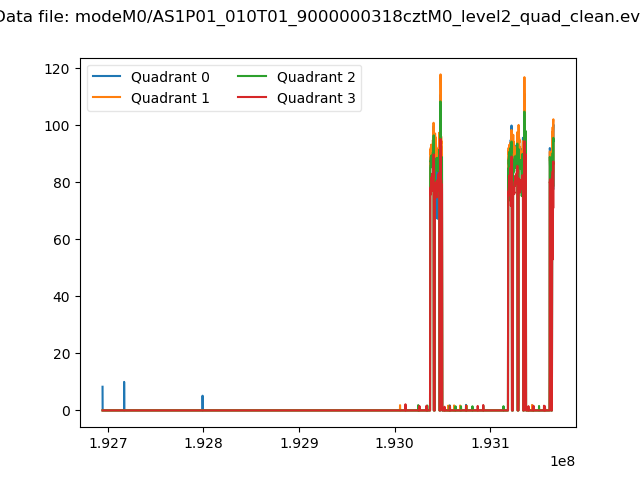 |
|
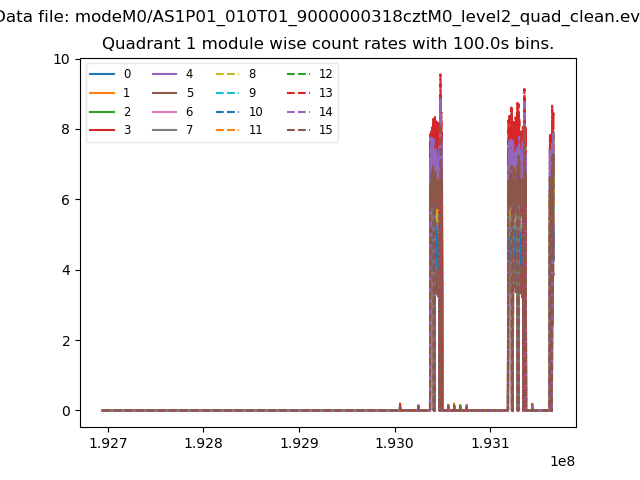
| Module-wise count rates for Quadrant A Data is divided into 100 sec bins |
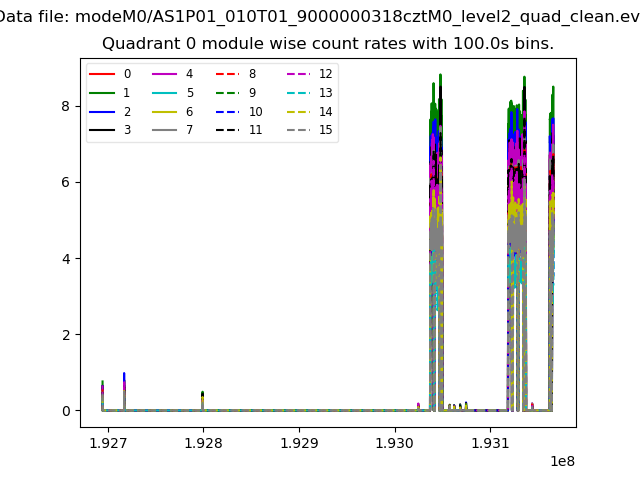 |
 |
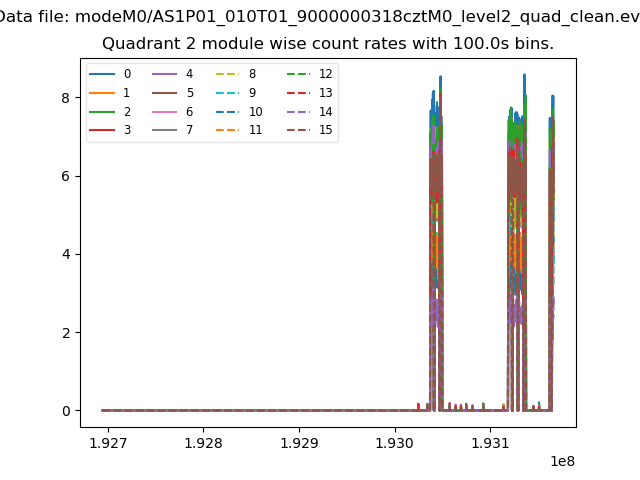
| Module-wise count rates for Quadrant B Data is divided into 100 sec bins |
 |
 |
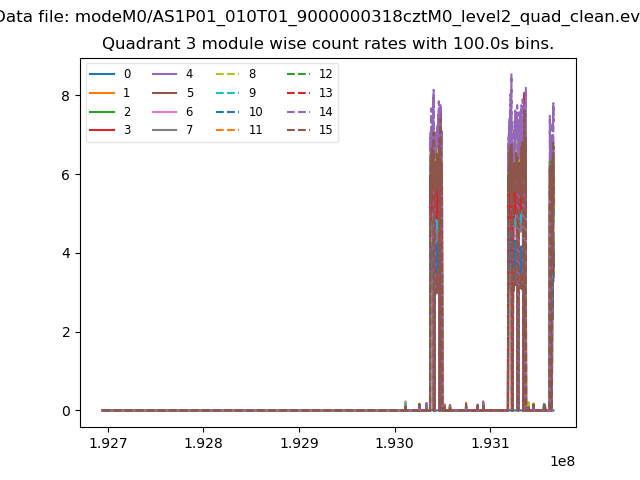
| Module-wise count rates for Quadrant C Data is divided into 100 sec bins |
 |
 |
| Module-wise count rates for Quadrant D Data is divided into 100 sec bins |
 |
 |
| Parameter | Plot |
|---|---|
| CZT HV Monitor | 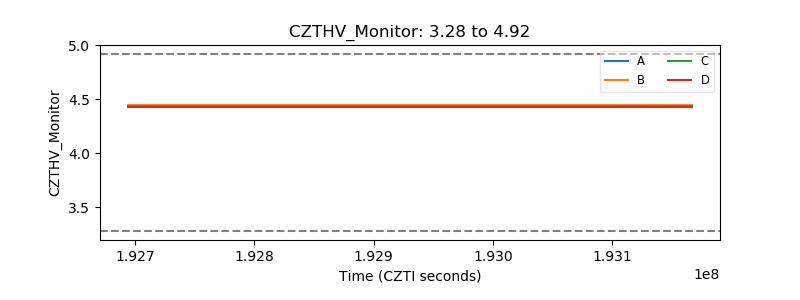 |
| D_VDD | 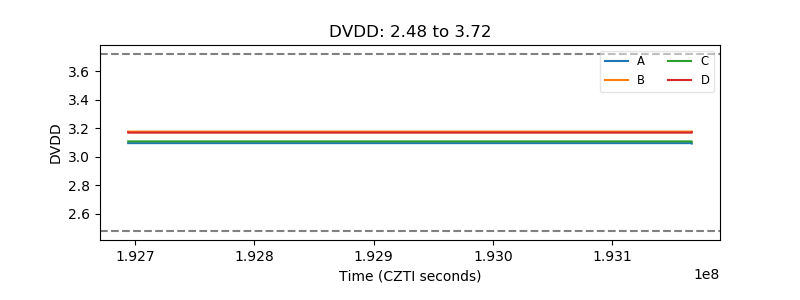 |
| Temperature 1 | 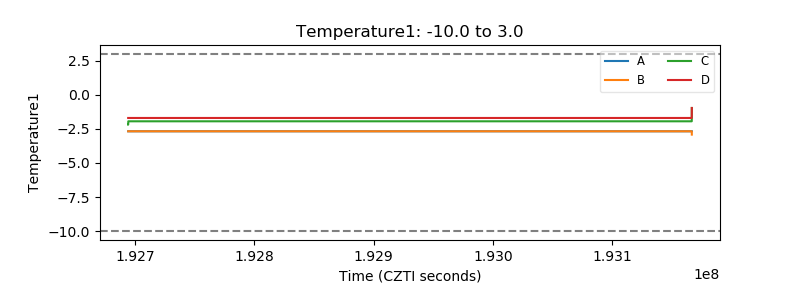 |
| Veto HV Monitor | 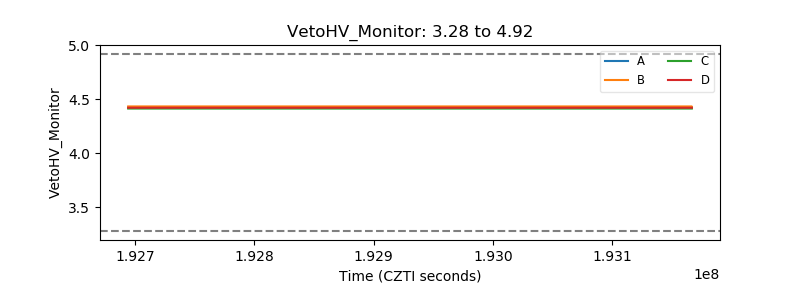 |
| Veto LLD | 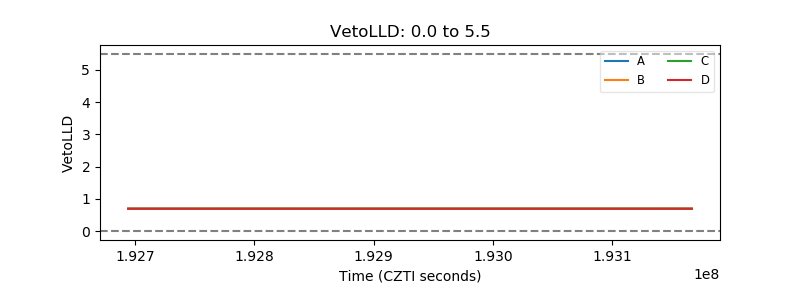 |
| Alpha Counter | 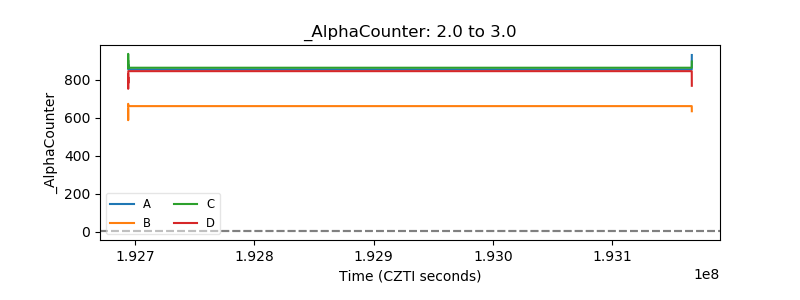 |
| _CPM_Rate | 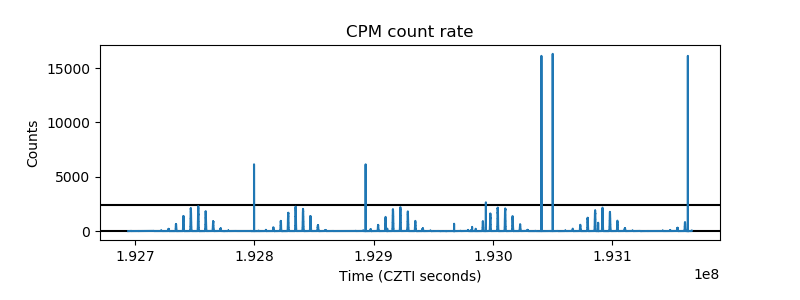 |
| CZT Counter | 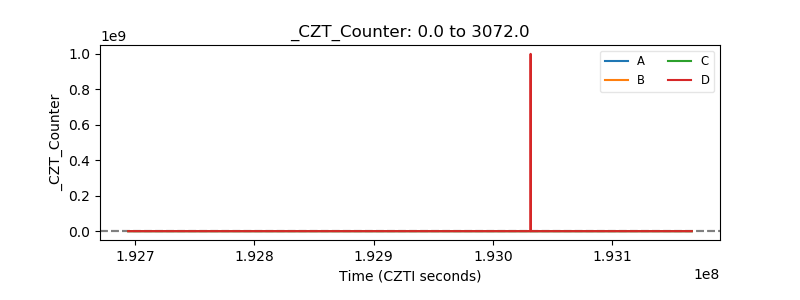 |
| +2.5 Volts monitor | 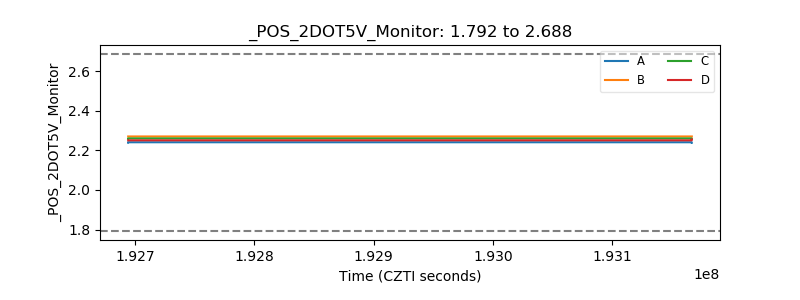 |
| +5 Volts monitor | 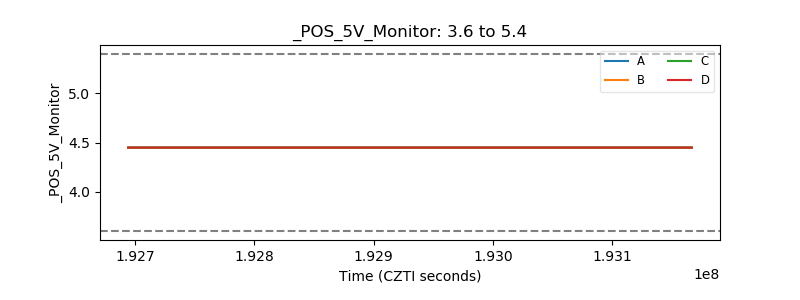 |
| _ROLL_ROT | 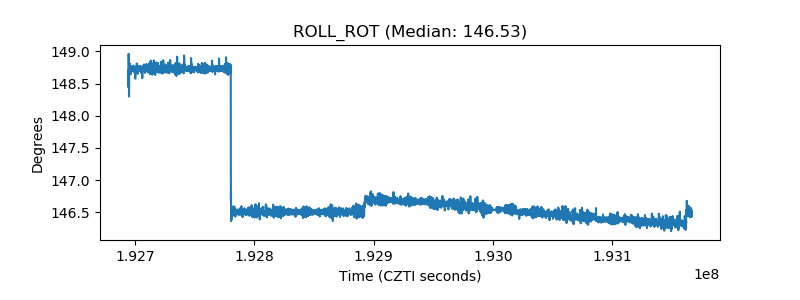 |
| _Roll_DEC | 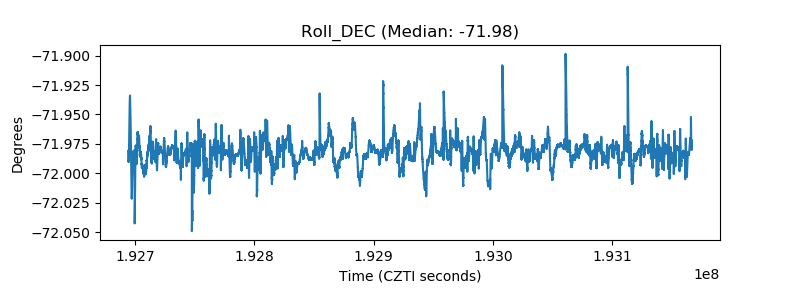 |
| _Roll_RA | 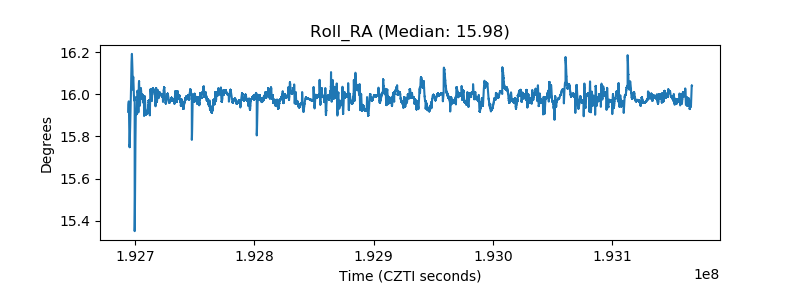 |
| Veto Counter | 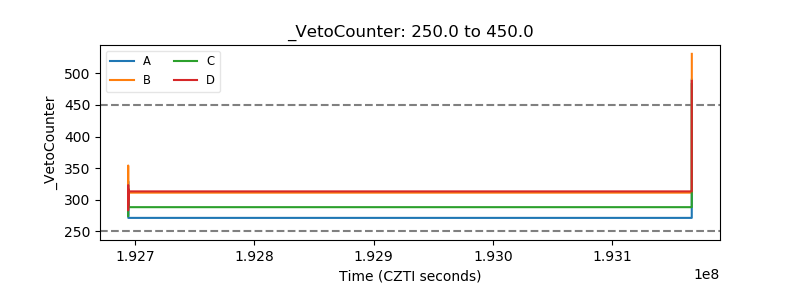 |