| Param | Original file | Final file |
|---|---|---|
| Filename | modeM0/AS1P01_010T01_9000000318_02039cztM0_level2.evt | modeM0/AS1P01_010T01_9000000318_02039cztM0_level2_quad_clean.evt |
| Size (bytes) | 116,697,600 | 8,616,960 |
| Size | 111.3 MB | 8.2 MB |
| Events in quadrant A | 979,488 | 90,651 |
| Events in quadrant B | 987,873 | 43,263 |
| Events in quadrant C | 803,643 | 35,470 |
| Events in quadrant D | 711,110 | 32,216 |
| Mode M9 | |||
|---|---|---|---|
| Quadrant | BADHDUFLAG | Total packets | Discarded packets |
| A | 0 | 1 | 0 |
| B | 1 | 1 | 0 |
| C | 1 | -1 | -1 |
| D | 1 | -1 | -1 |
| Mode M0 | |||
|---|---|---|---|
| Quadrant | BADHDUFLAG | Total packets | Discarded packets |
| A | 0 | 6598 | 3136 |
| B | 0 | 6952 | 3458 |
| C | 0 | 6259 | 3363 |
| D | 0 | 5838 | 3226 |
| Mode SS | |||
|---|---|---|---|
| Quadrant | BADHDUFLAG | Total packets | Discarded packets |
| A | 0 | 25 | 15 |
| B | 0 | 25 | 12 |
| C | 0 | 25 | 17 |
| D | 0 | 25 | 17 |
| Quadrant | Total seconds | Saturated seconds | Saturation percentage |
|---|---|---|---|
| A | 791 | 2 | 0.252845% |
| B | 768 | 2 | 0.260417% |
| C | 715 | 4 | 0.559441% |
| D | 694 | 1 | 0.144092% |
Noise dominated data is calculated using 1-second bins in cleaned event files. If a bin has >2000 counts, and if more than 50% of those come from <1% of pixels, then it is considered to be noise-dominated and hence unusable.
| Quadrant | # 1 sec bins | Bins with >0 counts | Bins with >2000 counts | High rate bins dominated by noise | Noise dominated (total time) | Noise dominated (detector-on time) | Marked lightcurve |
|---|---|---|---|---|---|---|---|
| A | 7254 | 1579 | 1 | 1 | 0.01% | 0.06% | 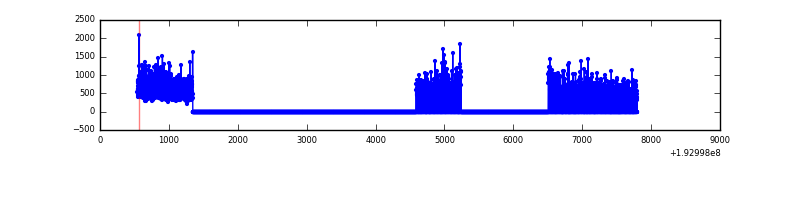 |
| B | 7256 | 1533 | 1 | 1 | 0.01% | 0.07% | 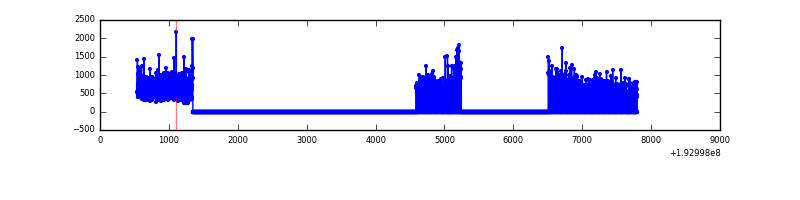 |
| C | 7256 | 1425 | 3 | 3 | 0.04% | 0.21% | 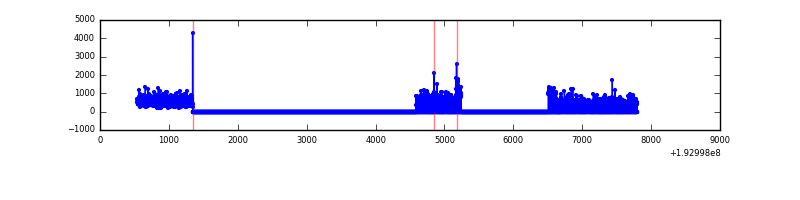 |
| D | 7256 | 1385 | 0 | 0 | 0.00% | 0.00% | 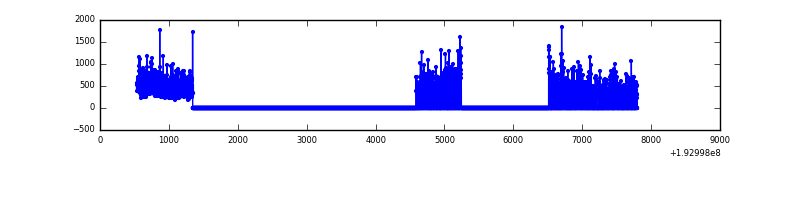 |
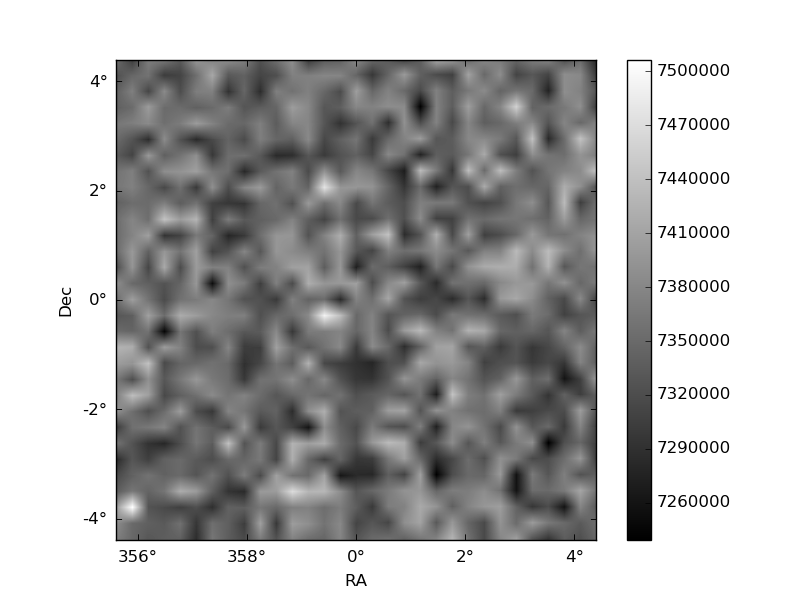
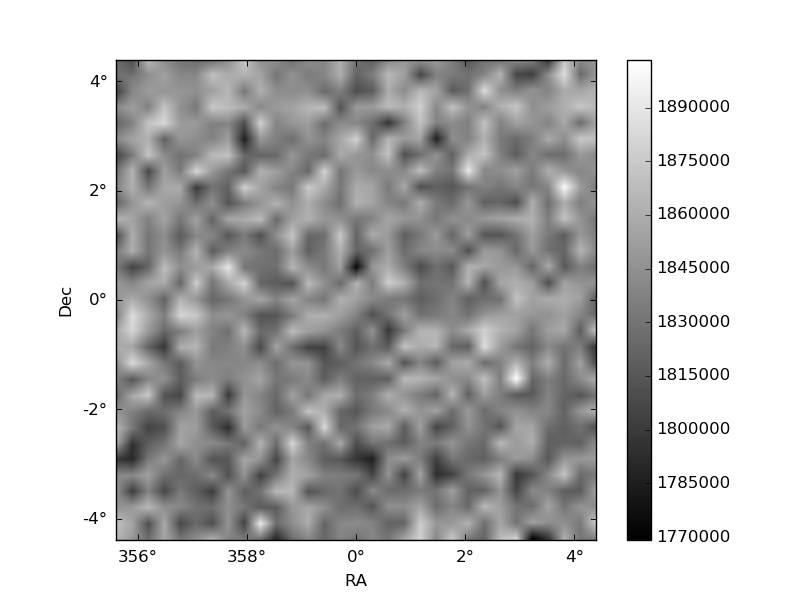
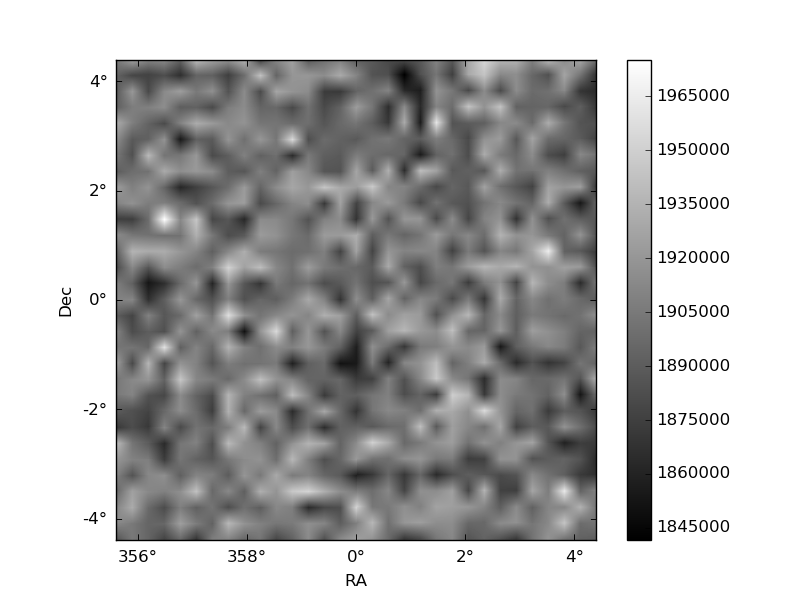
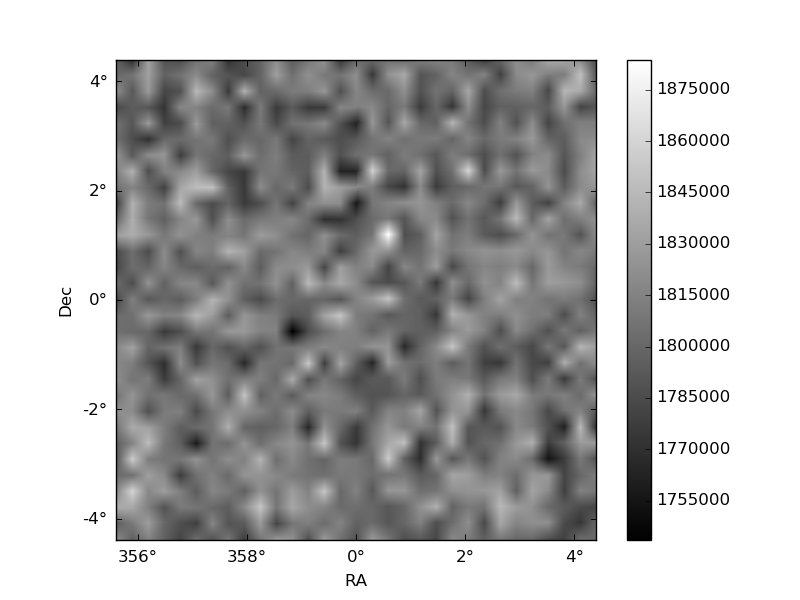
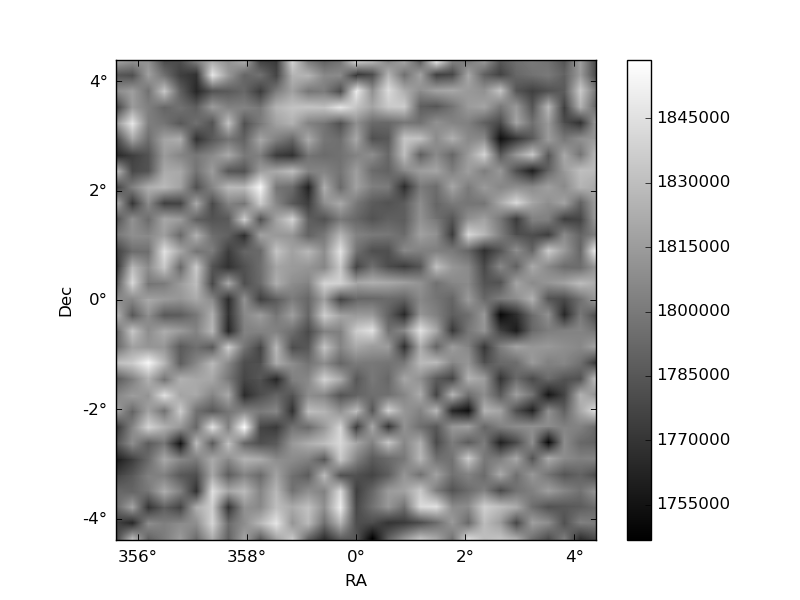
Histogram calculated using DETX and DETY for each event in the final _common_clean file
| Quadrant A | 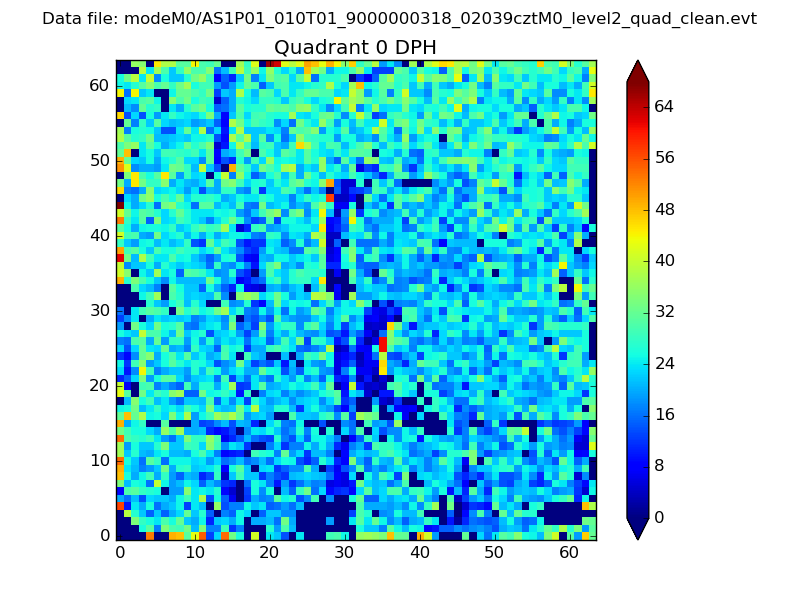 |
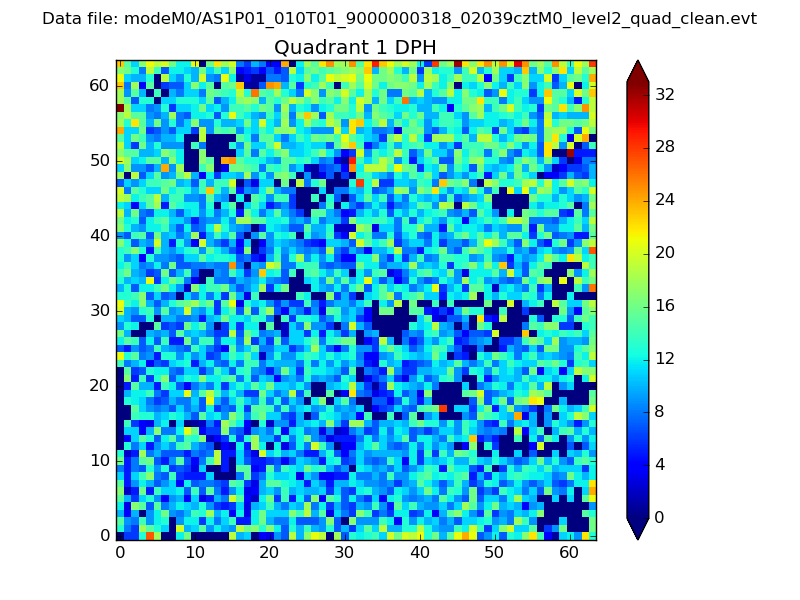 |
Quadrant B |
|---|---|---|---|
| Quadrant D | 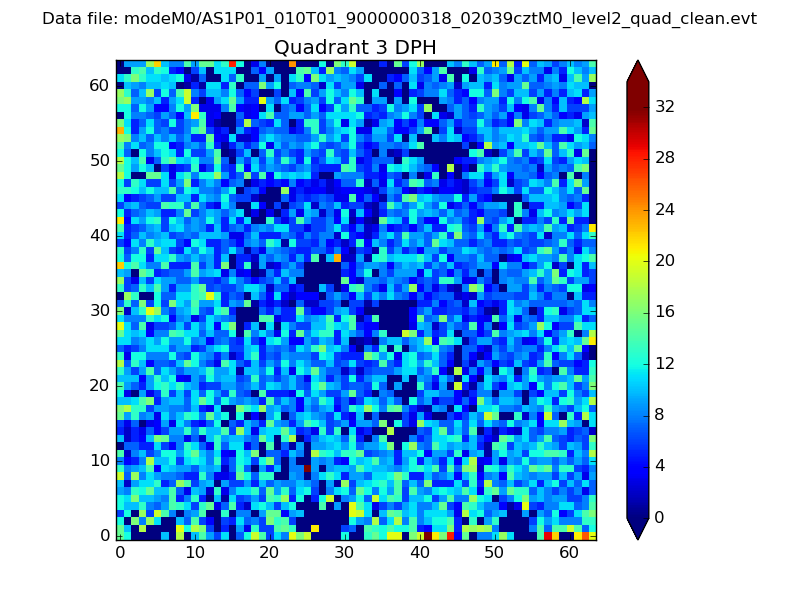 |
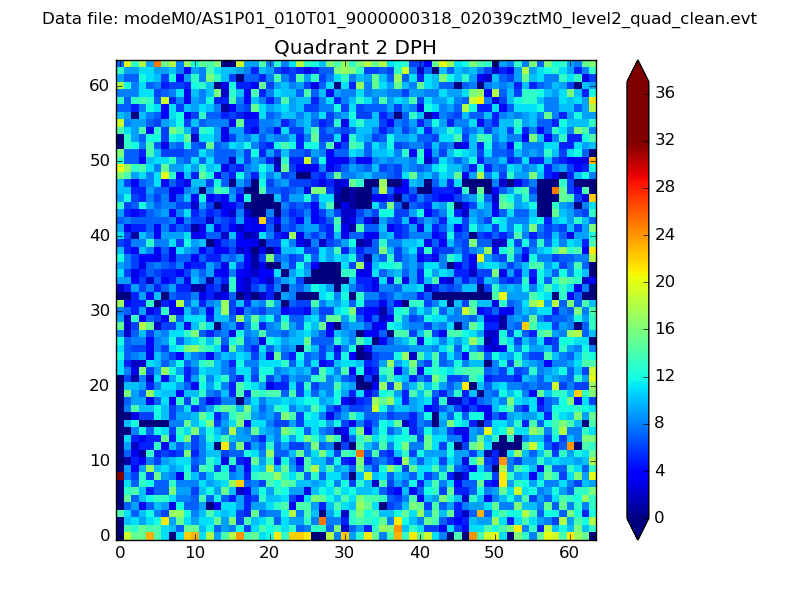 |
Quadrant C |
| Plot type | Count rate plots | Images |
|---|---|---|
| Comparison with Poisson distribution Blue bars denote a histogram of data divided into 1 sec bins. Red curve is a Poisson curve with rate = median count rate of data. |
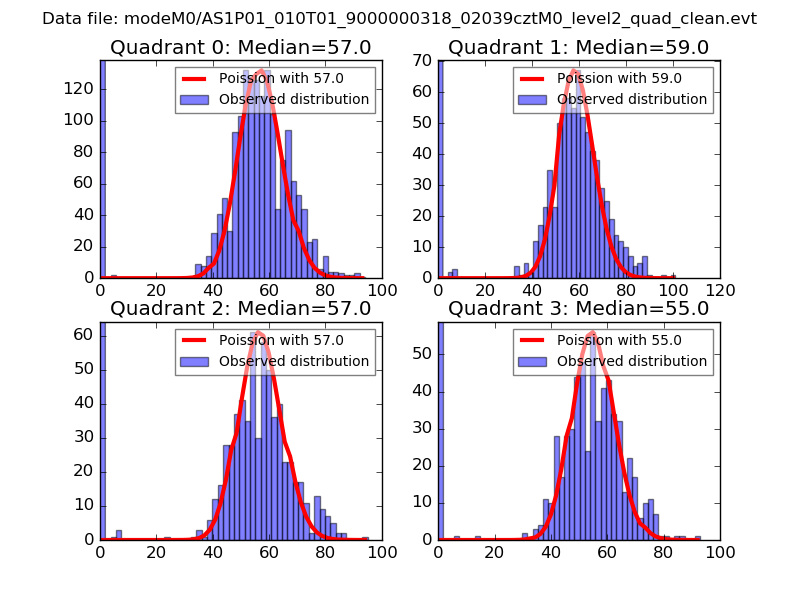 |
 |
| Quadrant-wise count rates Data is divided into 100 sec bins |
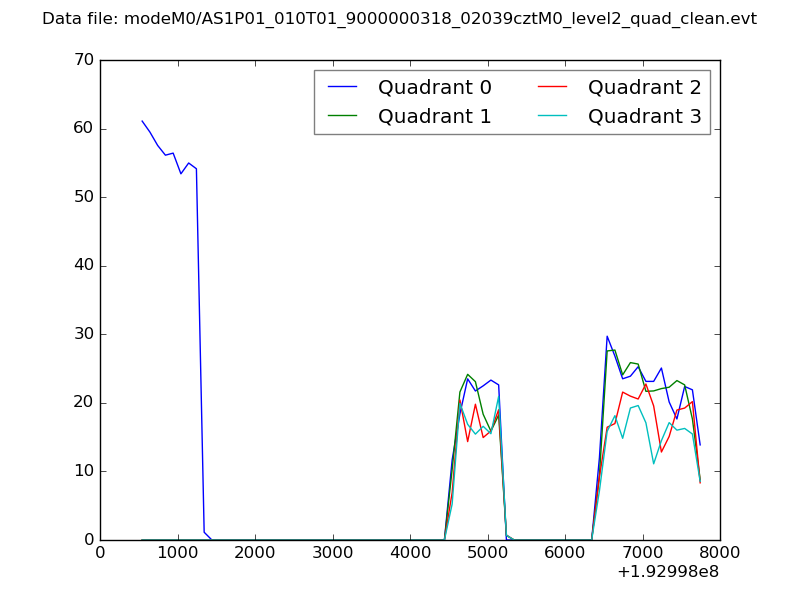 |
|
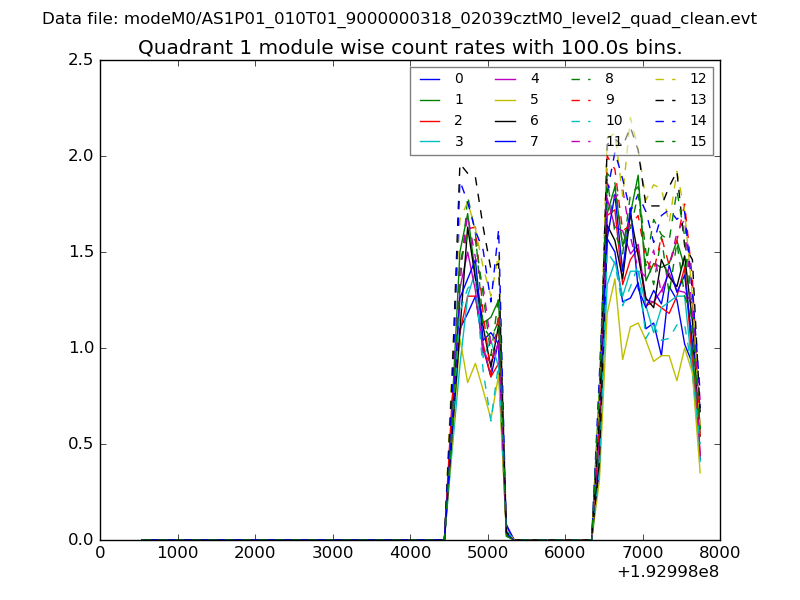
| Module-wise count rates for Quadrant A Data is divided into 100 sec bins |
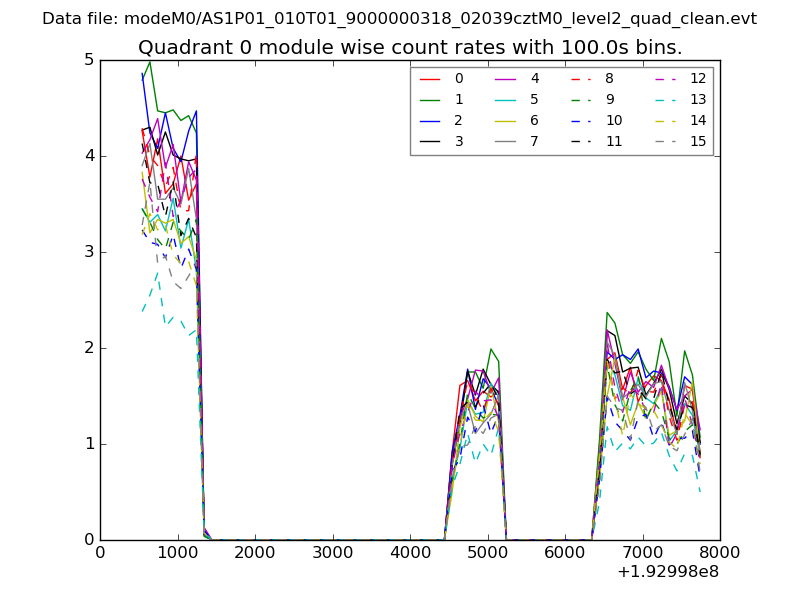 |
 |
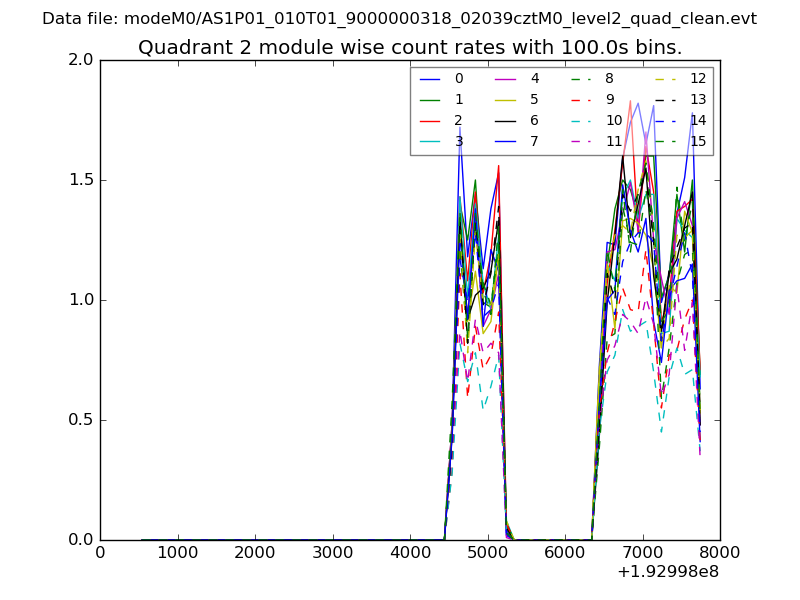
| Module-wise count rates for Quadrant B Data is divided into 100 sec bins |
 |
 |
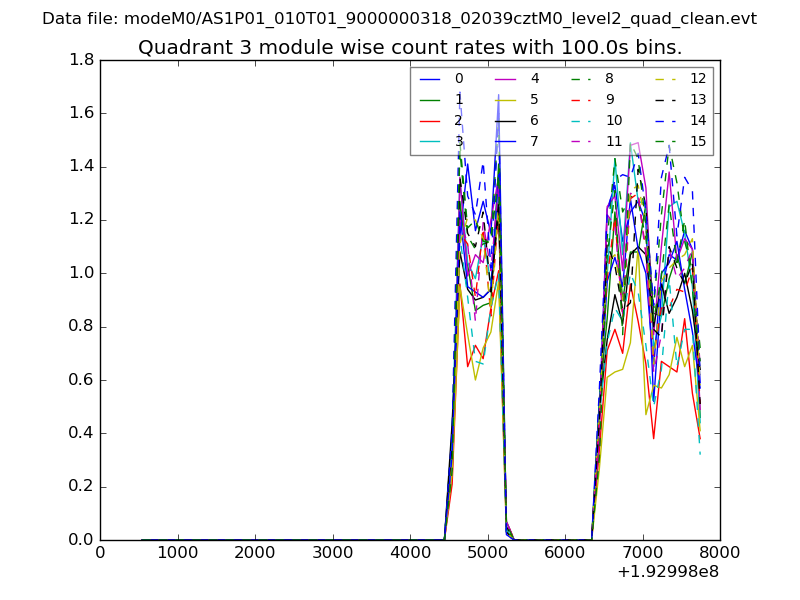
| Module-wise count rates for Quadrant C Data is divided into 100 sec bins |
 |
 |
| Module-wise count rates for Quadrant D Data is divided into 100 sec bins |
 |
 |
| Parameter | Plot |
|---|---|
| CZT HV Monitor | 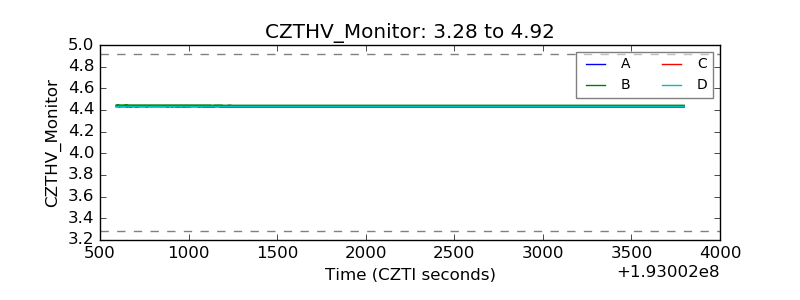 |
| D_VDD | 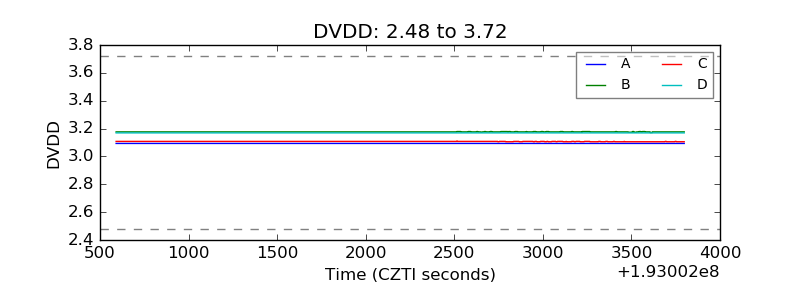 |
| Temperature 1 | 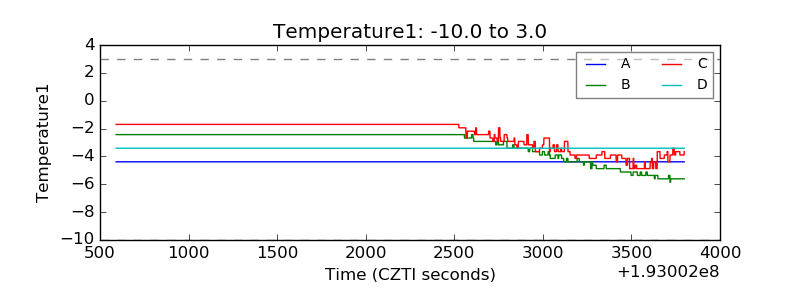 |
| Veto HV Monitor | 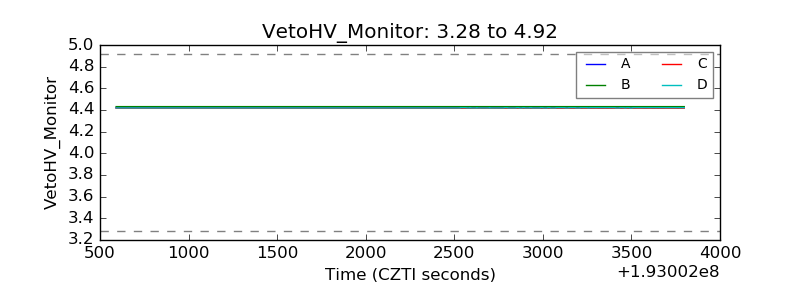 |
| Veto LLD | 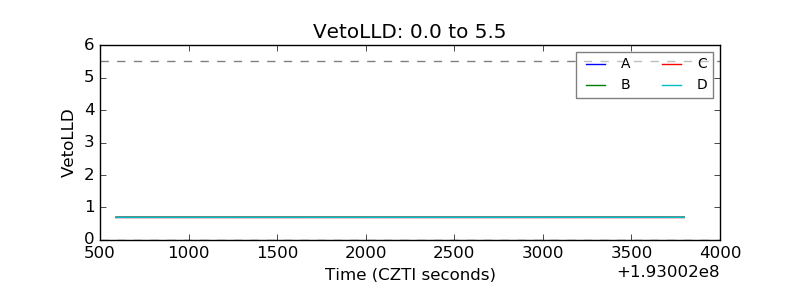 |
| Alpha Counter | 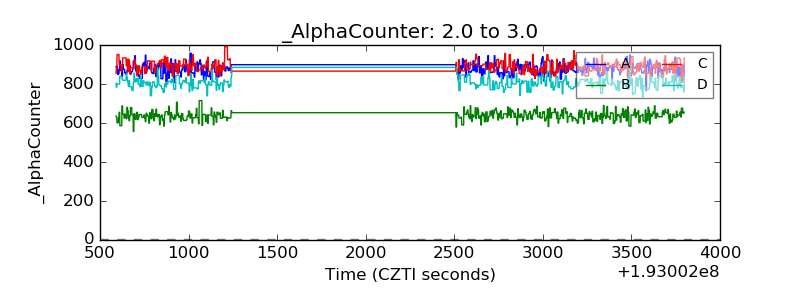 |
| _CPM_Rate | 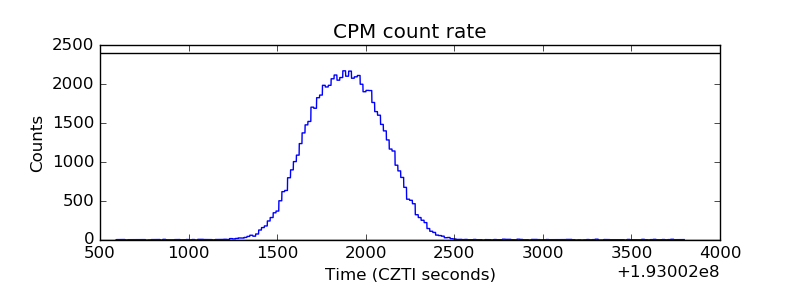 |
| CZT Counter | 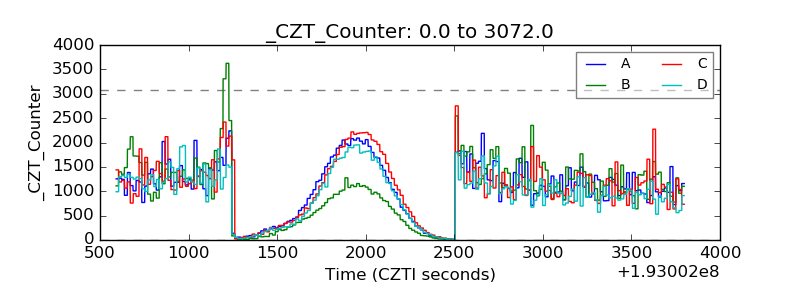 |
| +2.5 Volts monitor | 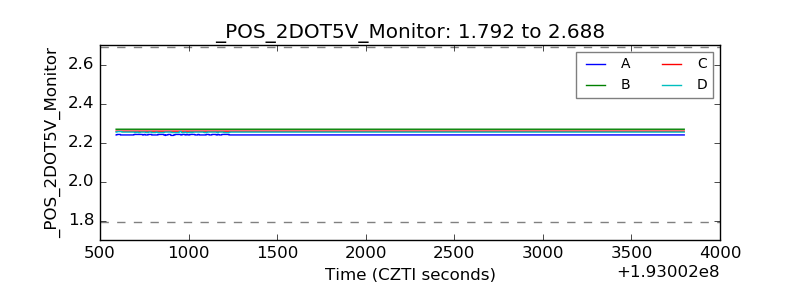 |
| +5 Volts monitor |  |
| _ROLL_ROT | 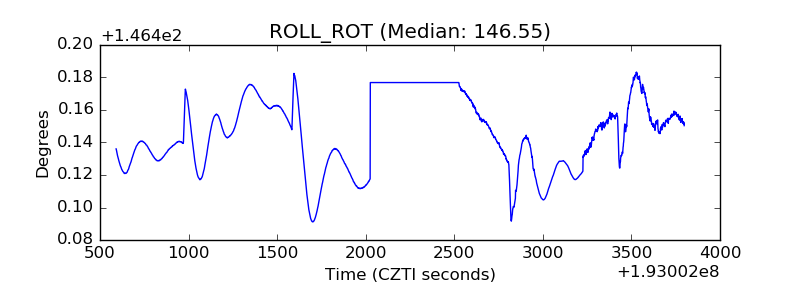 |
| _Roll_DEC | 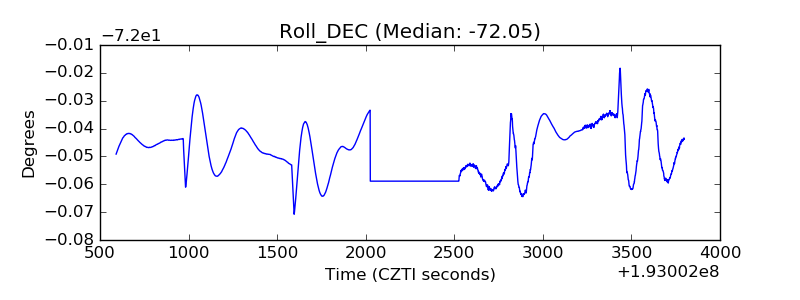 |
| _Roll_RA | 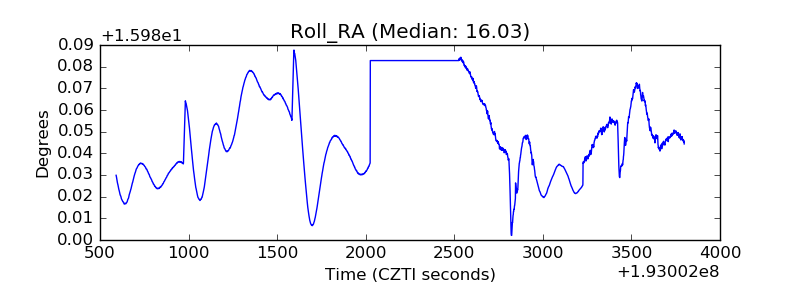 |
| Veto Counter | 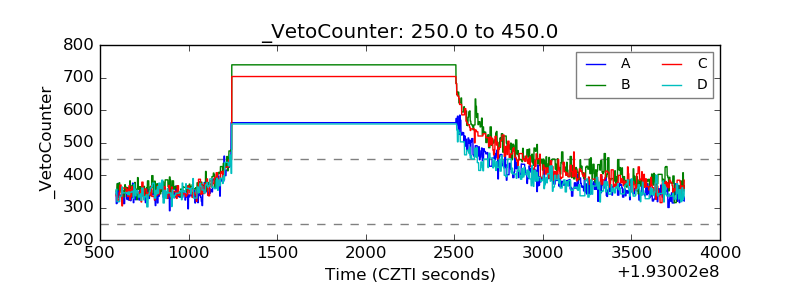 |