| Param | Original file | Final file |
|---|---|---|
| Filename | modeM0/AS1P01_161T03_9000000320cztM0_level2.fits | modeM0/AS1P01_161T03_9000000320cztM0_level2_quad_clean.evt |
| Size (bytes) | 160,534,080 | 73,998,720 |
| Size | 153.1 MB | 70.6 MB |
| Events in quadrant A | 925,938 | 255,435 |
| Events in quadrant B | 934,206 | 262,047 |
| Events in quadrant C | 931,704 | 250,307 |
| Events in quadrant D | 801,928 | 226,944 |
| Mode SS | |||
|---|---|---|---|
| Quadrant | BADHDUFLAG | Total packets | Discarded packets |
| A | 0 | 434 | 0 |
| B | 0 | 434 | 0 |
| C | 0 | 436 | 0 |
| D | 0 | 436 | 0 |
| Mode M9 | |||
|---|---|---|---|
| Quadrant | BADHDUFLAG | Total packets | Discarded packets |
| A | 1 | 140543764580392 | 140539919859758 |
| B | 1 | 140543764580392 | 140539919859758 |
| C | 1 | 140543764580392 | 140539919859758 |
| D | 1 | 140543764580392 | 140539919859758 |
| Mode M0 | |||
|---|---|---|---|
| Quadrant | BADHDUFLAG | Total packets | Discarded packets |
| A | 0 | 80175 | 0 |
| B | 0 | 80891 | 0 |
| C | 0 | 74926 | 0 |
| D | 0 | 70977 | 0 |
| Quadrant | Total seconds | Saturated seconds | Saturation percentage |
|---|---|---|---|
| A | 17786 | 146 | 0.820870% |
| B | 17796 | 74 | 0.415824% |
| C | 17805 | 71 | 0.398764% |
| D | 17799 | 59 | 0.331479% |
Noise dominated data is calculated using 1-second bins in cleaned event files. If a bin has >2000 counts, and if more than 50% of those come from <1% of pixels, then it is considered to be noise-dominated and hence unusable.
| Quadrant | # 1 sec bins | Bins with >0 counts | Bins with >2000 counts | High rate bins dominated by noise | Noise dominated (total time) | Noise dominated (detector-on time) | Marked lightcurve |
|---|---|---|---|---|---|---|---|
| A | 42367 | 30289 | 0 | 0 | 0.00% | 0.00% |  |
| B | 42367 | 30304 | 0 | 0 | 0.00% | 0.00% |  |
| C | 42367 | 30330 | 0 | 0 | 0.00% | 0.00% | 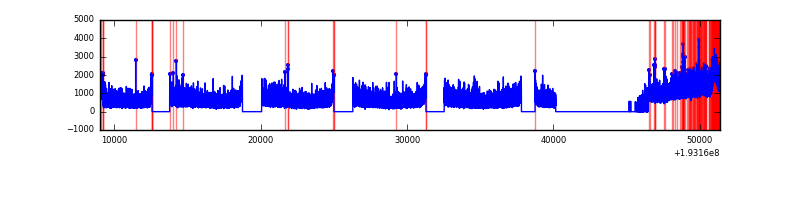 |
| D | 42367 | 30309 | 0 | 0 | 0.00% | 0.00% |  |
Top three noisy pixels from each quadrant. If the there are fewer than three noisy pixels in the level2.evt file, extra rows are filled as -1
| Pixel properties | Quadrant properties | ||||||
|---|---|---|---|---|---|---|---|
| Quadrant | DetID | PixID | Counts | Sigma | Mean | Median | Sigma |
| A | 0 | 29 | 874 | 11.52 | 239 | 226 | 56.2 |
| A | 7 | 110 | 845 | 11.01 | 239 | 226 | 56.2 |
| A | 14 | 188 | 833 | 10.79 | 239 | 226 | 56.2 |
| B | 2 | 9 | 740 | 10.7 | 246 | 234 | 47.3 |
| B | 5 | 128 | 648 | 8.76 | 246 | 234 | 47.3 |
| B | 10 | 225 | 607 | 7.89 | 246 | 234 | 47.3 |
| C | 2 | 191 | 648 | 6.81 | 245 | 228 | 61.7 |
| C | 9 | 242 | 646 | 6.78 | 245 | 228 | 61.7 |
| C | 1 | 81 | 638 | 6.65 | 245 | 228 | 61.7 |
| D | 11 | 82 | 587 | 6.71 | 228 | 209 | 56.3 |
| D | 6 | 44 | 573 | 6.46 | 228 | 209 | 56.3 |
| D | 6 | 231 | 557 | 6.18 | 228 | 209 | 56.3 |
Histogram calculated using DETX and DETY for each event in the final _common_clean file
| Quadrant A |  |
 |
Quadrant B |
|---|---|---|---|
| Quadrant D |  |
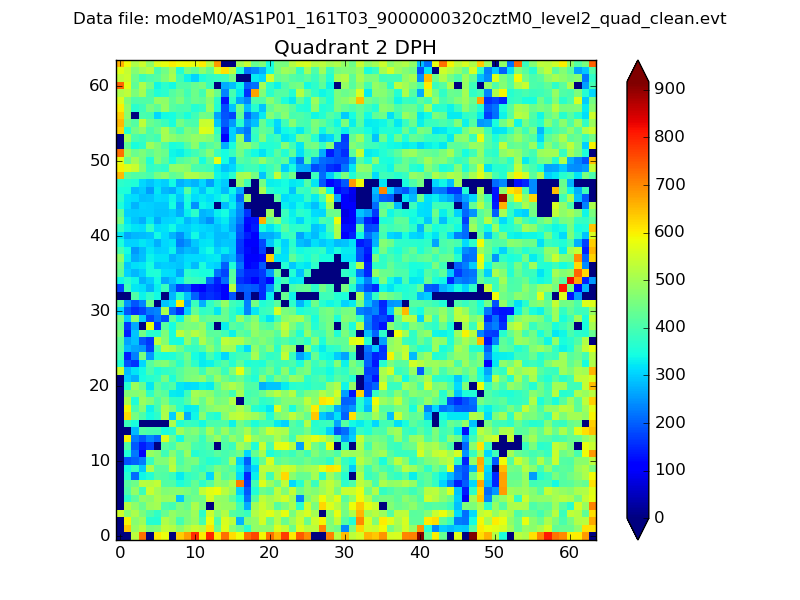 |
Quadrant C |
| Plot type | Count rate plots | Images |
|---|---|---|
| Comparison with Poisson distribution Blue bars denote a histogram of data divided into 1 sec bins. Red curve is a Poisson curve with rate = median count rate of data. |
 |
 |
| Quadrant-wise count rates Data is divided into 100 sec bins |
 |
|
| Module-wise count rates for Quadrant A Data is divided into 100 sec bins |
 |
 |
| Module-wise count rates for Quadrant B Data is divided into 100 sec bins |
 |
 |
| Module-wise count rates for Quadrant C Data is divided into 100 sec bins |
 |
 |
| Module-wise count rates for Quadrant D Data is divided into 100 sec bins |
 |
 |
| Parameter | Plot |
|---|---|
| CZT HV Monitor |  |
| D_VDD |  |
| Temperature 1 |  |
| Veto HV Monitor |  |
| Veto LLD |  |
| Alpha Counter |  |
| _CPM_Rate | 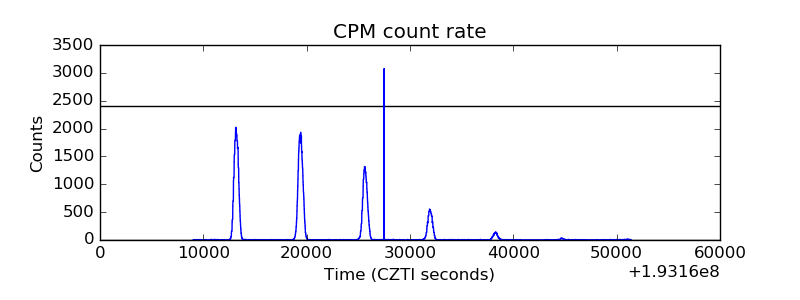 |
| CZT Counter |  |
| +2.5 Volts monitor |  |
| +5 Volts monitor |  |
| _ROLL_ROT |  |
| _Roll_DEC |  |
| _Roll_RA |  |
| Veto Counter |  |