| Param | Original file | Final file |
|---|---|---|
| Filename | modeM0/AS1P01_161T03_9000000320_02078cztM0_level2.evt | modeM0/AS1P01_161T03_9000000320_02078cztM0_level2_quad_clean.evt |
| Size (bytes) | 485,216,640 | 17,867,520 |
| Size | 462.7 MB | 17.0 MB |
| Events in quadrant A | 3,980,145 | 89,400 |
| Events in quadrant B | 3,740,633 | 96,397 |
| Events in quadrant C | 3,496,944 | 95,272 |
| Events in quadrant D | 3,320,158 | 89,282 |
| Mode SS | |||
|---|---|---|---|
| Quadrant | BADHDUFLAG | Total packets | Discarded packets |
| A | 0 | 48 | 0 |
| B | 0 | 48 | 0 |
| C | 0 | 48 | 0 |
| D | 0 | 48 | 0 |
| Mode M0 | |||
|---|---|---|---|
| Quadrant | BADHDUFLAG | Total packets | Discarded packets |
| A | 0 | 13490 | 0 |
| B | 0 | 12770 | 0 |
| C | 0 | 12053 | 0 |
| D | 0 | 11553 | 0 |
| Quadrant | Total seconds | Saturated seconds | Saturation percentage |
|---|---|---|---|
| A | 2355 | 31 | 1.316348% |
| B | 2355 | 7 | 0.297240% |
| C | 2355 | 12 | 0.509554% |
| D | 2355 | 5 | 0.212314% |
Noise dominated data is calculated using 1-second bins in cleaned event files. If a bin has >2000 counts, and if more than 50% of those come from <1% of pixels, then it is considered to be noise-dominated and hence unusable.
| Quadrant | # 1 sec bins | Bins with >0 counts | Bins with >2000 counts | High rate bins dominated by noise | Noise dominated (total time) | Noise dominated (detector-on time) | Marked lightcurve |
|---|---|---|---|---|---|---|---|
| A | 2355 | 2355 | 589 | 589 | 25.01% | 25.01% | 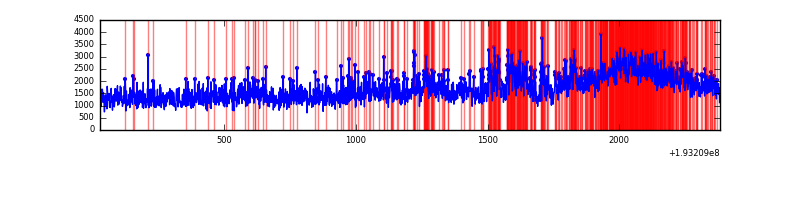 |
| B | 2355 | 2355 | 415 | 415 | 17.62% | 17.62% | 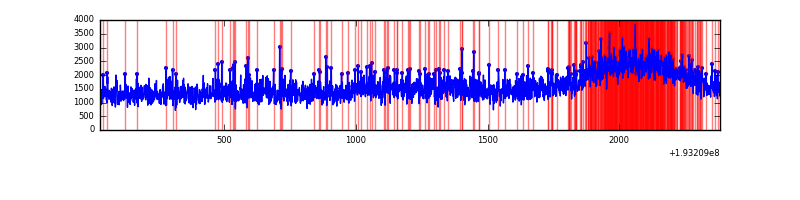 |
| C | 2355 | 2355 | 307 | 307 | 13.04% | 13.04% | 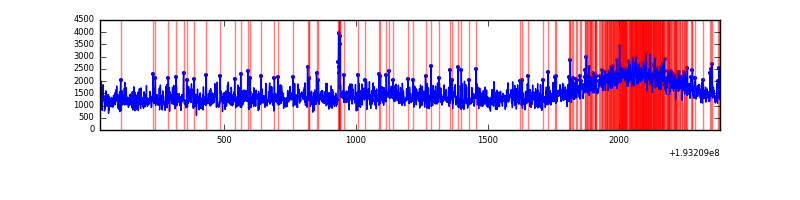 |
| D | 2355 | 2355 | 210 | 210 | 8.92% | 8.92% | 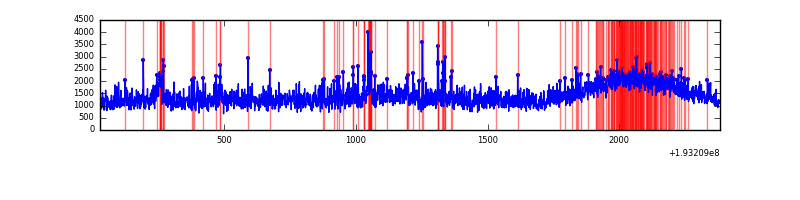 |
Top three noisy pixels from each quadrant. If the there are fewer than three noisy pixels in the level2.evt file, extra rows are filled as -1
| Pixel properties | Quadrant properties | ||||||
|---|---|---|---|---|---|---|---|
| Quadrant | DetID | PixID | Counts | Sigma | Mean | Median | Sigma |
| A | 0 | 199 | 489933 | 2158.19 | 912 | 918 | 226.6 |
| A | 10 | 2 | 2512 | 7.03 | 912 | 918 | 226.6 |
| A | 14 | 186 | 2099 | 5.21 | 912 | 918 | 226.6 |
| B | 0 | 198 | 42973 | 183.22 | 957 | 964 | 229.3 |
| B | 4 | 48 | 30739 | 129.86 | 957 | 964 | 229.3 |
| B | 5 | 68 | 25498 | 107.0 | 957 | 964 | 229.3 |
| C | 14 | 223 | 19398 | 73.12 | 889 | 925 | 252.6 |
| C | 10 | 65 | 6960 | 23.89 | 889 | 925 | 252.6 |
| C | -1 | -1 | -1 | -1.0 | 889 | 925 | 252.6 |
| D | 2 | 32 | 76416 | 279.19 | 854 | 884 | 270.5 |
| D | 13 | 88 | 46356 | 168.08 | 854 | 884 | 270.5 |
| D | 10 | 85 | 5421 | 16.77 | 854 | 884 | 270.5 |
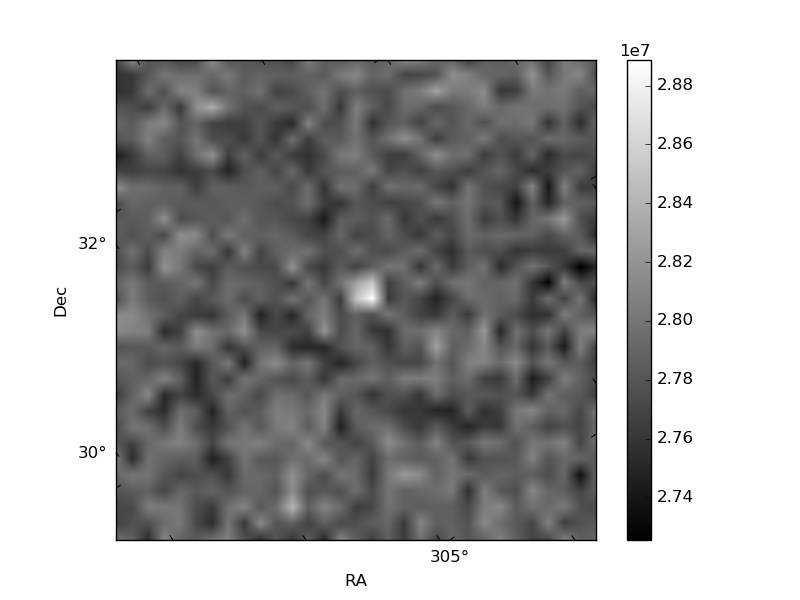
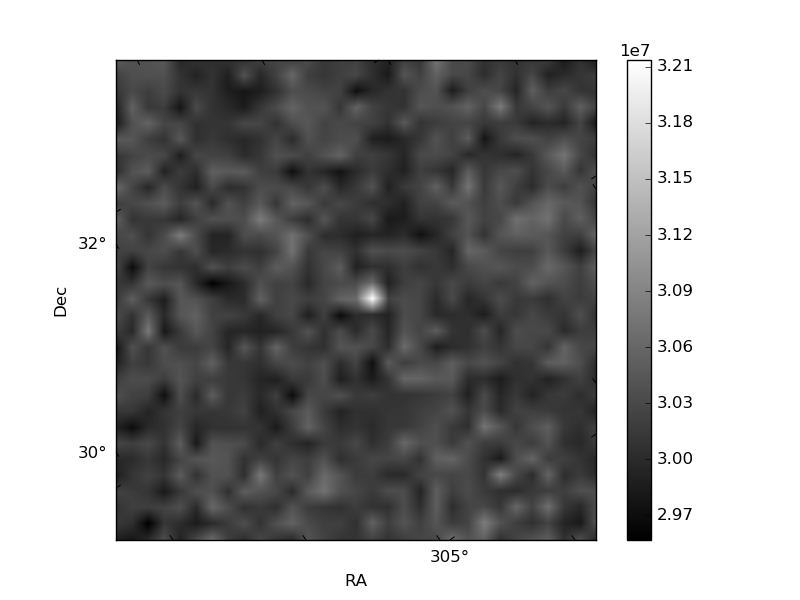
Histogram calculated using DETX and DETY for each event in the final _common_clean file
| Quadrant A | 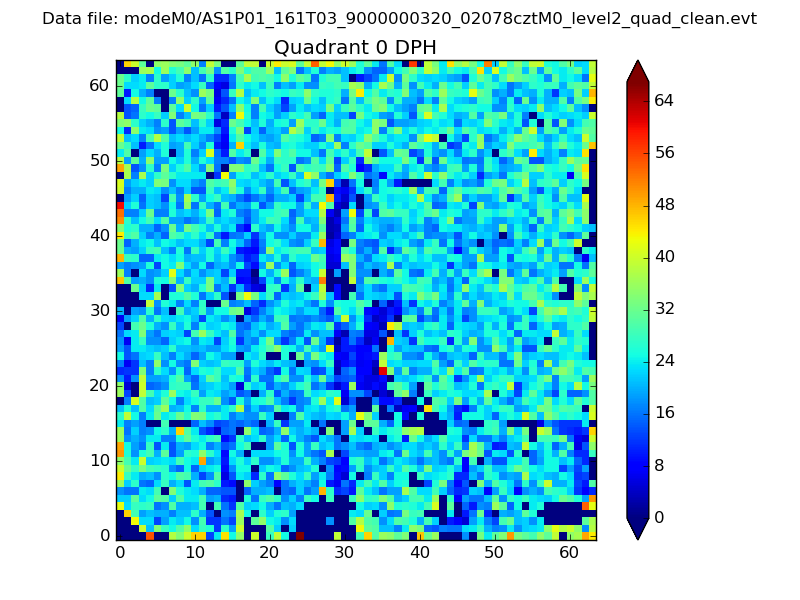 |
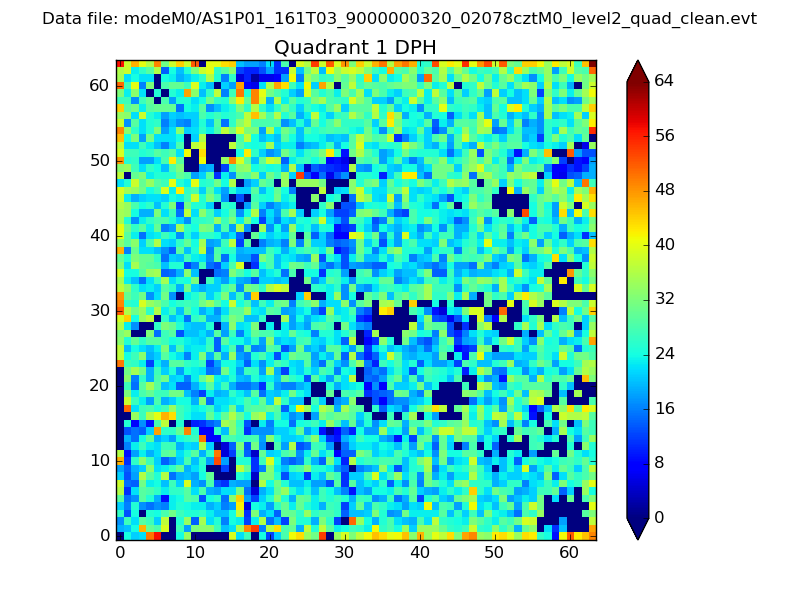 |
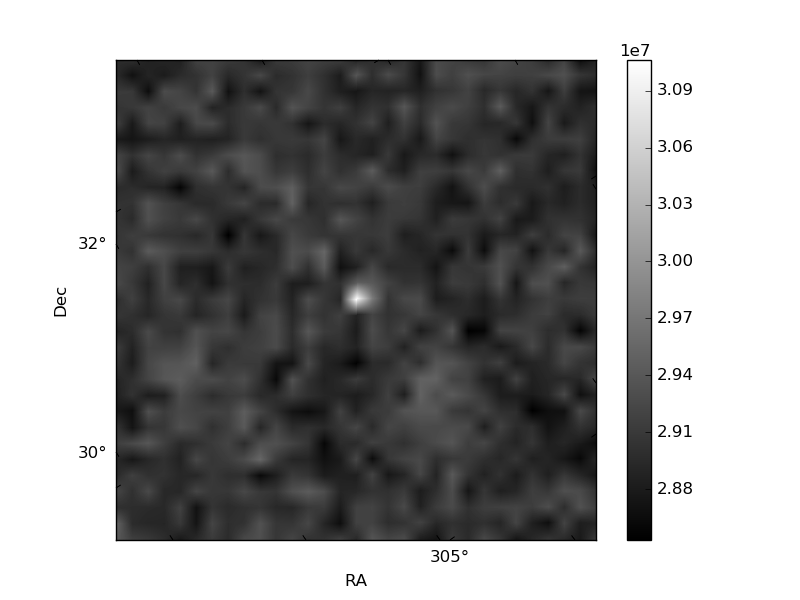
Quadrant B |
|---|---|---|---|
| Quadrant D | 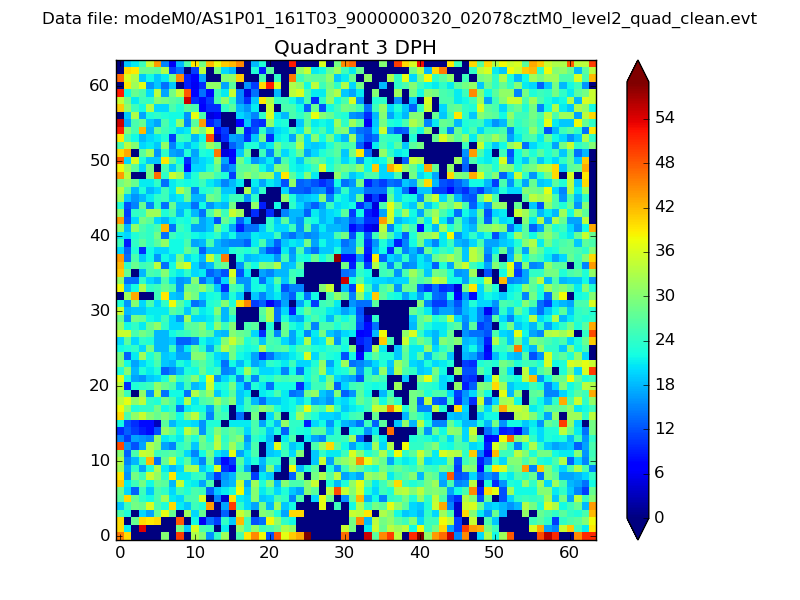 |
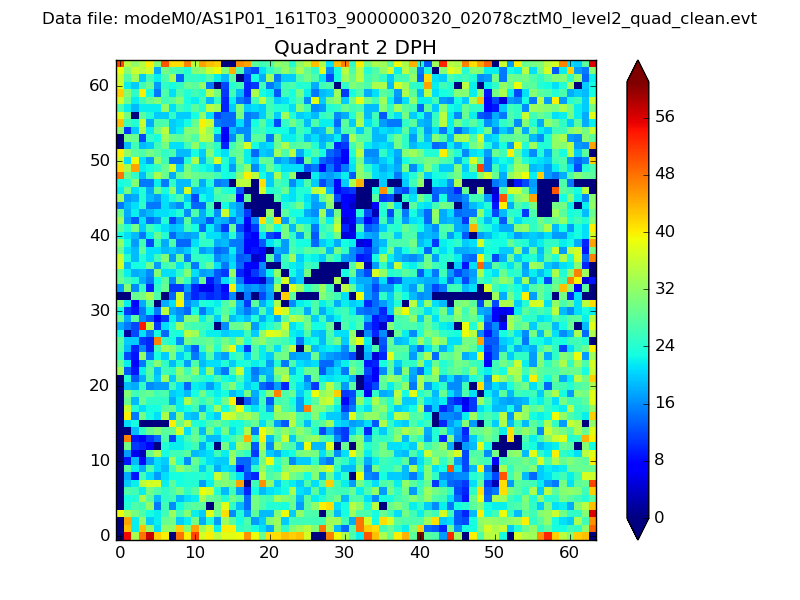 |
Quadrant C |
| Plot type | Count rate plots | Images |
|---|---|---|
| Comparison with Poisson distribution Blue bars denote a histogram of data divided into 1 sec bins. Red curve is a Poisson curve with rate = median count rate of data. |
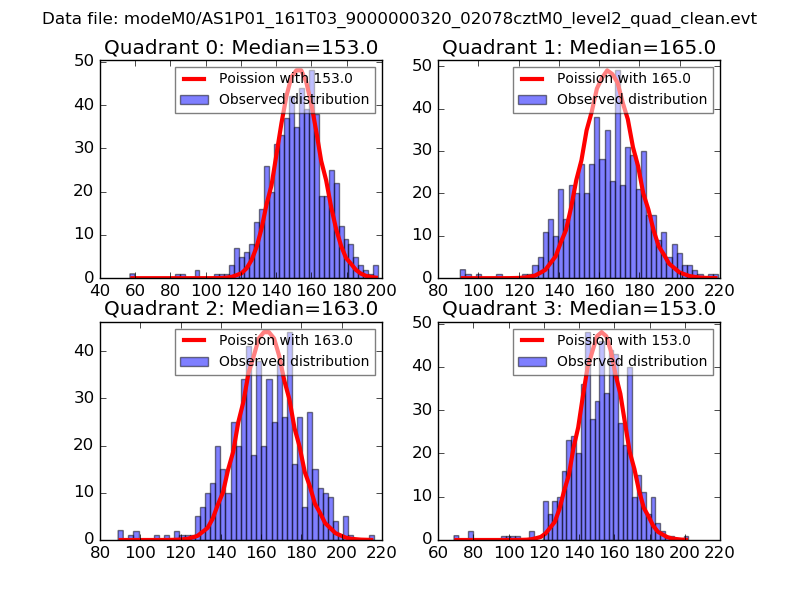 |
 |
| Quadrant-wise count rates Data is divided into 100 sec bins |
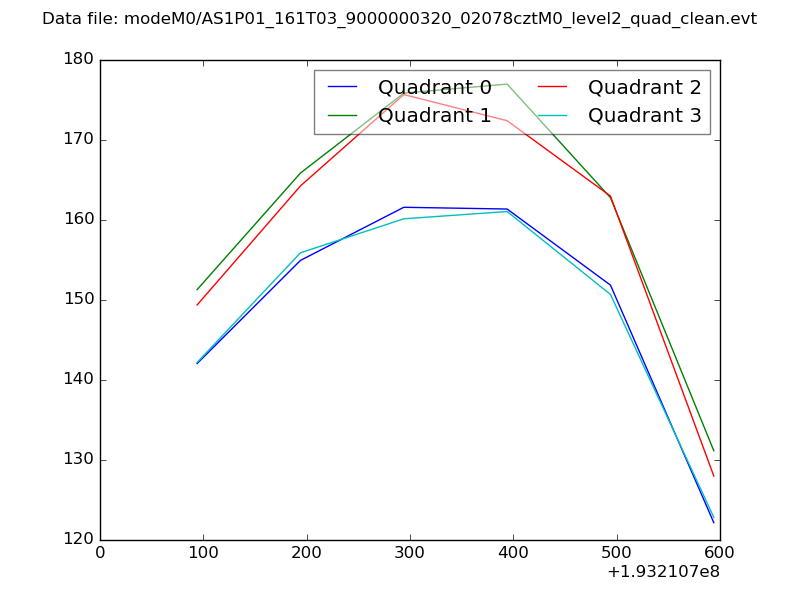 |
|
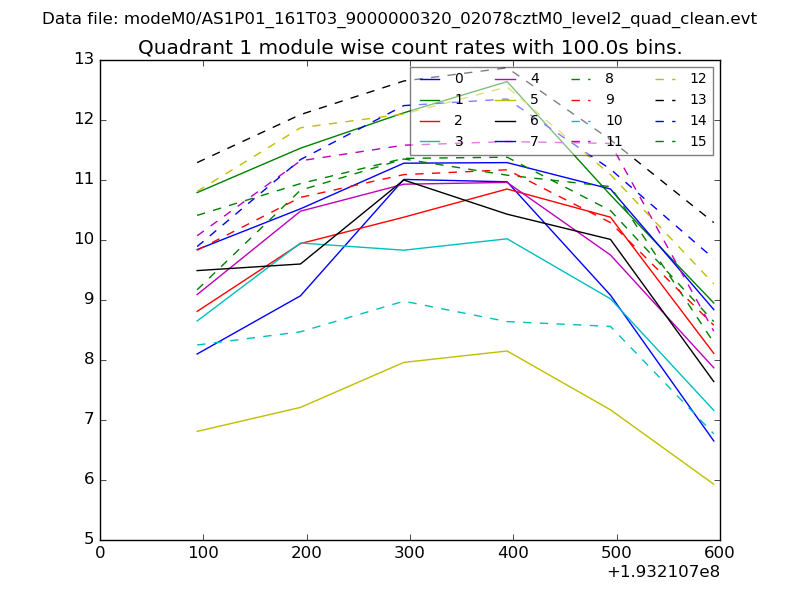
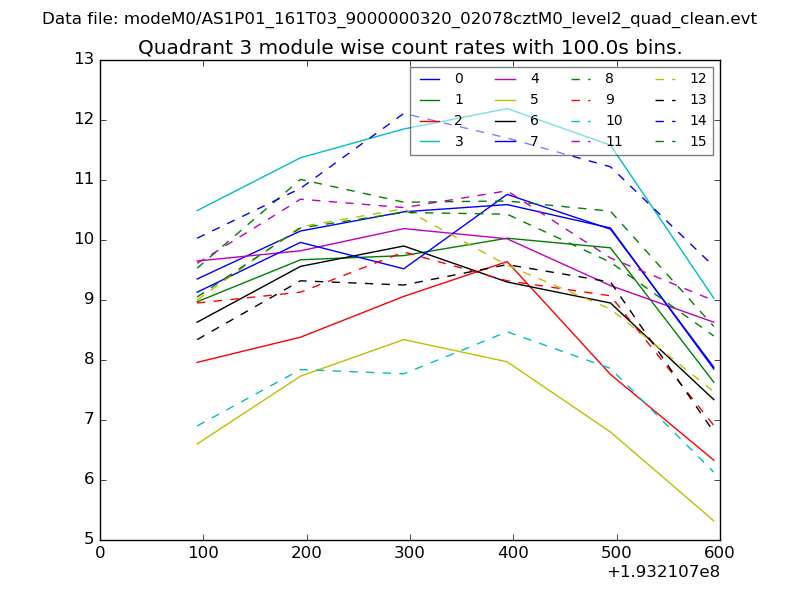
| Module-wise count rates for Quadrant A Data is divided into 100 sec bins |
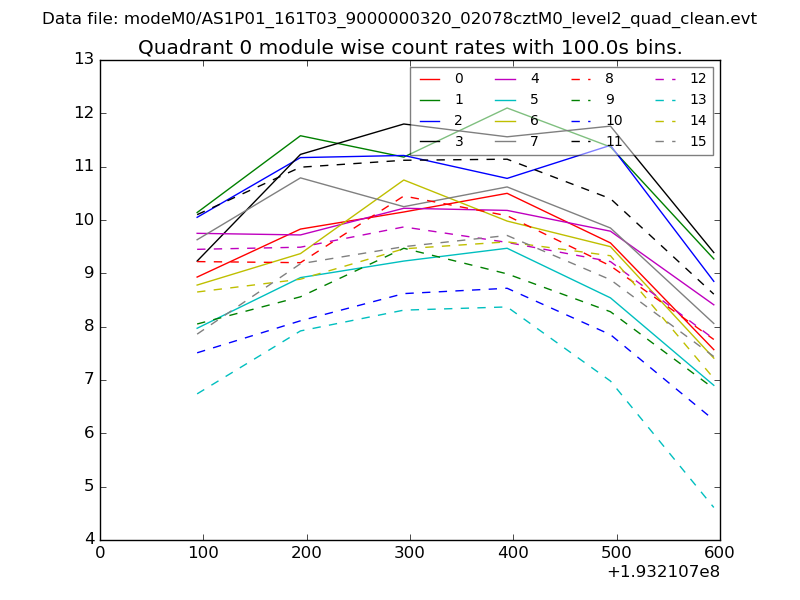 |
 |
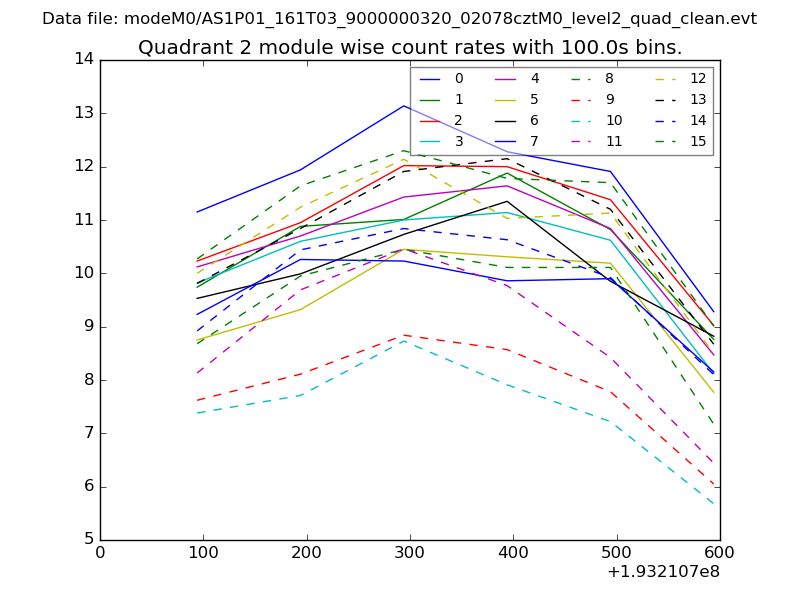
| Module-wise count rates for Quadrant B Data is divided into 100 sec bins |
 |
 |
| Module-wise count rates for Quadrant C Data is divided into 100 sec bins |
 |
 |
| Module-wise count rates for Quadrant D Data is divided into 100 sec bins |
 |
 |
| Parameter | Plot |
|---|---|
| CZT HV Monitor | 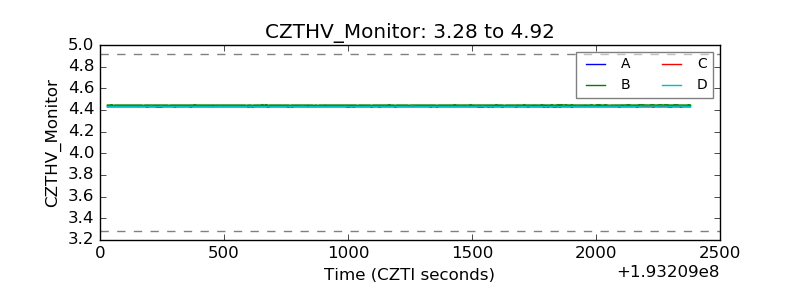 |
| D_VDD |  |
| Temperature 1 | 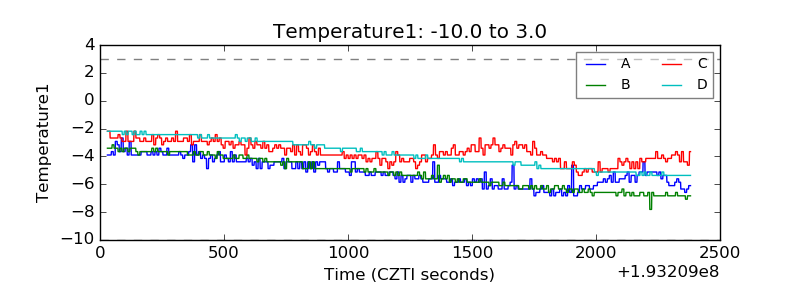 |
| Veto HV Monitor | 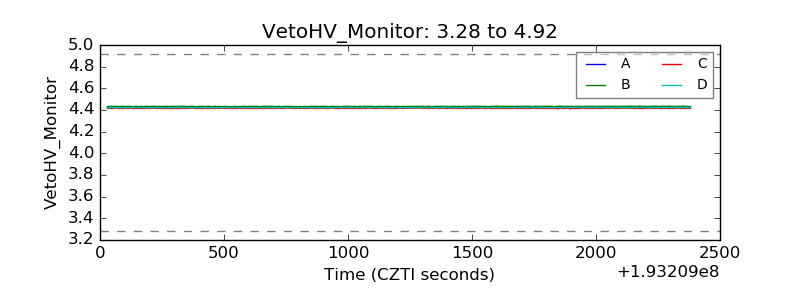 |
| Veto LLD | 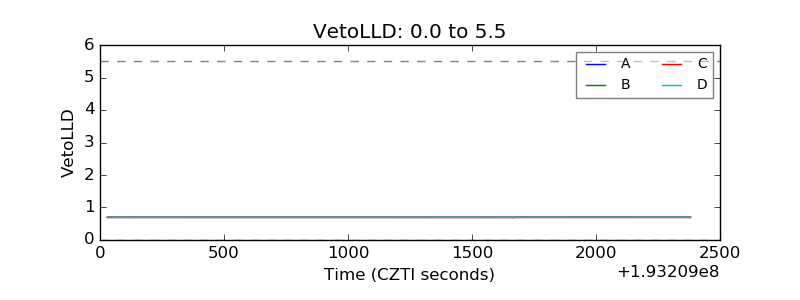 |
| Alpha Counter | 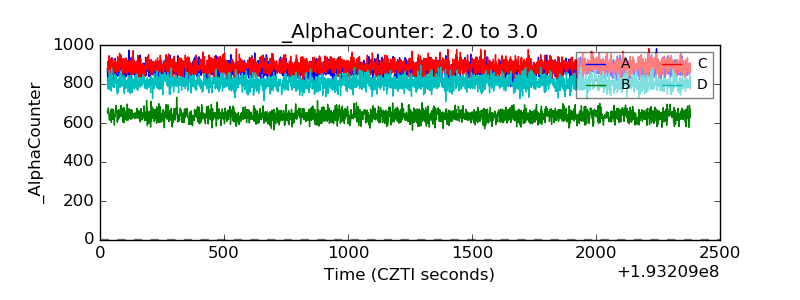 |
| _CPM_Rate | 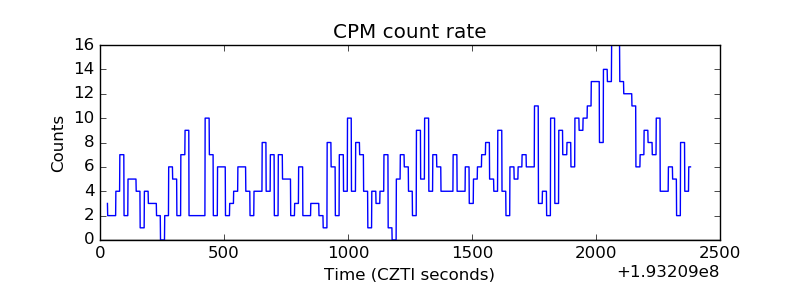 |
| CZT Counter | 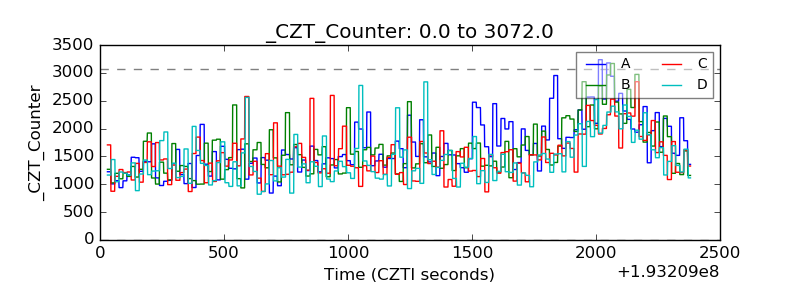 |
| +2.5 Volts monitor |  |
| +5 Volts monitor |  |
| _ROLL_ROT | 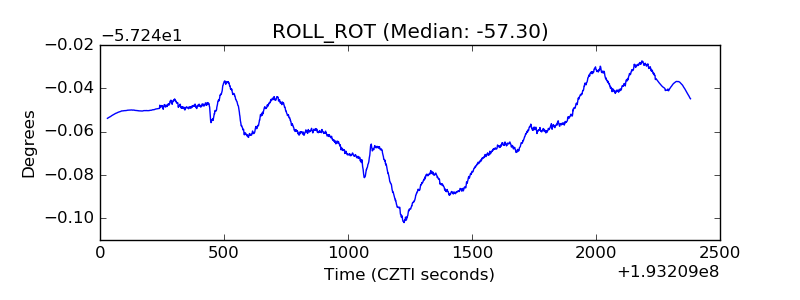 |
| _Roll_DEC | 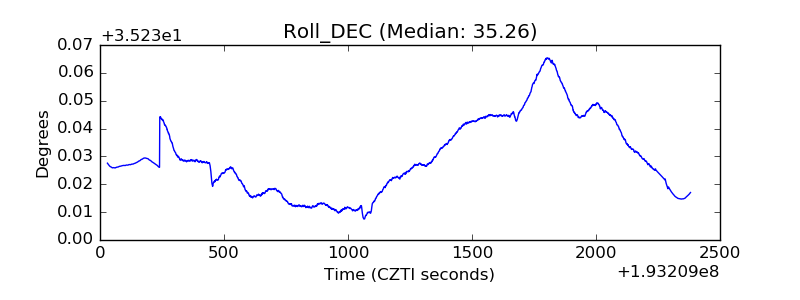 |
| _Roll_RA | 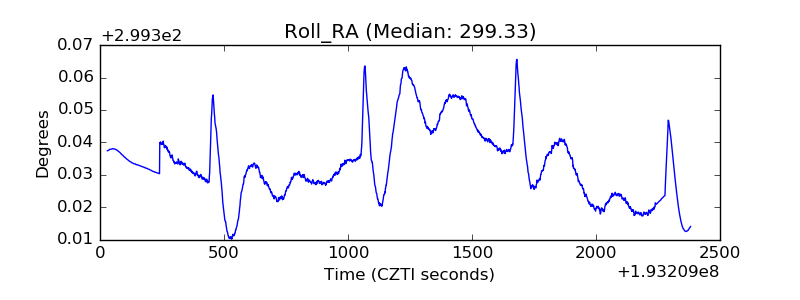 |
| Veto Counter | 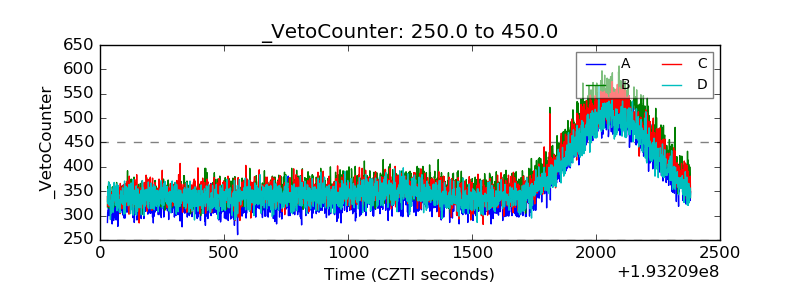 |