| Param | Original file | Final file |
|---|---|---|
| Filename | modeM0/AS1P01_175T03_9000000322_02098cztM0_level2.fits | modeM0/AS1P01_175T03_9000000322_02098cztM0_level2_quad_clean.evt |
| Size (bytes) | 901,690,560 | 110,540,160 |
| Size | 859.9 MB | 105.4 MB |
| Events in quadrant A | 8,519,072 | 750,673 |
| Events in quadrant B | 8,306,896 | 777,131 |
| Events in quadrant C | 7,421,542 | 737,714 |
| Events in quadrant D | 8,655,992 | 647,770 |
| Mode M9 | |||
|---|---|---|---|
| Quadrant | BADHDUFLAG | Total packets | Discarded packets |
| A | 0 | 14 | 0 |
| B | 0 | 14 | 0 |
| C | 0 | 14 | 0 |
| D | 0 | 15 | 0 |
| Mode SS | |||
|---|---|---|---|
| Quadrant | BADHDUFLAG | Total packets | Discarded packets |
| A | 0 | 126 | 0 |
| B | 0 | 126 | 0 |
| C | 0 | 126 | 0 |
| D | 0 | 126 | 0 |
| Mode M0 | |||
|---|---|---|---|
| Quadrant | BADHDUFLAG | Total packets | Discarded packets |
| A | 0 | 29702 | 3 |
| B | 0 | 29070 | 2 |
| C | 0 | 26456 | 2 |
| D | 0 | 30208 | 2 |
| Quadrant | Total seconds | Saturated seconds | Saturation percentage |
|---|---|---|---|
| A | 6225 | 149 | 2.393574% |
| B | 6225 | 75 | 1.204819% |
| C | 6225 | 19 | 0.305221% |
| D | 6225 | 400 | 6.425703% |
Noise dominated data is calculated using 1-second bins in cleaned event files. If a bin has >2000 counts, and if more than 50% of those come from <1% of pixels, then it is considered to be noise-dominated and hence unusable.
| Quadrant | # 1 sec bins | Bins with >0 counts | Bins with >2000 counts | High rate bins dominated by noise | Noise dominated (total time) | Noise dominated (detector-on time) | Marked lightcurve |
|---|---|---|---|---|---|---|---|
| A | 7475 | 6226 | 482 | 482 | 6.45% | 7.74% | 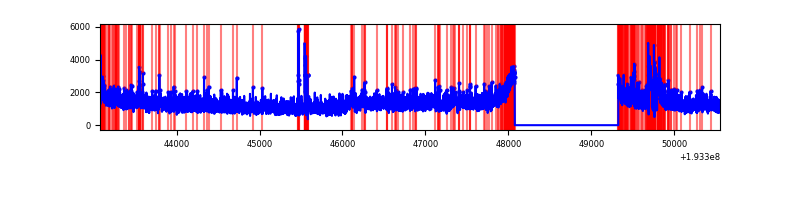 |
| B | 7475 | 6226 | 395 | 395 | 5.28% | 6.34% | 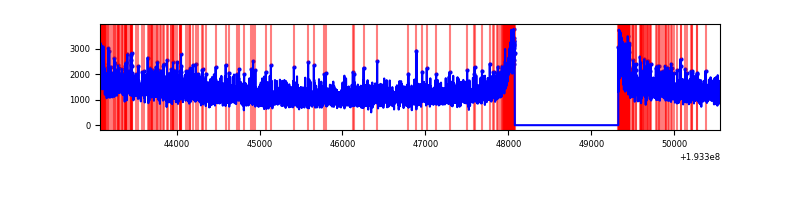 |
| C | 7475 | 6226 | 167 | 167 | 2.23% | 2.68% | 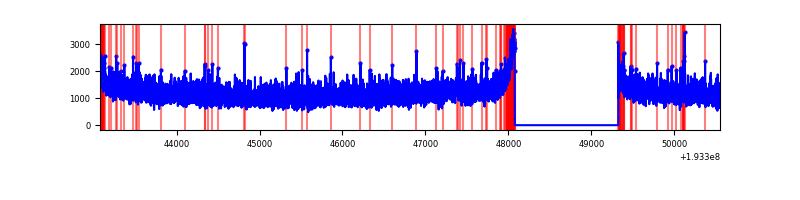 |
| D | 7475 | 6226 | 938 | 938 | 12.55% | 15.07% | 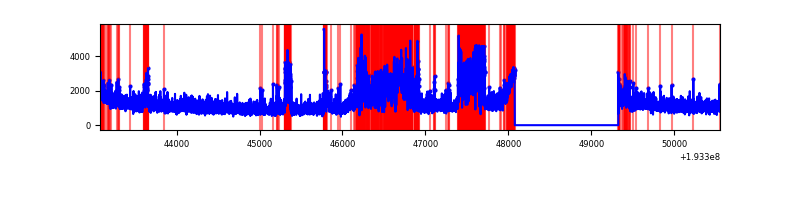 |
Top three noisy pixels from each quadrant. If the there are fewer than three noisy pixels in the level2.evt file, extra rows are filled as -1
| Pixel properties | Quadrant properties | ||||||
|---|---|---|---|---|---|---|---|
| Quadrant | DetID | PixID | Counts | Sigma | Mean | Median | Sigma |
| A | 0 | 128 | 644416 | 1361.43 | 1985 | 1996 | 471.9 |
| A | 0 | 199 | 273080 | 574.49 | 1985 | 1996 | 471.9 |
| A | 0 | 1 | 10708 | 18.46 | 1985 | 1996 | 471.9 |
| B | 4 | 48 | 190463 | 387.04 | 2091 | 2102 | 486.7 |
| B | 8 | 3 | 120085 | 242.43 | 2091 | 2102 | 486.7 |
| B | 5 | 68 | 44321 | 86.75 | 2091 | 2102 | 486.7 |
| C | 2 | 53 | 36587 | 66.72 | 1881 | 1941 | 519.2 |
| C | 10 | 65 | 28437 | 51.03 | 1881 | 1941 | 519.2 |
| C | 5 | 234 | 11332 | 18.09 | 1881 | 1941 | 519.2 |
| D | 2 | 32 | 1838289 | 3342.0 | 1788 | 1856 | 549.5 |
| D | 13 | 169 | 75141 | 133.37 | 1788 | 1856 | 549.5 |
| D | 13 | 88 | 28770 | 48.98 | 1788 | 1856 | 549.5 |
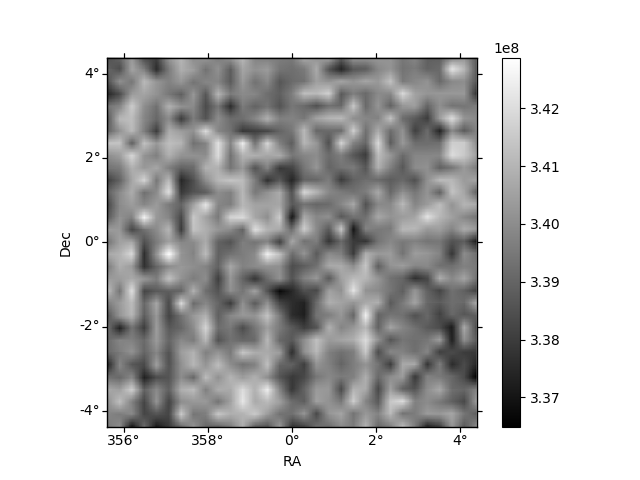
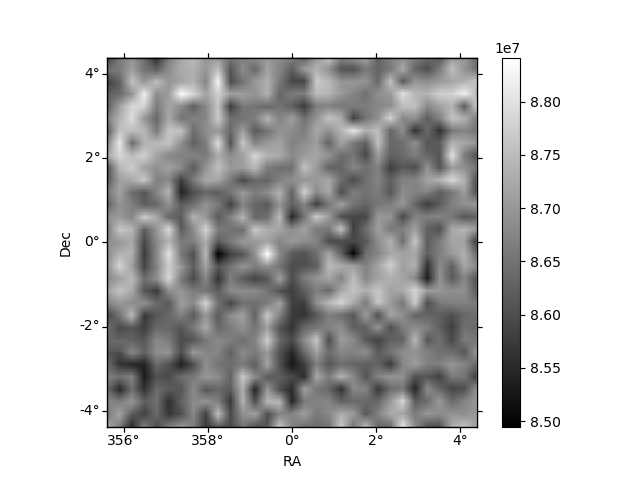
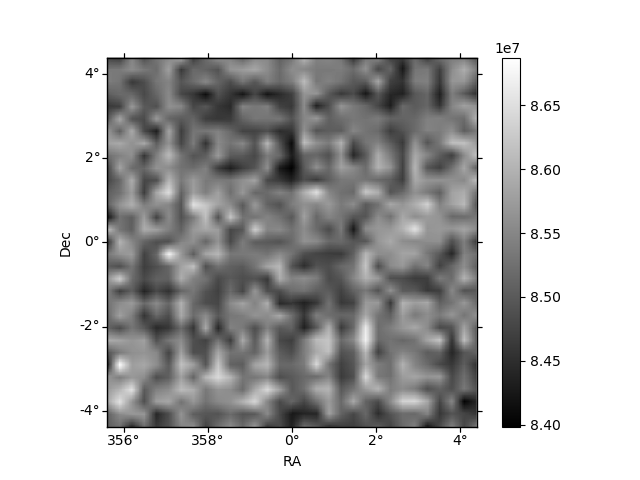
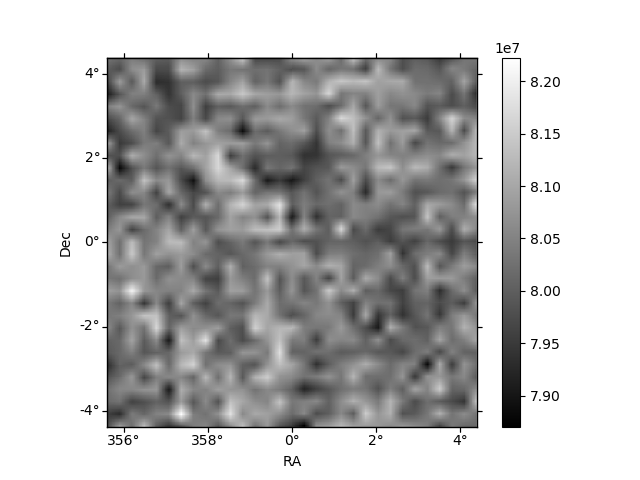
Histogram calculated using DETX and DETY for each event in the final _common_clean file
| Quadrant A | 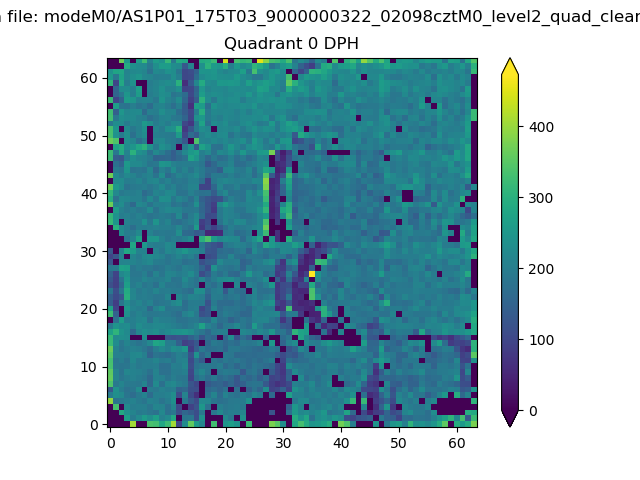 |
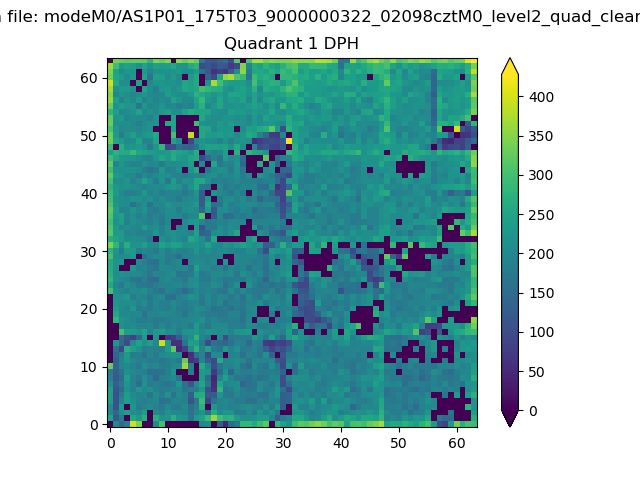 |
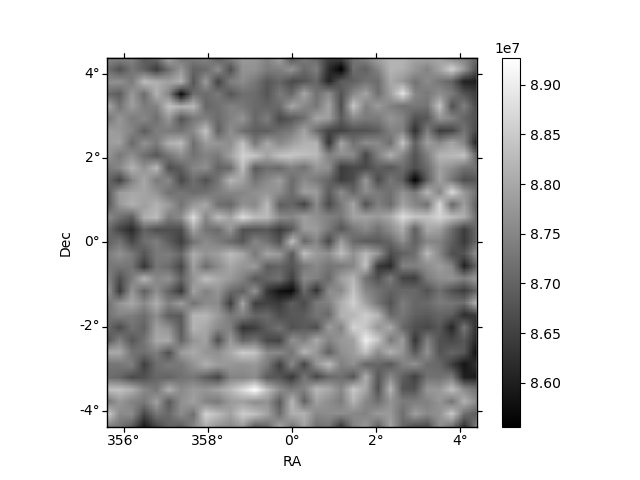
Quadrant B |
|---|---|---|---|
| Quadrant D | 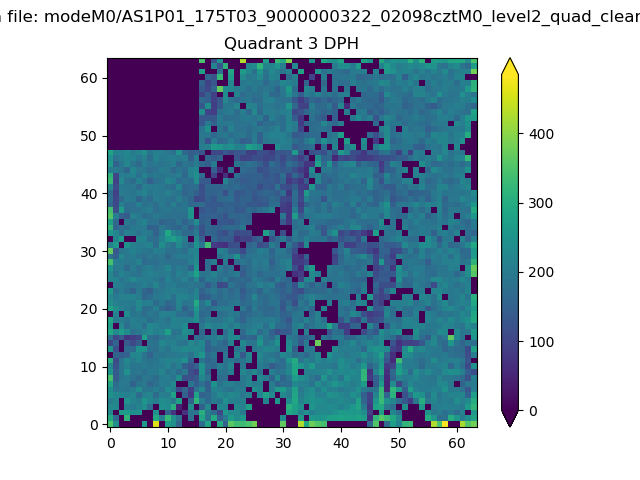 |
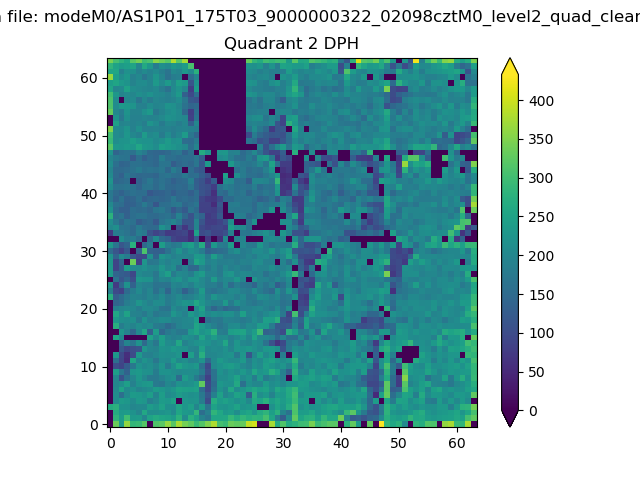 |
Quadrant C |
| Plot type | Count rate plots | Images |
|---|---|---|
| Comparison with Poisson distribution Blue bars denote a histogram of data divided into 1 sec bins. Red curve is a Poisson curve with rate = median count rate of data. |
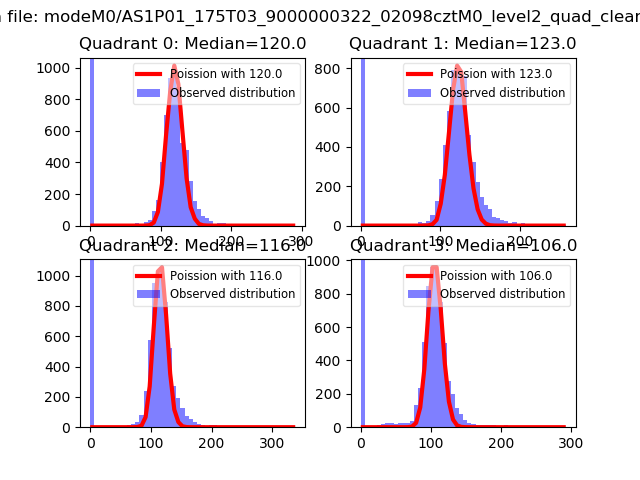 |
 |
| Quadrant-wise count rates Data is divided into 100 sec bins |
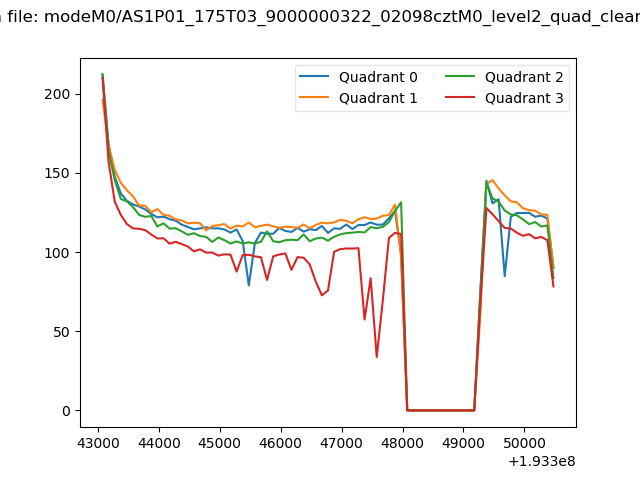 |
|
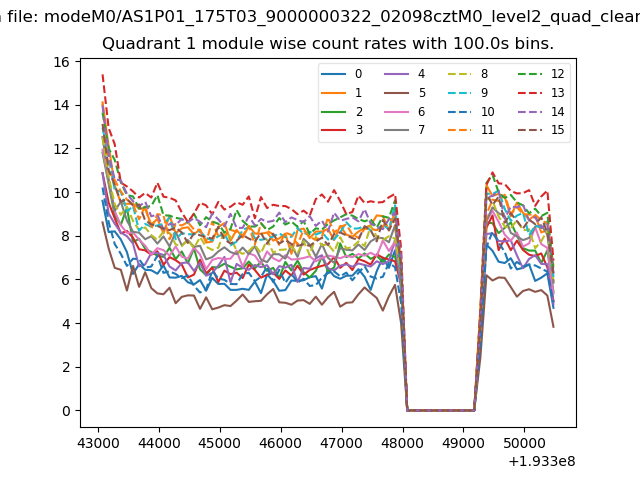
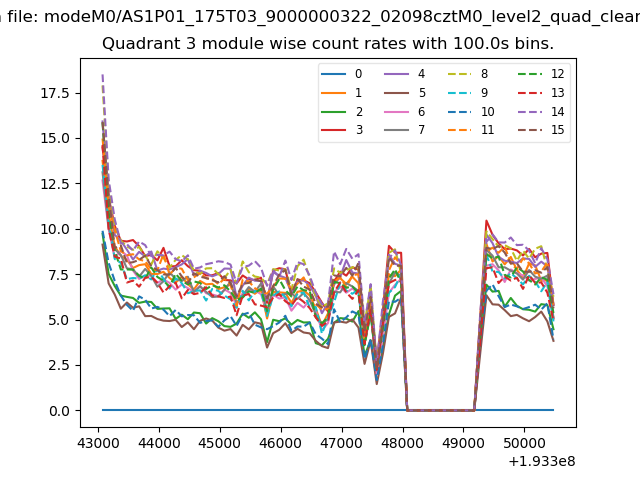
| Module-wise count rates for Quadrant A Data is divided into 100 sec bins |
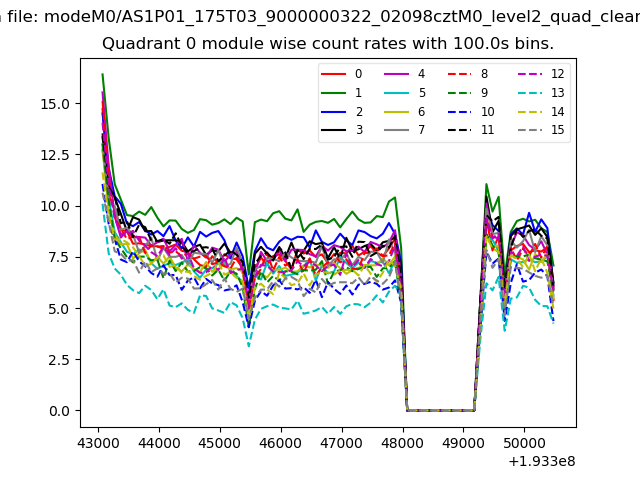 |
 |
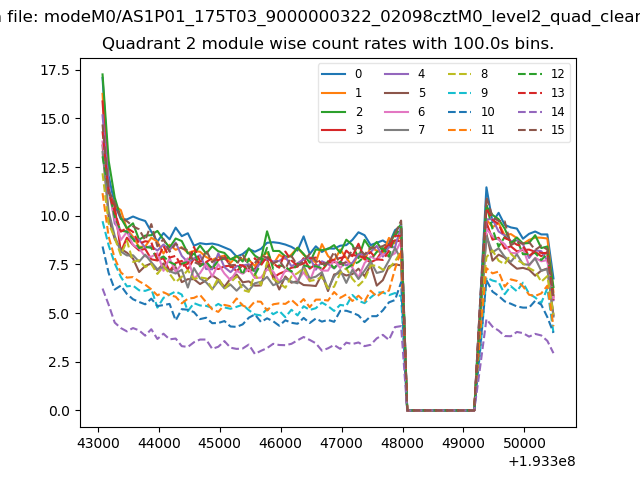
| Module-wise count rates for Quadrant B Data is divided into 100 sec bins |
 |
 |
| Module-wise count rates for Quadrant C Data is divided into 100 sec bins |
 |
 |
| Module-wise count rates for Quadrant D Data is divided into 100 sec bins |
 |
 |
| Parameter | Plot |
|---|---|
| CZT HV Monitor |  |
| D_VDD | 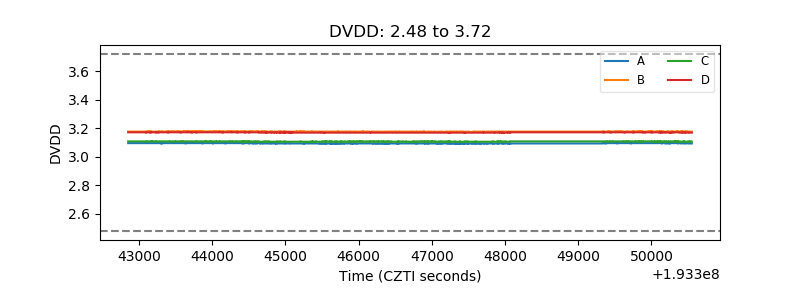 |
| Temperature 1 | 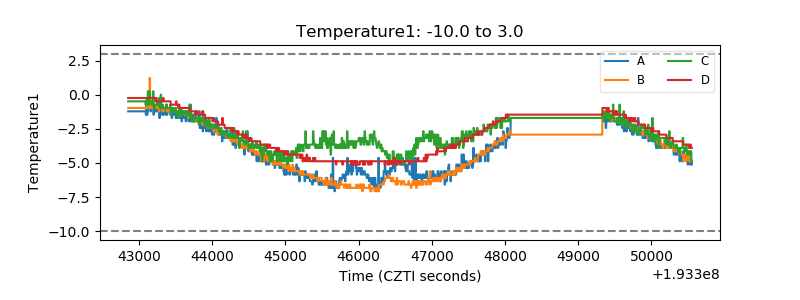 |
| Veto HV Monitor | 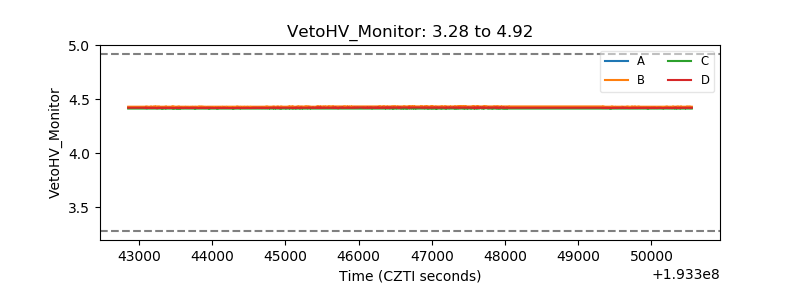 |
| Veto LLD | 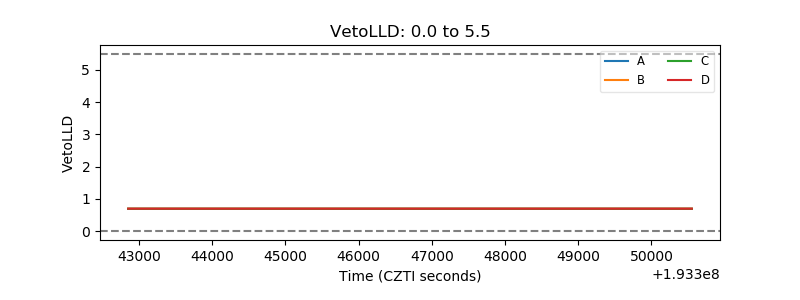 |
| Alpha Counter | 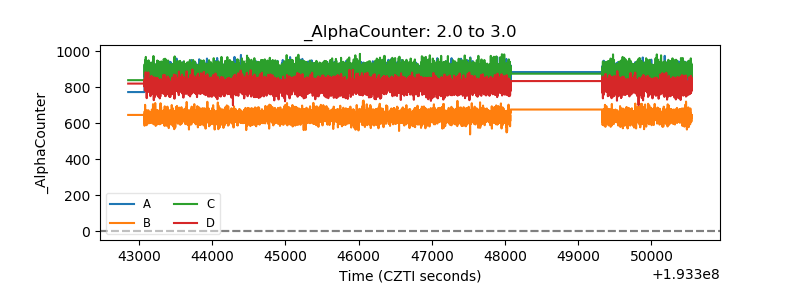 |
| _CPM_Rate | 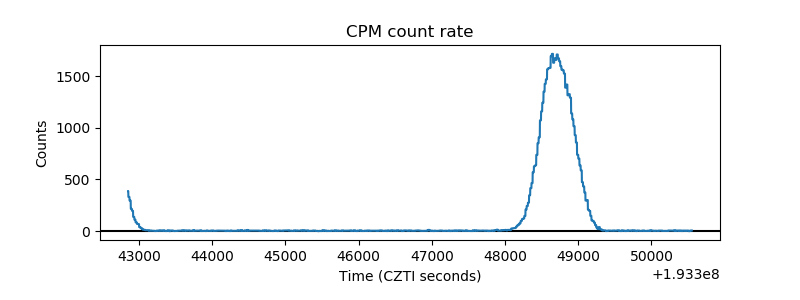 |
| CZT Counter | 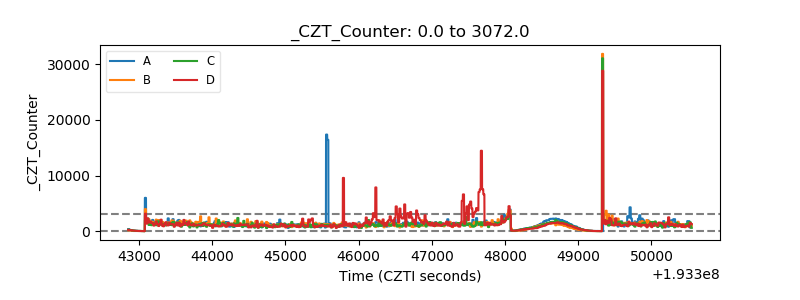 |
| +2.5 Volts monitor |  |
| +5 Volts monitor |  |
| _ROLL_ROT | 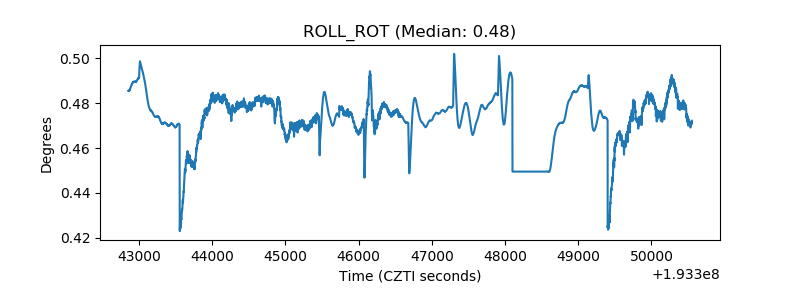 |
| _Roll_DEC | 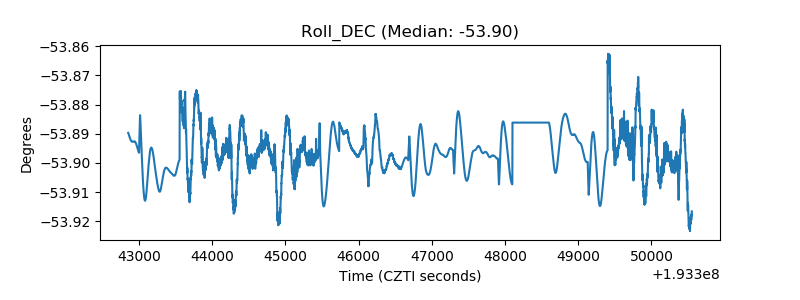 |
| _Roll_RA | 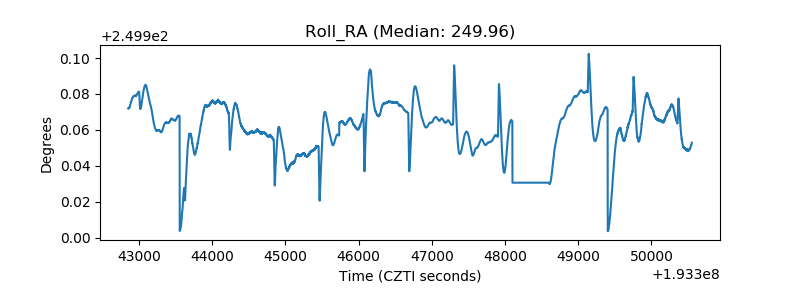 |
| Veto Counter | 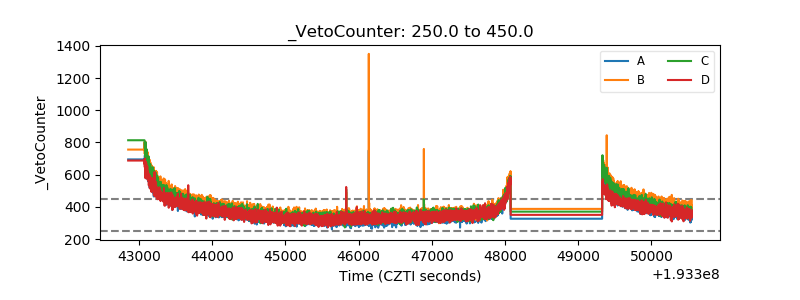 |