| Param | Original file | Final file |
|---|---|---|
| Filename | modeM0/AS1SLEW_01234_9000000321_02078cztM0_level2.evt | modeM0/AS1SLEW_01234_9000000321_02078cztM0_level2_quad_clean.evt |
| Size (bytes) | 194,806,080 | 3,617,280 |
| Size | 185.8 MB | 3.4 MB |
| Events in quadrant A | 1,564,826 | 5,479 |
| Events in quadrant B | 1,597,273 | 5,365 |
| Events in quadrant C | 1,329,262 | 5,350 |
| Events in quadrant D | 1,328,931 | 5,215 |
| Mode SS | |||
|---|---|---|---|
| Quadrant | BADHDUFLAG | Total packets | Discarded packets |
| A | 0 | 22 | 0 |
| B | 0 | 22 | 0 |
| C | 0 | 22 | 0 |
| D | 0 | 22 | 0 |
| Mode M0 | |||
|---|---|---|---|
| Quadrant | BADHDUFLAG | Total packets | Discarded packets |
| A | 0 | 5460 | 0 |
| B | 0 | 5567 | 0 |
| C | 0 | 4771 | 0 |
| D | 0 | 4791 | 0 |
| Quadrant | Total seconds | Saturated seconds | Saturation percentage |
|---|---|---|---|
| A | 1154 | 10 | 0.866551% |
| B | 1154 | 2 | 0.173310% |
| C | 1154 | 15 | 1.299827% |
| D | 1154 | 57 | 4.939341% |
Noise dominated data is calculated using 1-second bins in cleaned event files. If a bin has >2000 counts, and if more than 50% of those come from <1% of pixels, then it is considered to be noise-dominated and hence unusable.
| Quadrant | # 1 sec bins | Bins with >0 counts | Bins with >2000 counts | High rate bins dominated by noise | Noise dominated (total time) | Noise dominated (detector-on time) | Marked lightcurve |
|---|---|---|---|---|---|---|---|
| A | 1154 | 1154 | 168 | 168 | 14.56% | 14.56% | 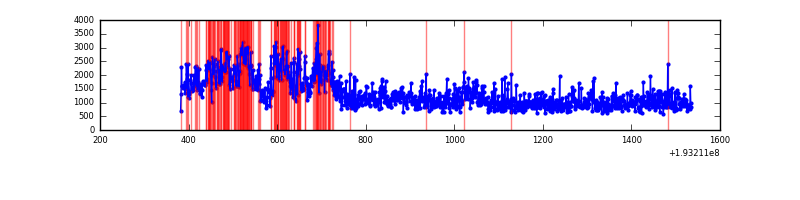 |
| B | 1154 | 1154 | 82 | 82 | 7.11% | 7.11% | 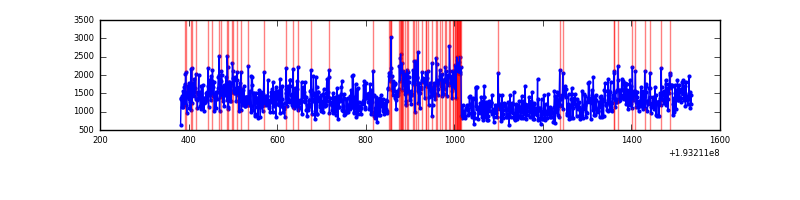 |
| C | 1154 | 1154 | 28 | 28 | 2.43% | 2.43% | 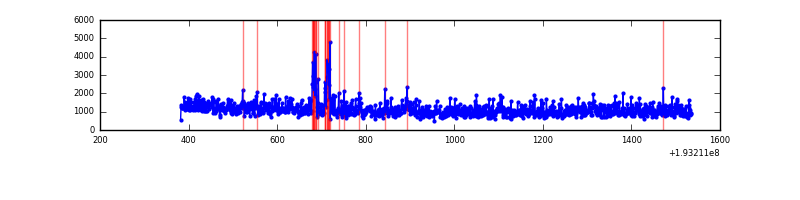 |
| D | 1154 | 1154 | 83 | 83 | 7.19% | 7.19% | 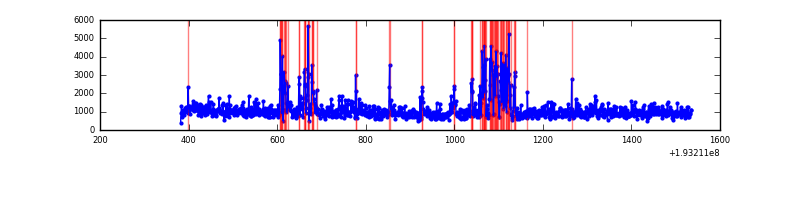 |
Top three noisy pixels from each quadrant. If the there are fewer than three noisy pixels in the level2.evt file, extra rows are filled as -1
| Pixel properties | Quadrant properties | ||||||
|---|---|---|---|---|---|---|---|
| Quadrant | DetID | PixID | Counts | Sigma | Mean | Median | Sigma |
| A | 0 | 199 | 297376 | 3633.23 | 331 | 333 | 81.8 |
| A | -1 | -1 | -1 | -1.0 | 331 | 333 | 81.8 |
| A | -1 | -1 | -1 | -1.0 | 331 | 333 | 81.8 |
| B | 5 | 68 | 209131 | 2445.14 | 359 | 361 | 85.4 |
| B | 4 | 48 | 18910 | 217.25 | 359 | 361 | 85.4 |
| B | 8 | 3 | 8302 | 93.01 | 359 | 361 | 85.4 |
| C | 10 | 82 | 55110 | 604.11 | 321 | 333 | 90.7 |
| C | 14 | 223 | 16867 | 182.35 | 321 | 333 | 90.7 |
| C | 10 | 65 | 1678 | 14.83 | 321 | 333 | 90.7 |
| D | 2 | 32 | 252003 | 2771.17 | 287 | 295 | 90.8 |
| D | 13 | 88 | 4280 | 43.87 | 287 | 295 | 90.8 |
| D | 7 | 85 | 1193 | 9.89 | 287 | 295 | 90.8 |
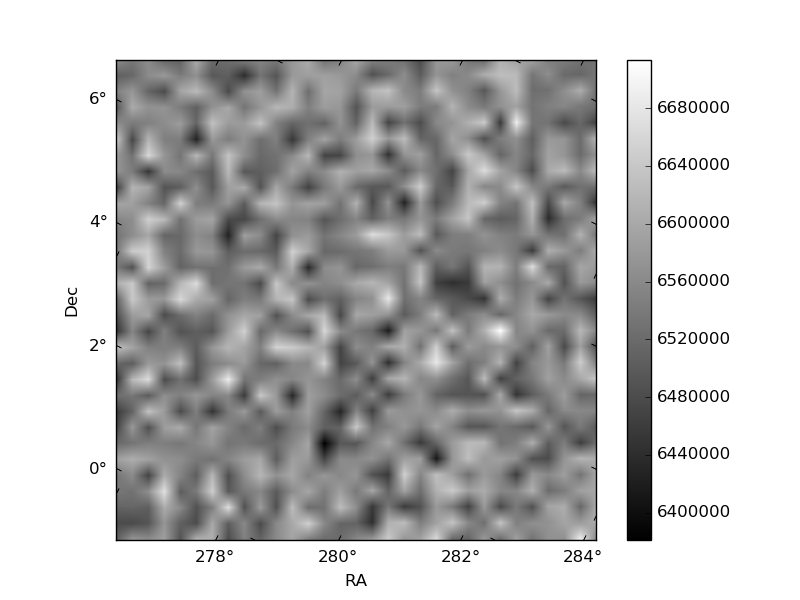
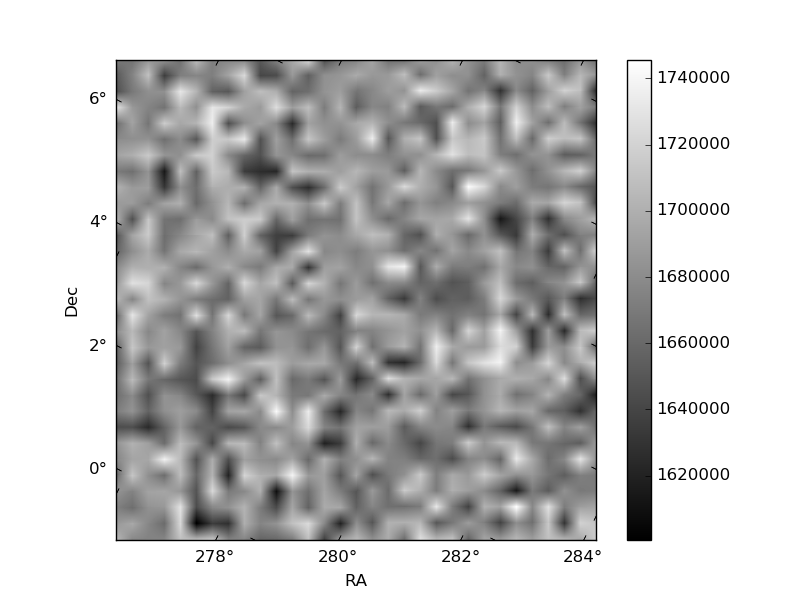
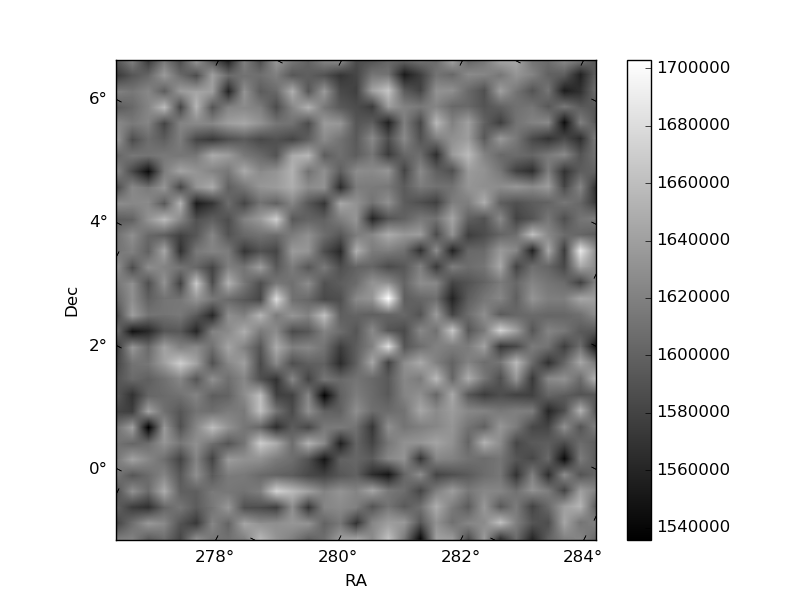
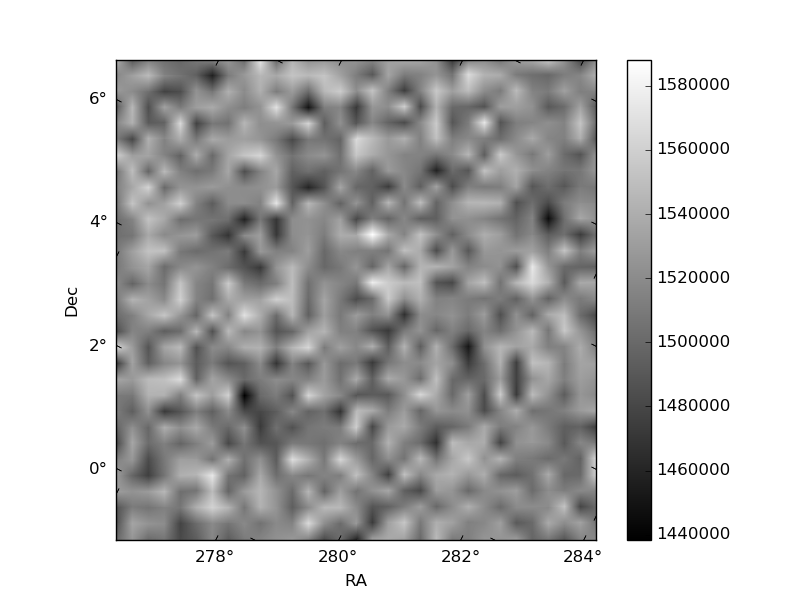
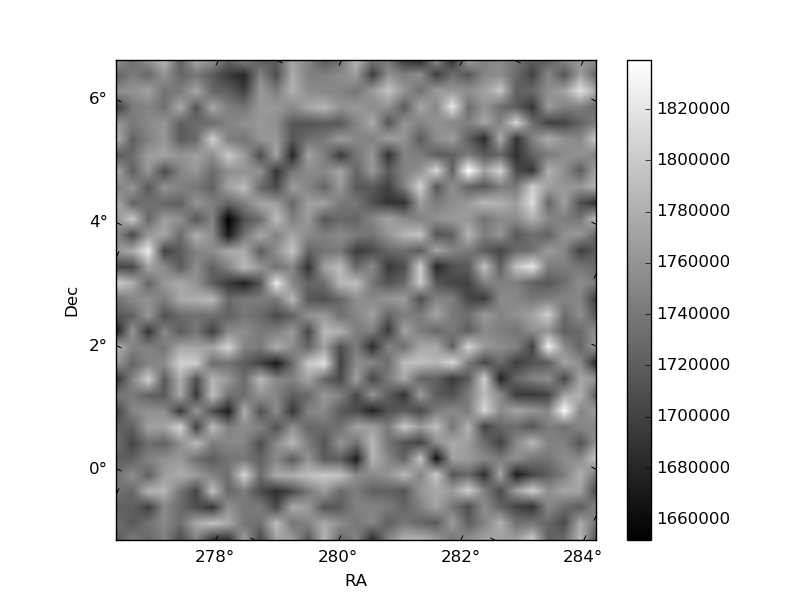
Histogram calculated using DETX and DETY for each event in the final _common_clean file
| Quadrant A | 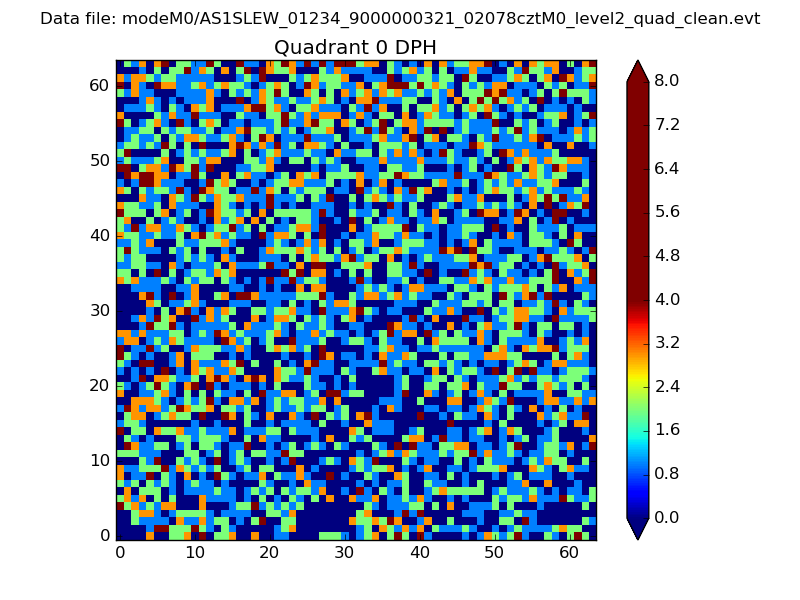 |
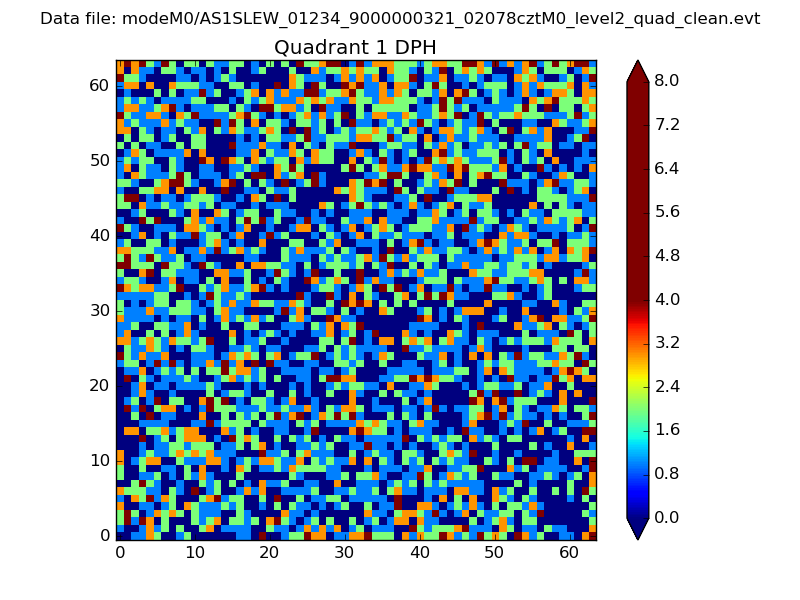 |
Quadrant B |
|---|---|---|---|
| Quadrant D | 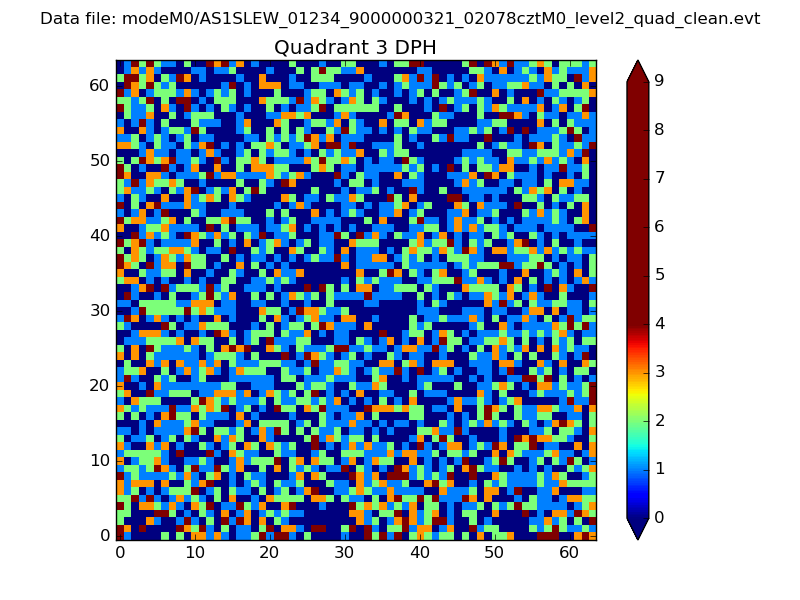 |
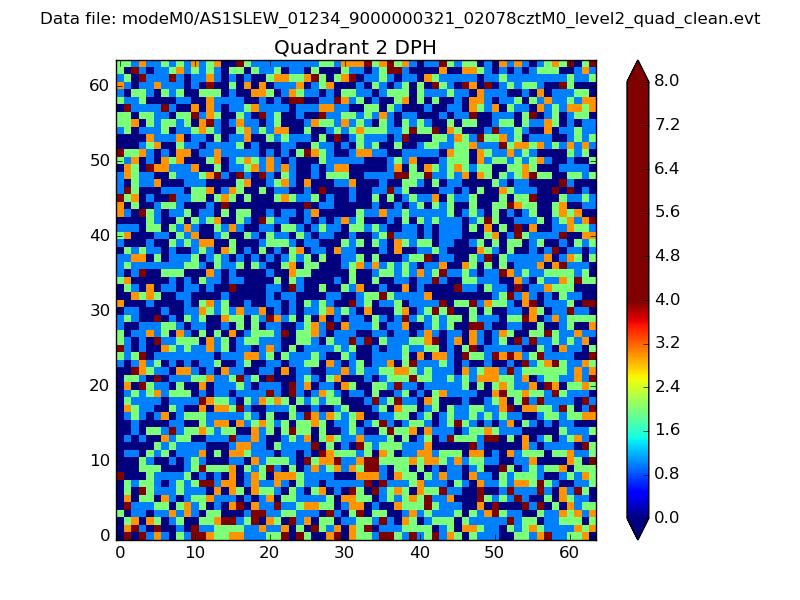 |
Quadrant C |
| Plot type | Count rate plots | Images |
|---|---|---|
| Comparison with Poisson distribution Blue bars denote a histogram of data divided into 1 sec bins. Red curve is a Poisson curve with rate = median count rate of data. |
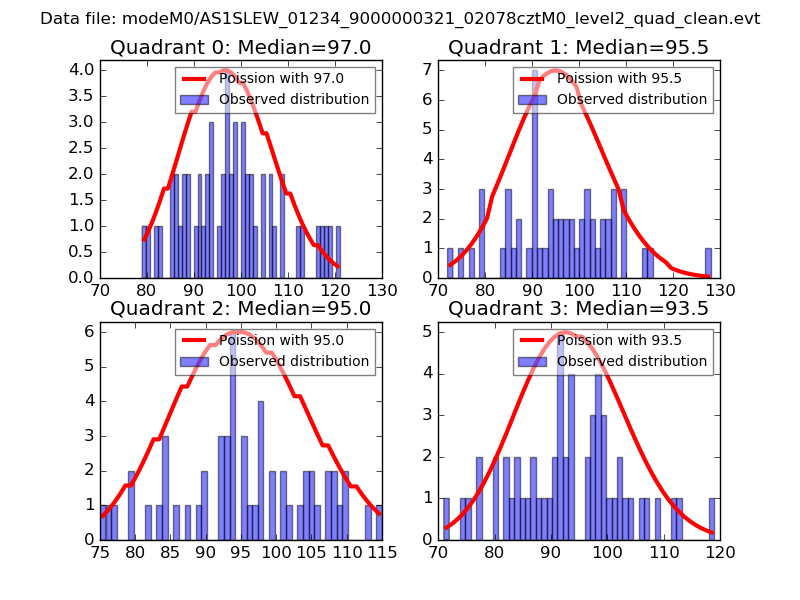 |
 |
| Quadrant-wise count rates Data is divided into 100 sec bins |
 |
|
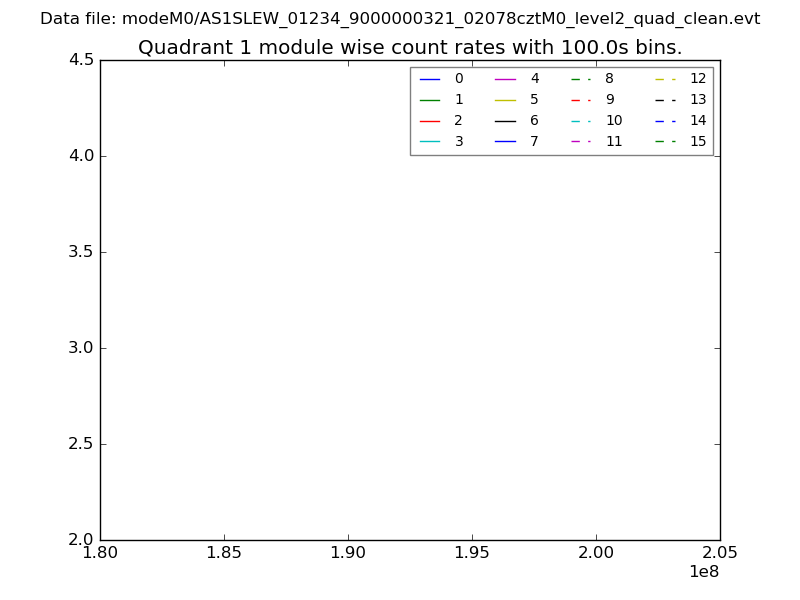
| Module-wise count rates for Quadrant A Data is divided into 100 sec bins |
 |
 |
| Module-wise count rates for Quadrant B Data is divided into 100 sec bins |
 |
 |
| Module-wise count rates for Quadrant C Data is divided into 100 sec bins |
 |
 |
| Module-wise count rates for Quadrant D Data is divided into 100 sec bins |
 |
 |
| Parameter | Plot |
|---|---|
| CZT HV Monitor | 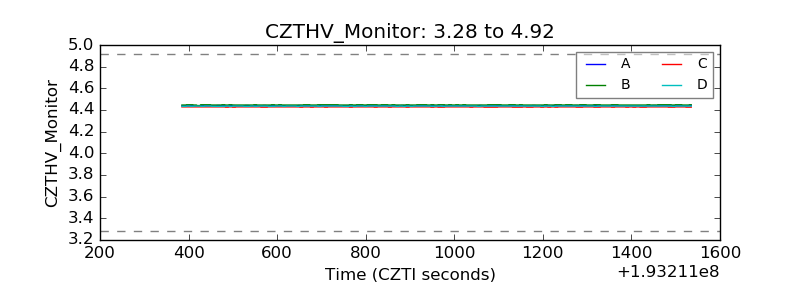 |
| D_VDD | 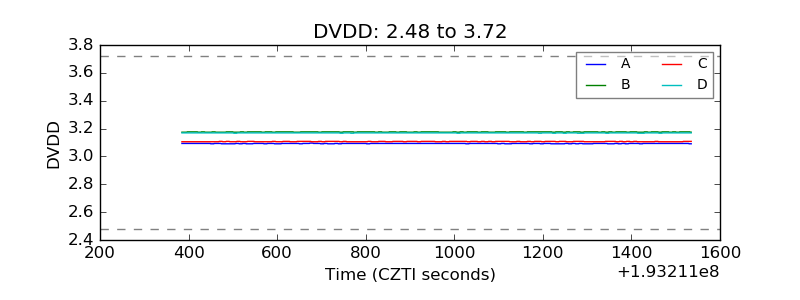 |
| Temperature 1 | 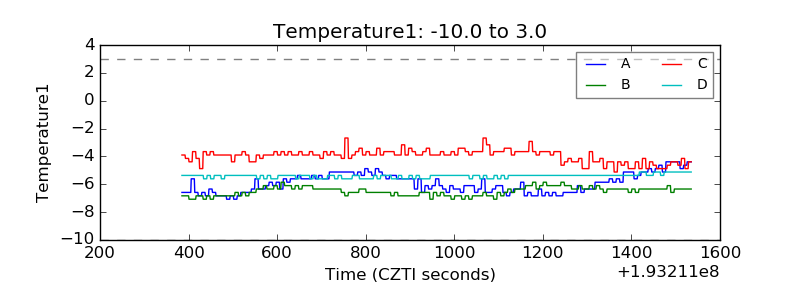 |
| Veto HV Monitor | 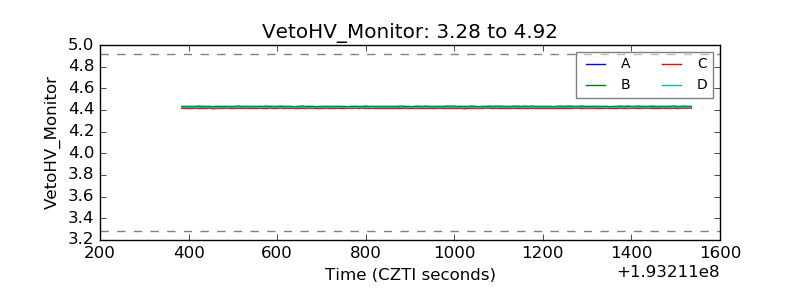 |
| Veto LLD | 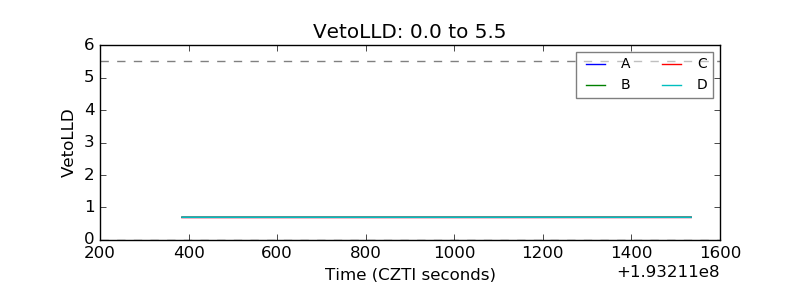 |
| Alpha Counter | 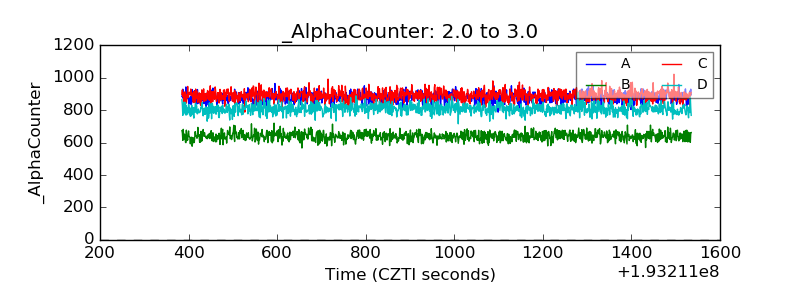 |
| _CPM_Rate | 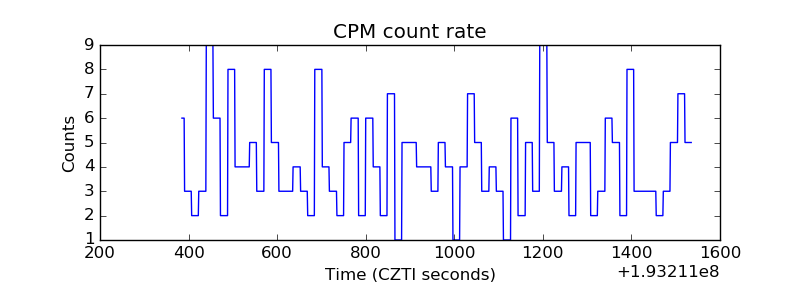 |
| CZT Counter | 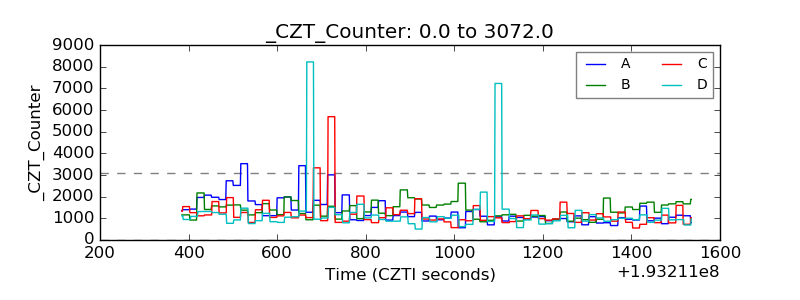 |
| +2.5 Volts monitor |  |
| +5 Volts monitor | 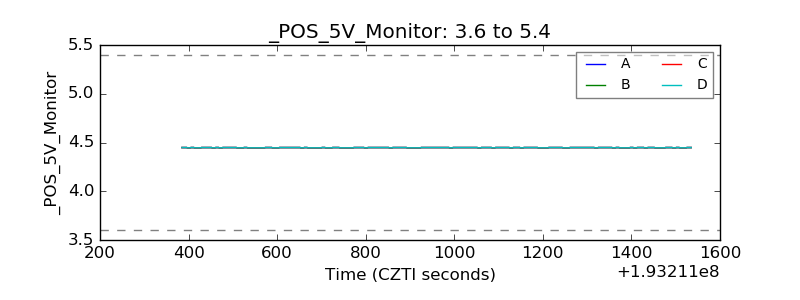 |
| _ROLL_ROT | 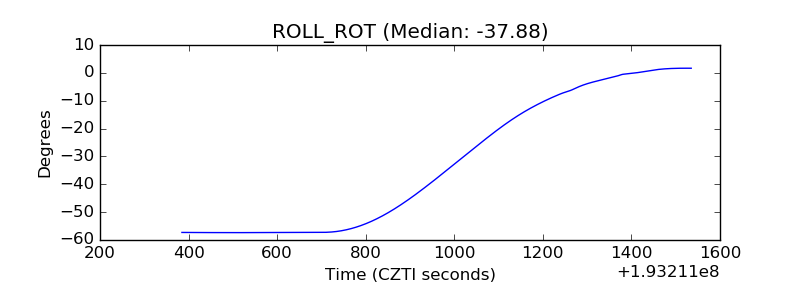 |
| _Roll_DEC | 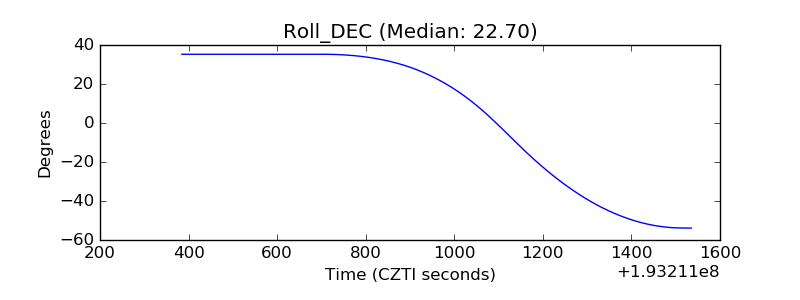 |
| _Roll_RA | 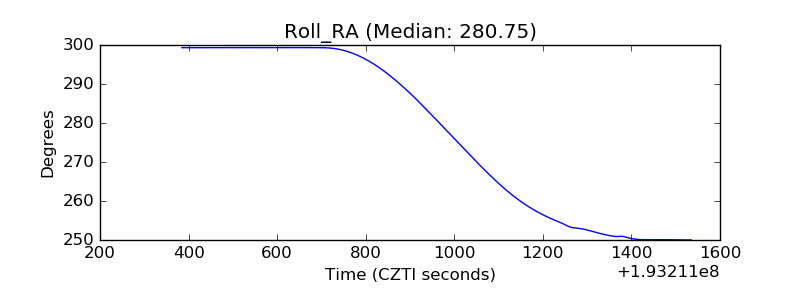 |
| Veto Counter | 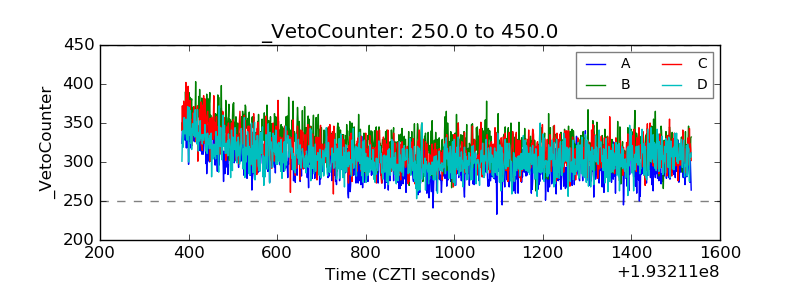 |