| Param | Original file | Final file |
|---|---|---|
| Filename | modeM0/AS1P01_163T03_9000000324cztM0_level2.fits | modeM0/AS1P01_163T03_9000000324cztM0_level2_quad_clean.evt |
| Size (bytes) | 220,878,720 | 247,832,640 |
| Size | 210.6 MB | 236.4 MB |
| Events in quadrant A | 1,255,824 | 1,468,497 |
| Events in quadrant B | 1,281,290 | 1,504,153 |
| Events in quadrant C | 1,269,058 | 1,432,358 |
| Events in quadrant D | 1,096,430 | 1,313,954 |
| Mode SS | |||
|---|---|---|---|
| Quadrant | BADHDUFLAG | Total packets | Discarded packets |
| A | 0 | 528 | 0 |
| B | 0 | 528 | 0 |
| C | 0 | 528 | 0 |
| D | 0 | 528 | 0 |
| Mode M9 | |||
|---|---|---|---|
| Quadrant | BADHDUFLAG | Total packets | Discarded packets |
| A | 0 | 37 | 0 |
| B | 0 | 37 | 0 |
| C | 0 | 37 | 0 |
| D | 0 | 37 | 0 |
| Mode M0 | |||
|---|---|---|---|
| Quadrant | BADHDUFLAG | Total packets | Discarded packets |
| A | 0 | 122465 | 0 |
| B | 0 | 117777 | 0 |
| C | 0 | 110608 | 0 |
| D | 0 | 104371 | 0 |
| Quadrant | Total seconds | Saturated seconds | Saturation percentage |
|---|---|---|---|
| A | 25970 | 856 | 3.296111% |
| B | 25969 | 148 | 0.569910% |
| C | 25969 | 111 | 0.427433% |
| D | 25969 | 122 | 0.469791% |
Noise dominated data is calculated using 1-second bins in cleaned event files. If a bin has >2000 counts, and if more than 50% of those come from <1% of pixels, then it is considered to be noise-dominated and hence unusable.
| Quadrant | # 1 sec bins | Bins with >0 counts | Bins with >2000 counts | High rate bins dominated by noise | Noise dominated (total time) | Noise dominated (detector-on time) | Marked lightcurve |
|---|---|---|---|---|---|---|---|
| A | 29670 | 25916 | 0 | 0 | 0.00% | 0.00% |  |
| B | 29670 | 25955 | 0 | 0 | 0.00% | 0.00% | 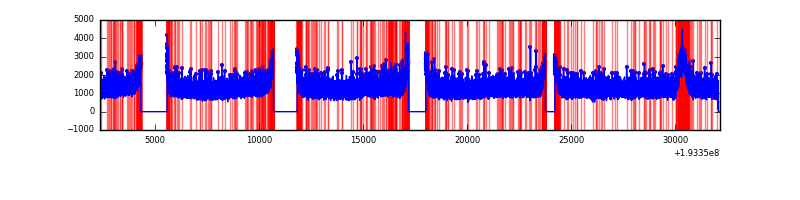 |
| C | 29670 | 25955 | 0 | 0 | 0.00% | 0.00% | 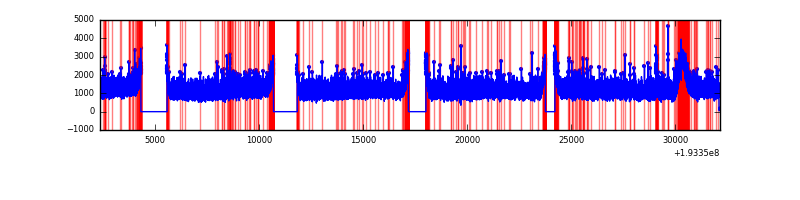 |
| D | 29670 | 25953 | 0 | 0 | 0.00% | 0.00% |  |
Top three noisy pixels from each quadrant. If the there are fewer than three noisy pixels in the level2.evt file, extra rows are filled as -1
| Pixel properties | Quadrant properties | ||||||
|---|---|---|---|---|---|---|---|
| Quadrant | DetID | PixID | Counts | Sigma | Mean | Median | Sigma |
| A | 0 | 29 | 1176 | 11.28 | 325 | 304 | 77.3 |
| A | 7 | 110 | 1085 | 10.1 | 325 | 304 | 77.3 |
| A | 9 | 19 | 960 | 8.49 | 325 | 304 | 77.3 |
| B | 2 | 9 | 1036 | 11.45 | 338 | 321 | 62.4 |
| B | 5 | 128 | 837 | 8.26 | 338 | 321 | 62.4 |
| B | 2 | 8 | 815 | 7.91 | 338 | 321 | 62.4 |
| C | 12 | 241 | 875 | 6.9 | 334 | 309 | 82.0 |
| C | 3 | 126 | 837 | 6.44 | 334 | 309 | 82.0 |
| C | 1 | 81 | 828 | 6.33 | 334 | 309 | 82.0 |
| D | 3 | 14 | 805 | 6.98 | 312 | 287 | 74.2 |
| D | 6 | 231 | 782 | 6.67 | 312 | 287 | 74.2 |
| D | 1 | 19 | 778 | 6.61 | 312 | 287 | 74.2 |
Histogram calculated using DETX and DETY for each event in the final _common_clean file
| Quadrant A | 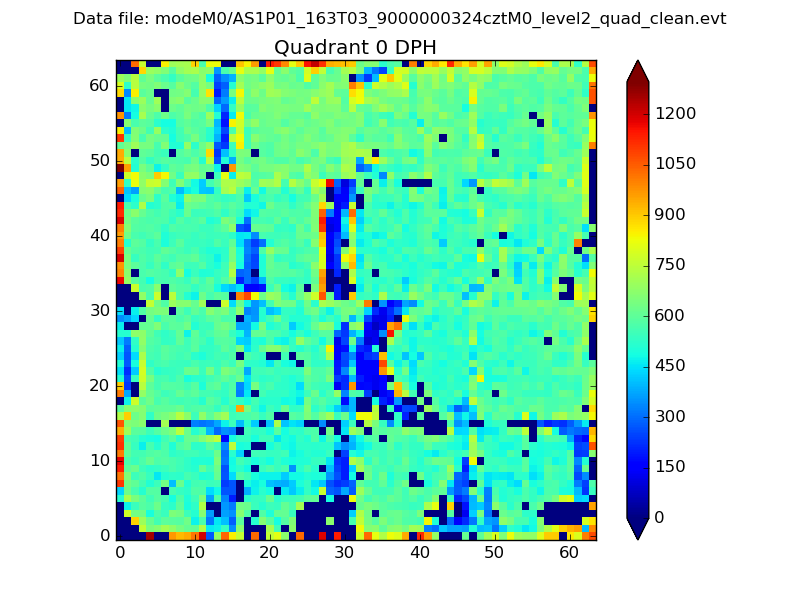 |
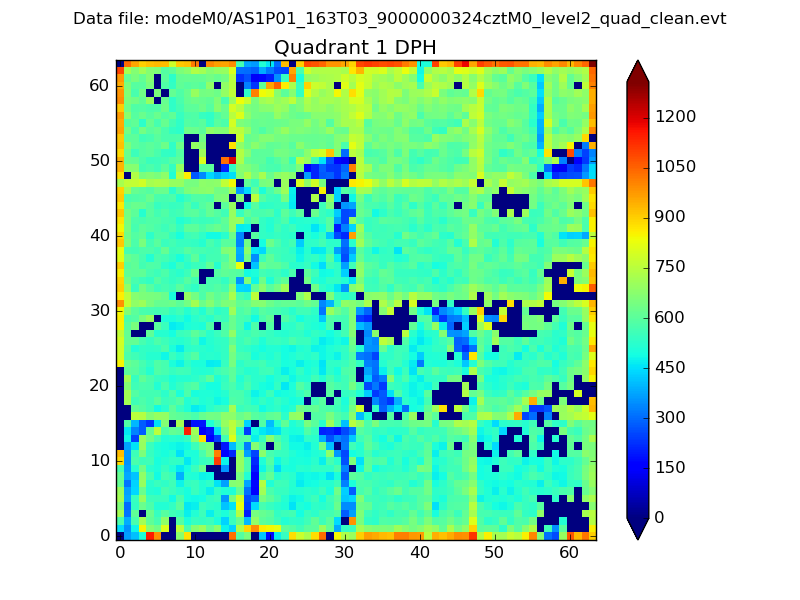 |
Quadrant B |
|---|---|---|---|
| Quadrant D | 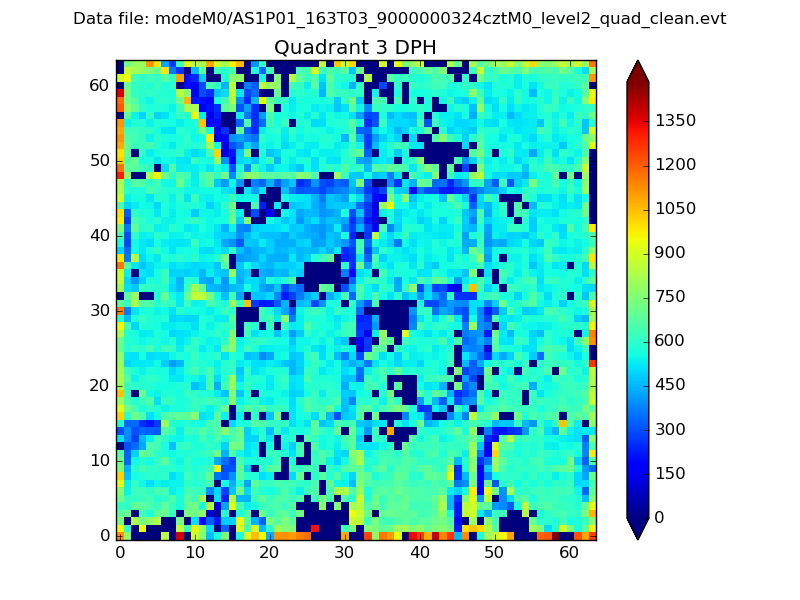 |
 |
Quadrant C |
| Plot type | Count rate plots | Images |
|---|---|---|
| Comparison with Poisson distribution Blue bars denote a histogram of data divided into 1 sec bins. Red curve is a Poisson curve with rate = median count rate of data. |
 |
 |
| Quadrant-wise count rates Data is divided into 100 sec bins |
 |
|
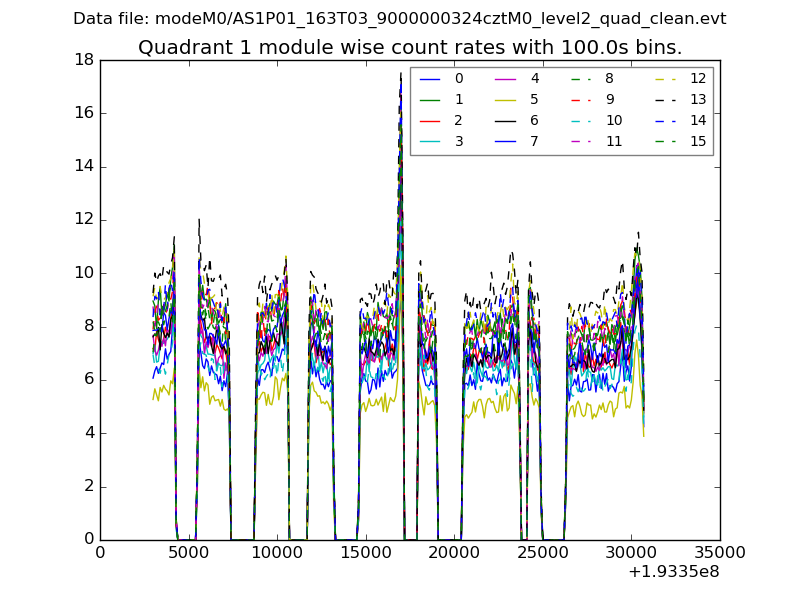
| Module-wise count rates for Quadrant A Data is divided into 100 sec bins |
 |
 |
| Module-wise count rates for Quadrant B Data is divided into 100 sec bins |
 |
 |
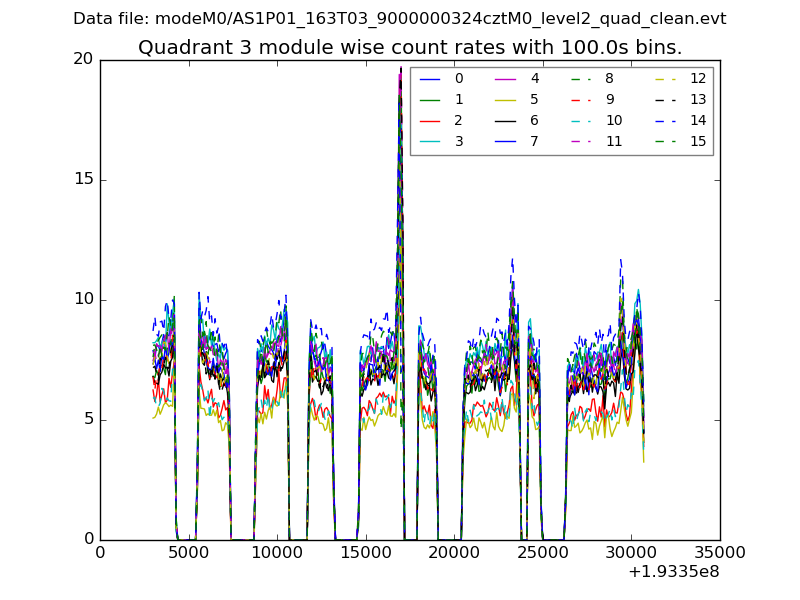
| Module-wise count rates for Quadrant C Data is divided into 100 sec bins |
 |
 |
| Module-wise count rates for Quadrant D Data is divided into 100 sec bins |
 |
 |
| Parameter | Plot |
|---|---|
| CZT HV Monitor |  |
| D_VDD |  |
| Temperature 1 |  |
| Veto HV Monitor |  |
| Veto LLD |  |
| Alpha Counter |  |
| _CPM_Rate |  |
| CZT Counter |  |
| +2.5 Volts monitor |  |
| +5 Volts monitor | 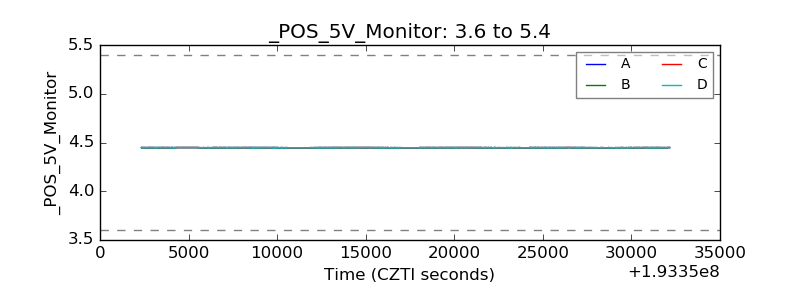 |
| _ROLL_ROT | 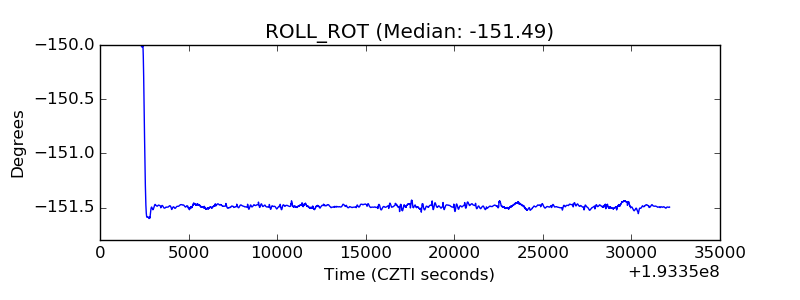 |
| _Roll_DEC | 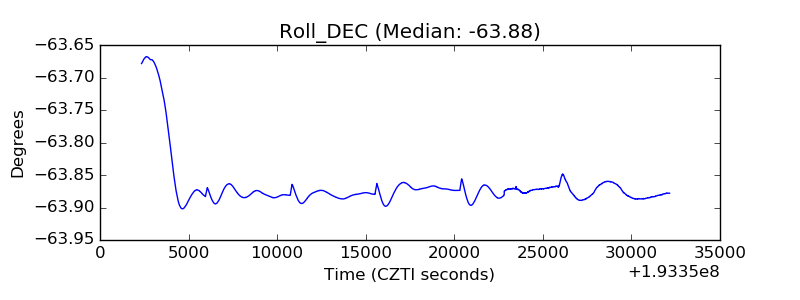 |
| _Roll_RA | 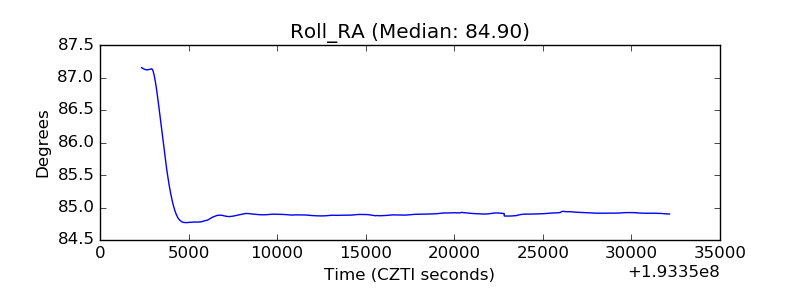 |
| Veto Counter | 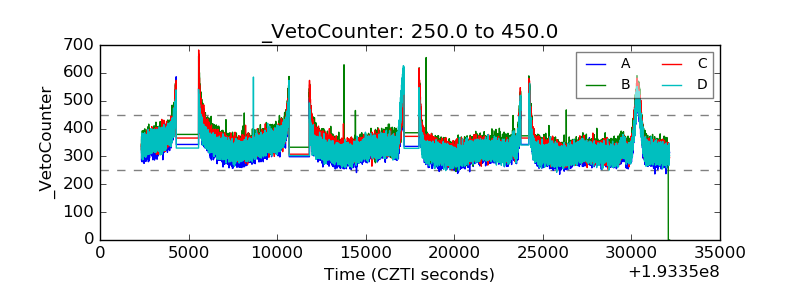 |