| Param | Original file | Final file |
|---|---|---|
| Filename | modeM0/AS1P01_163T03_9000000324_02104cztM0_level2.evt | modeM0/AS1P01_163T03_9000000324_02104cztM0_level2_quad_clean.evt |
| Size (bytes) | 3,407,040 | 1,128,960 |
| Size | 3.2 MB | 1.1 MB |
| Events in quadrant A | 18,871 | 4,119 |
| Events in quadrant B | 25,525 | 5,313 |
| Events in quadrant C | 26,857 | 6,460 |
| Events in quadrant D | 24,494 | 5,425 |
| Mode SS | |||
|---|---|---|---|
| Quadrant | BADHDUFLAG | Total packets | Discarded packets |
| A | 0 | 20 | 9 |
| B | 0 | 19 | 6 |
| C | 0 | 19 | 7 |
| D | 0 | 19 | 7 |
| Mode M9 | |||
|---|---|---|---|
| Quadrant | BADHDUFLAG | Total packets | Discarded packets |
| A | 1 | 273359709408 | 0 |
| B | 1 | -1 | -1 |
| C | 1 | -1 | -1 |
| D | 1 | -1 | -1 |
| Mode M0 | |||
|---|---|---|---|
| Quadrant | BADHDUFLAG | Total packets | Discarded packets |
| A | 0 | 2117 | 2023 |
| B | 0 | 2004 | 1882 |
| C | 0 | 1910 | 1766 |
| D | 0 | 1870 | 1742 |
| Quadrant | Total seconds | Saturated seconds | Saturation percentage |
|---|---|---|---|
| A | 50 | 0 | 0.000000% |
| B | 65 | 1 | 1.538462% |
| C | 76 | 0 | 0.000000% |
| D | 71 | 1 | 1.408451% |
Noise dominated data is calculated using 1-second bins in cleaned event files. If a bin has >2000 counts, and if more than 50% of those come from <1% of pixels, then it is considered to be noise-dominated and hence unusable.
| Quadrant | # 1 sec bins | Bins with >0 counts | Bins with >2000 counts | High rate bins dominated by noise | Noise dominated (total time) | Noise dominated (detector-on time) | Marked lightcurve |
|---|---|---|---|---|---|---|---|
| A | 2007 | 94 | 0 | 0 | 0.00% | 0.00% | 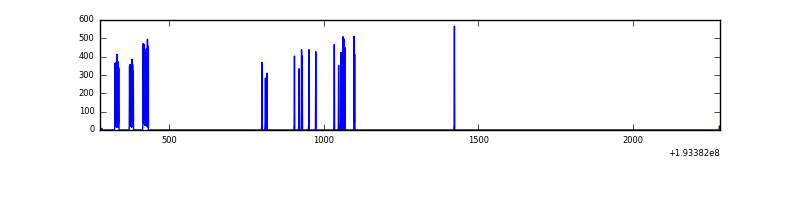 |
| B | 1959 | 121 | 0 | 0 | 0.00% | 0.00% | 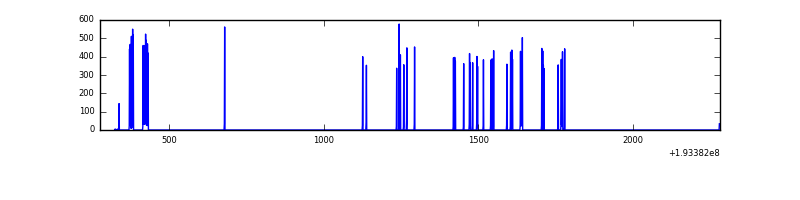 |
| C | 1911 | 147 | 0 | 0 | 0.00% | 0.00% |  |
| D | 1503 | 134 | 0 | 0 | 0.00% | 0.00% | 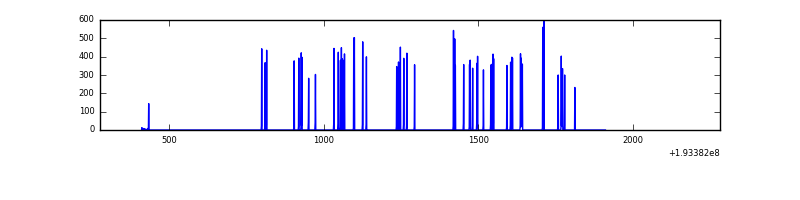 |
Top three noisy pixels from each quadrant. If the there are fewer than three noisy pixels in the level2.evt file, extra rows are filled as -1
| Pixel properties | Quadrant properties | ||||||
|---|---|---|---|---|---|---|---|
| Quadrant | DetID | PixID | Counts | Sigma | Mean | Median | Sigma |
| A | 0 | 199 | 1673 | 777.28 | 4 | 4 | 2.1 |
| A | 11 | 204 | 16 | 5.59 | 4 | 4 | 2.1 |
| A | 4 | 249 | 16 | 5.59 | 4 | 4 | 2.1 |
| B | 0 | 198 | 1916 | 742.21 | 5 | 5 | 2.6 |
| B | 15 | 85 | 453 | 174.0 | 5 | 5 | 2.6 |
| B | 0 | 220 | 253 | 96.32 | 5 | 5 | 2.6 |
| C | 14 | 223 | 288 | 95.69 | 6 | 6 | 2.9 |
| C | 3 | 202 | 22 | 5.43 | 6 | 6 | 2.9 |
| C | 3 | 63 | 21 | 5.09 | 6 | 6 | 2.9 |
| D | 10 | 215 | 837 | 311.06 | 5 | 5 | 2.7 |
| D | 7 | 85 | 595 | 220.59 | 5 | 5 | 2.7 |
| D | 10 | 85 | 358 | 131.98 | 5 | 5 | 2.7 |
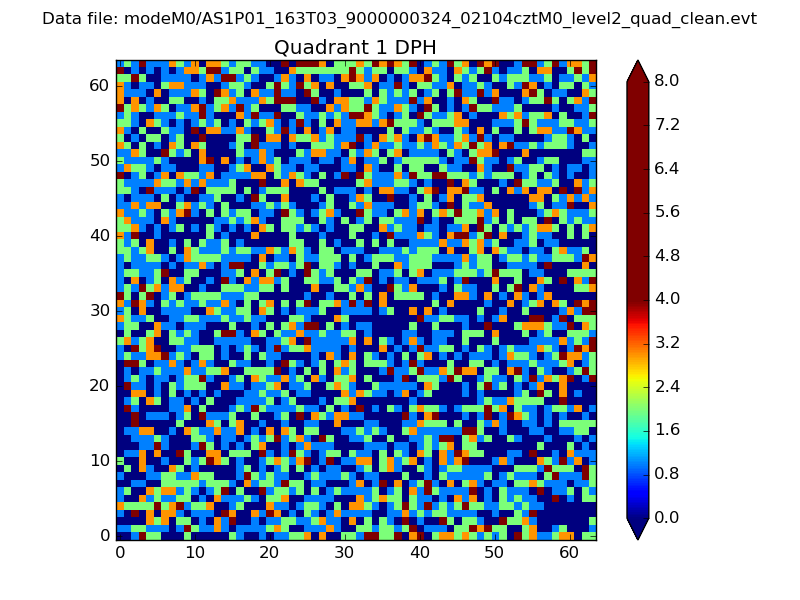
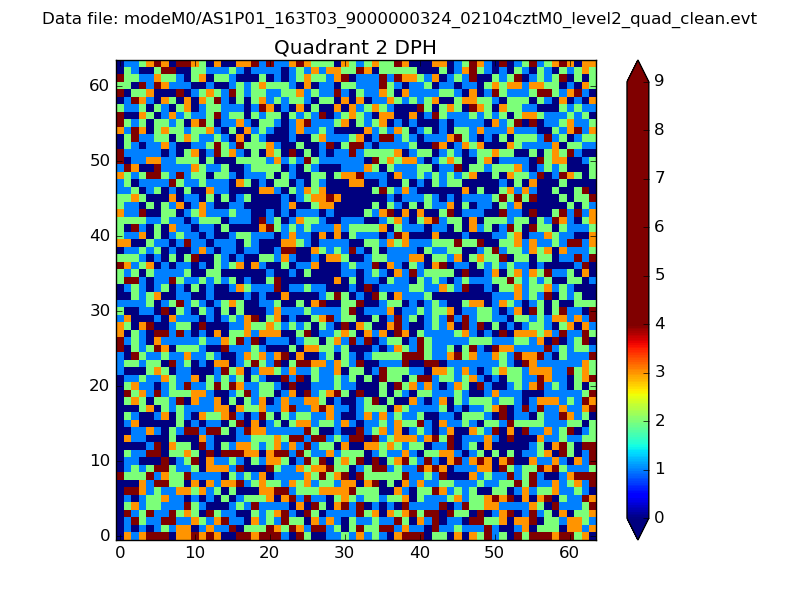
Histogram calculated using DETX and DETY for each event in the final _common_clean file
| Quadrant A |  |
 |
Quadrant B |
|---|---|---|---|
| Quadrant D | 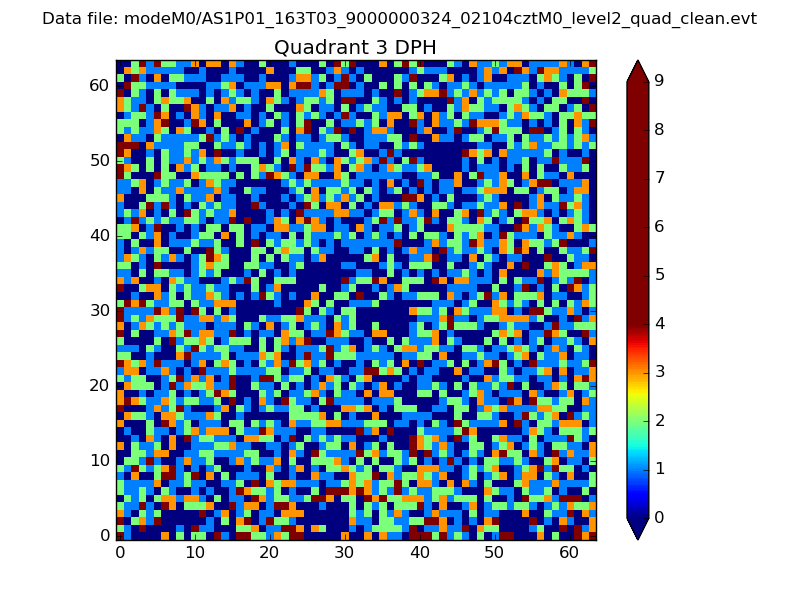 |
 |
Quadrant C |
| Plot type | Count rate plots | Images |
|---|---|---|
| Comparison with Poisson distribution Blue bars denote a histogram of data divided into 1 sec bins. Red curve is a Poisson curve with rate = median count rate of data. |
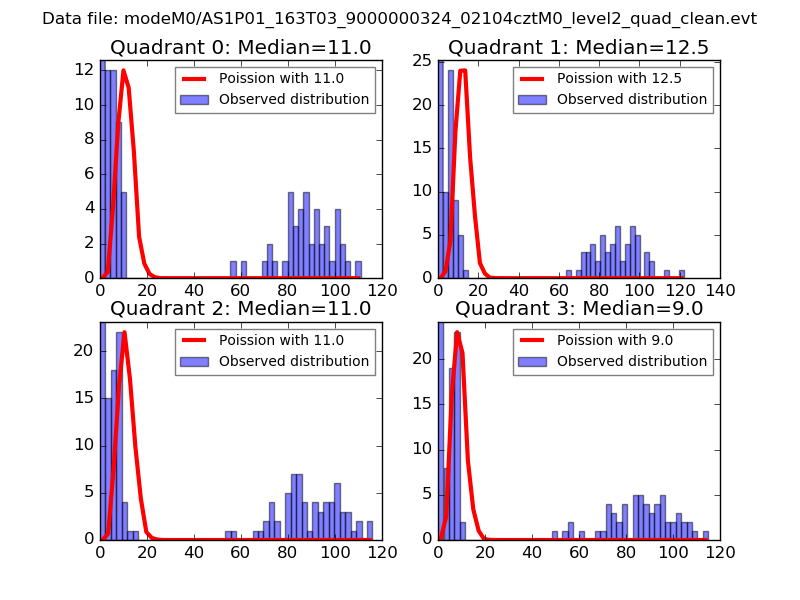 |
 |
| Quadrant-wise count rates Data is divided into 100 sec bins |
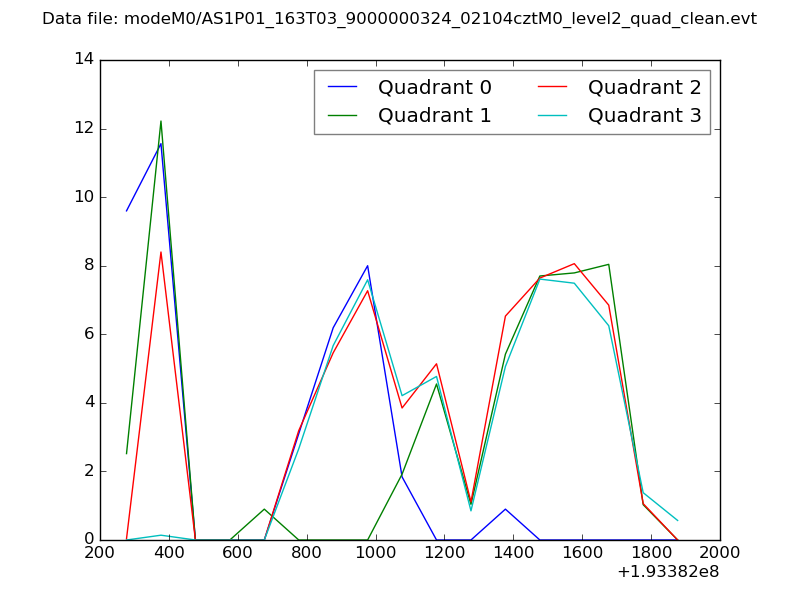 |
|
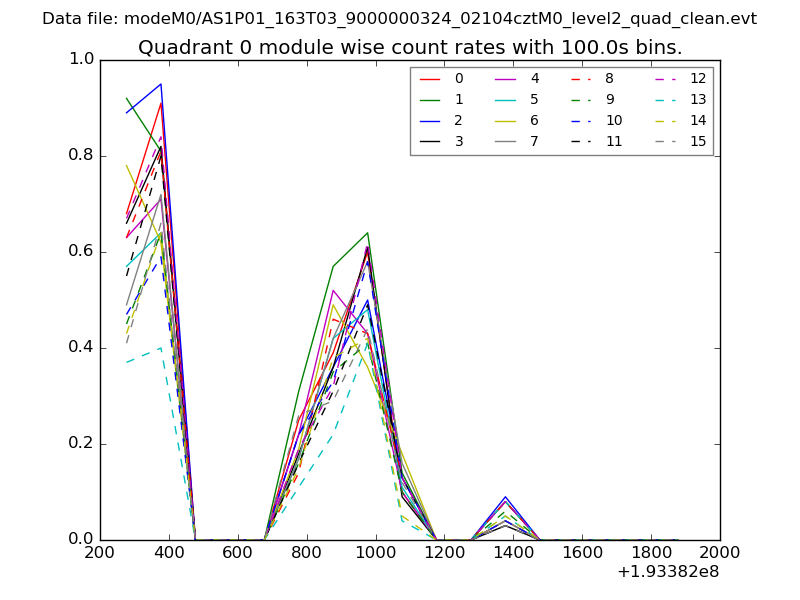
| Module-wise count rates for Quadrant A Data is divided into 100 sec bins |
 |
 |
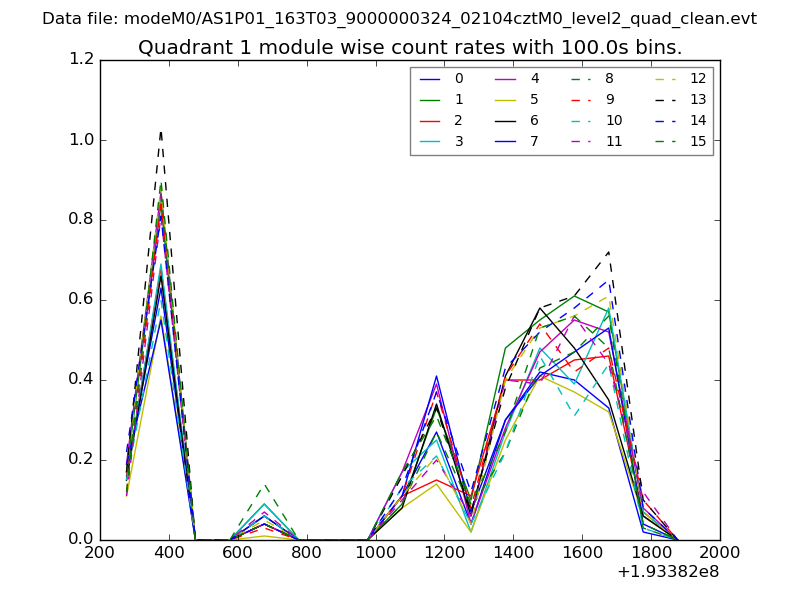
| Module-wise count rates for Quadrant B Data is divided into 100 sec bins |
 |
 |
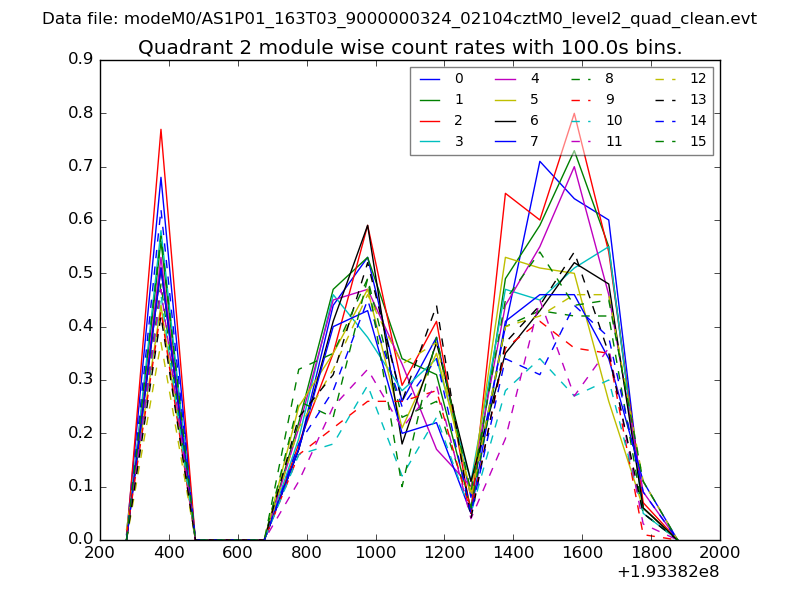
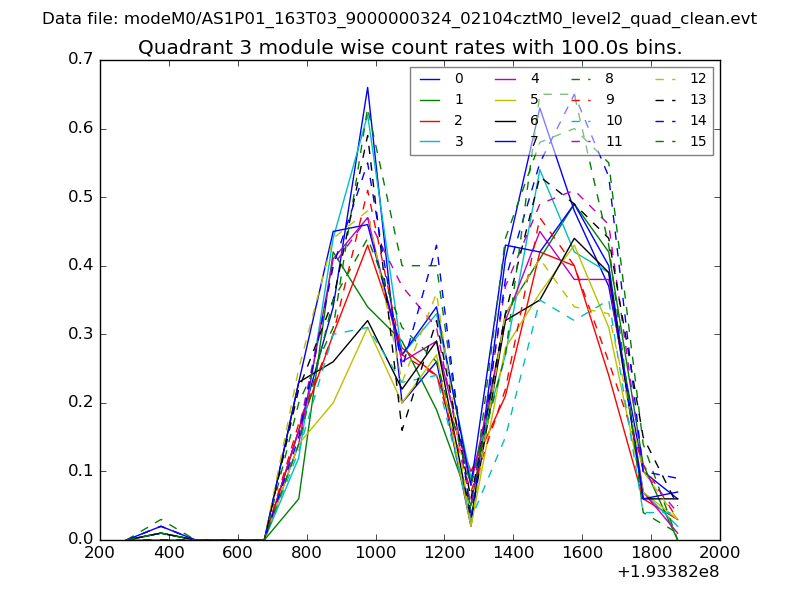
| Module-wise count rates for Quadrant C Data is divided into 100 sec bins |
 |
 |
| Module-wise count rates for Quadrant D Data is divided into 100 sec bins |
 |
 |
| Parameter | Plot |
|---|---|
| CZT HV Monitor | 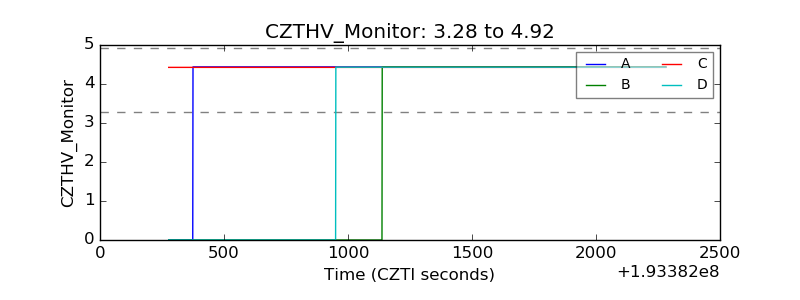 |
| D_VDD | 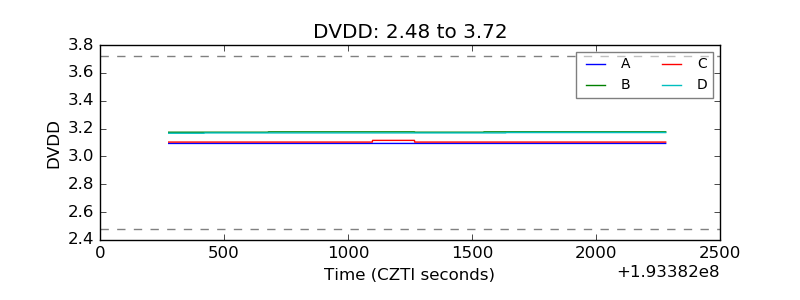 |
| Temperature 1 | 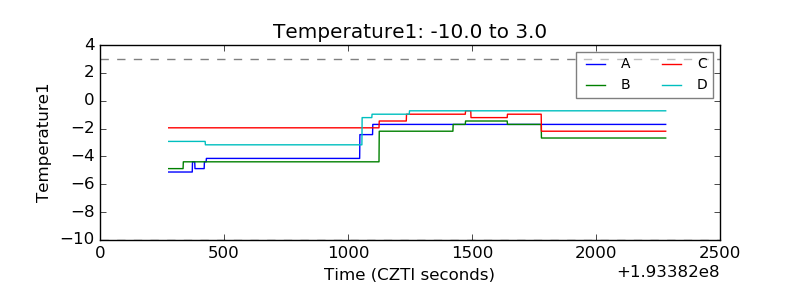 |
| Veto HV Monitor |  |
| Veto LLD | 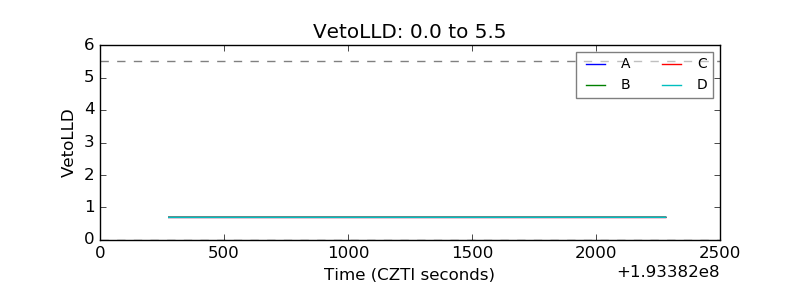 |
| Alpha Counter | 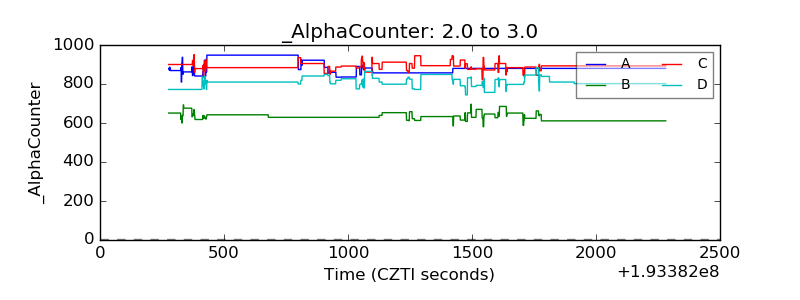 |
| _CPM_Rate | 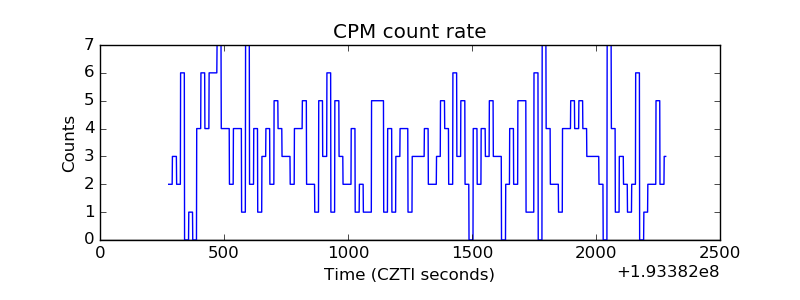 |
| CZT Counter | 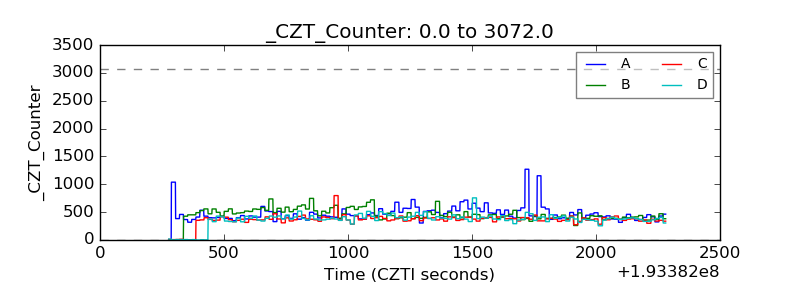 |
| +2.5 Volts monitor |  |
| +5 Volts monitor |  |
| _ROLL_ROT | 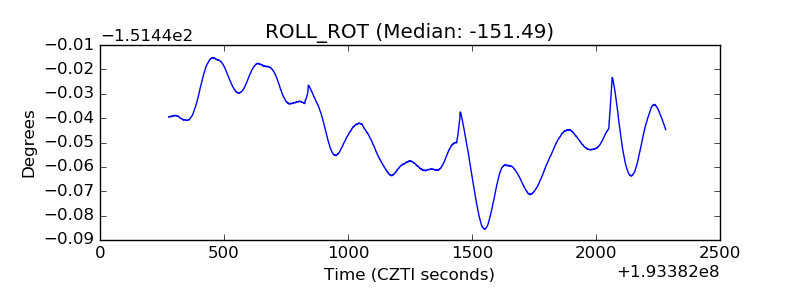 |
| _Roll_DEC | 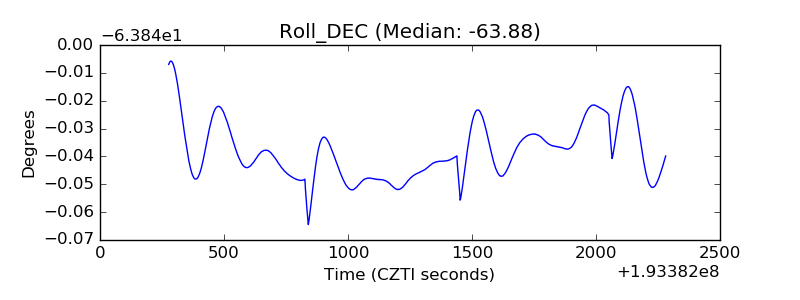 |
| _Roll_RA | 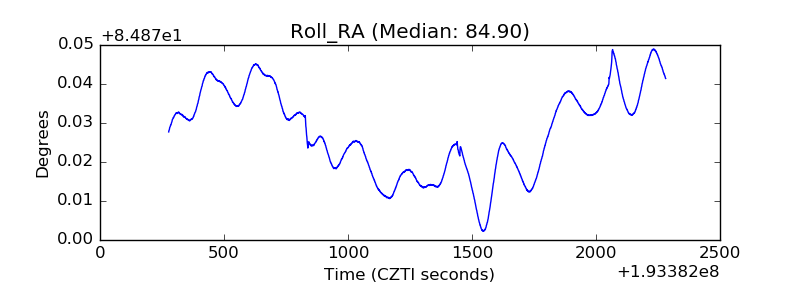 |
| Veto Counter | 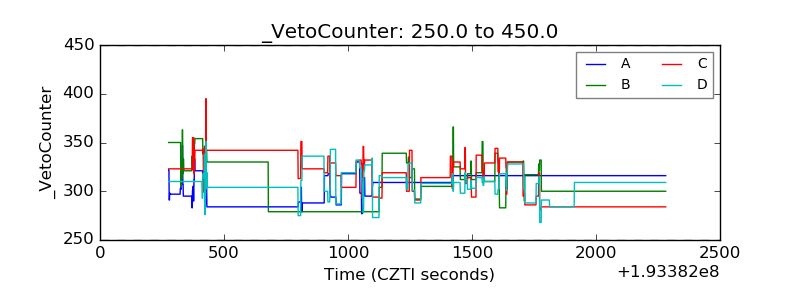 |