| Param | Original file | Final file |
|---|---|---|
| Filename | modeM0/AS1P01_175T02_9000000326cztM0_level2.fits | modeM0/AS1P01_175T02_9000000326cztM0_level2_quad_clean.evt |
| Size (bytes) | 367,027,200 | 502,430,400 |
| Size | 350.0 MB | 479.2 MB |
| Events in quadrant A | 2,106,578 | 3,152,629 |
| Events in quadrant B | 2,121,458 | 3,227,849 |
| Events in quadrant C | 2,093,358 | 3,048,991 |
| Events in quadrant D | 1,809,988 | 2,805,055 |
| Mode M0 | |||
|---|---|---|---|
| Quadrant | BADHDUFLAG | Total packets | Discarded packets |
| A | 0 | 96952 | 0 |
| B | 0 | 90001 | 0 |
| C | 0 | 89942 | 0 |
| D | 0 | 91085 | 0 |
| Mode M9 | |||
|---|---|---|---|
| Quadrant | BADHDUFLAG | Total packets | Discarded packets |
| A | 1 | 139831448885288 | 139831250255918 |
| B | 1 | 139831448885288 | 139831250255918 |
| C | 1 | 139831448885288 | 139831250255918 |
| D | 1 | 139831448885288 | 139831250255918 |
| Mode SS | |||
|---|---|---|---|
| Quadrant | BADHDUFLAG | Total packets | Discarded packets |
| A | 0 | 870 | 0 |
| B | 0 | 870 | 0 |
| C | 0 | 870 | 0 |
| D | 0 | 870 | 0 |
| Quadrant | Total seconds | Saturated seconds | Saturation percentage |
|---|---|---|---|
| A | 43456 | 1180 | 2.715390% |
| B | 43456 | 522 | 1.201215% |
| C | 43456 | 409 | 0.941182% |
| D | 43454 | 456 | 1.049386% |
Noise dominated data is calculated using 1-second bins in cleaned event files. If a bin has >2000 counts, and if more than 50% of those come from <1% of pixels, then it is considered to be noise-dominated and hence unusable.
| Quadrant | # 1 sec bins | Bins with >0 counts | Bins with >2000 counts | High rate bins dominated by noise | Noise dominated (total time) | Noise dominated (detector-on time) | Marked lightcurve |
|---|---|---|---|---|---|---|---|
| A | 49365 | 43455 | 0 | 0 | 0.00% | 0.00% |  |
| B | 49366 | 43455 | 0 | 0 | 0.00% | 0.00% |  |
| C | 49366 | 43455 | 0 | 0 | 0.00% | 0.00% |  |
| D | 49366 | 43452 | 0 | 0 | 0.00% | 0.00% |  |
Top three noisy pixels from each quadrant. If the there are fewer than three noisy pixels in the level2.evt file, extra rows are filled as -1
| Pixel properties | Quadrant properties | ||||||
|---|---|---|---|---|---|---|---|
| Quadrant | DetID | PixID | Counts | Sigma | Mean | Median | Sigma |
| A | 0 | 29 | 1936 | 11.08 | 545 | 510 | 128.7 |
| A | 14 | 188 | 1923 | 10.98 | 545 | 510 | 128.7 |
| A | 7 | 110 | 1856 | 10.46 | 545 | 510 | 128.7 |
| B | 2 | 9 | 1615 | 10.68 | 559 | 531 | 101.5 |
| B | 14 | 254 | 1362 | 8.19 | 559 | 531 | 101.5 |
| B | 10 | 225 | 1348 | 8.05 | 559 | 531 | 101.5 |
| C | 12 | 241 | 1413 | 6.68 | 552 | 511 | 135.0 |
| C | 9 | 242 | 1413 | 6.68 | 552 | 511 | 135.0 |
| C | 3 | 126 | 1344 | 6.17 | 552 | 511 | 135.0 |
| D | 3 | 30 | 1323 | 6.92 | 516 | 471 | 123.2 |
| D | 10 | 189 | 1306 | 6.78 | 516 | 471 | 123.2 |
| D | 1 | 19 | 1302 | 6.75 | 516 | 471 | 123.2 |
Histogram calculated using DETX and DETY for each event in the final _common_clean file
| Quadrant A | 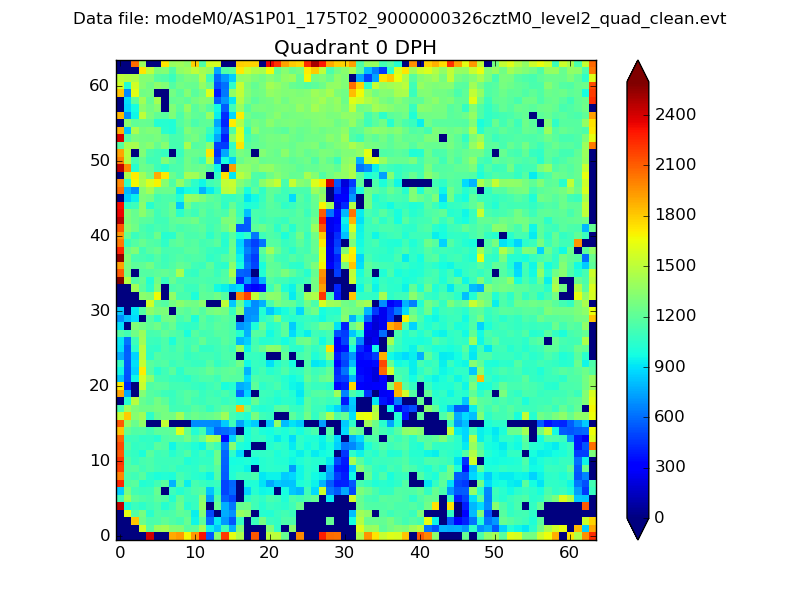 |
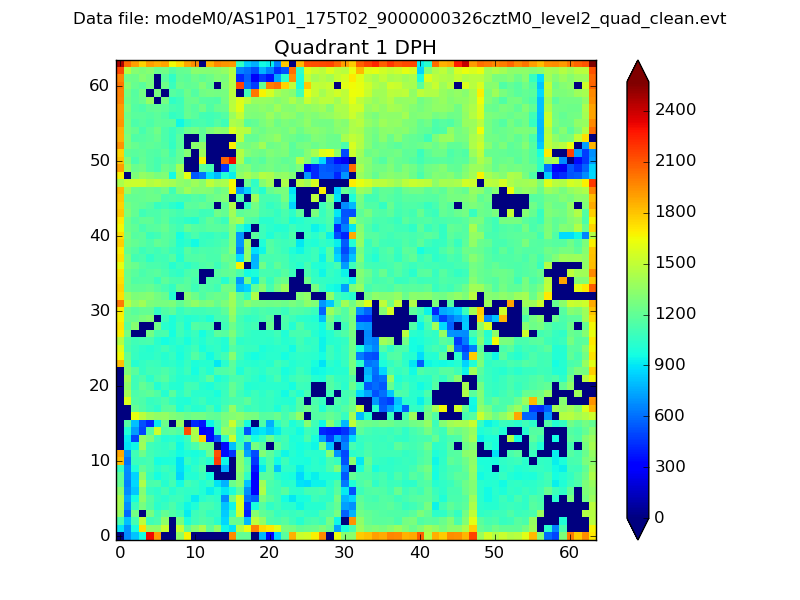 |
Quadrant B |
|---|---|---|---|
| Quadrant D |  |
 |
Quadrant C |
| Plot type | Count rate plots | Images |
|---|---|---|
| Comparison with Poisson distribution Blue bars denote a histogram of data divided into 1 sec bins. Red curve is a Poisson curve with rate = median count rate of data. |
 |
 |
| Quadrant-wise count rates Data is divided into 100 sec bins |
 |
|
| Module-wise count rates for Quadrant A Data is divided into 100 sec bins |
 |
 |
| Module-wise count rates for Quadrant B Data is divided into 100 sec bins |
 |
 |
| Module-wise count rates for Quadrant C Data is divided into 100 sec bins |
 |
 |
| Module-wise count rates for Quadrant D Data is divided into 100 sec bins |
 |
 |
| Parameter | Plot |
|---|---|
| CZT HV Monitor |  |
| D_VDD | 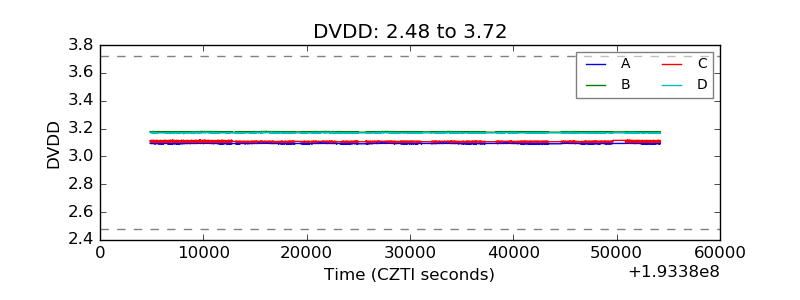 |
| Temperature 1 | 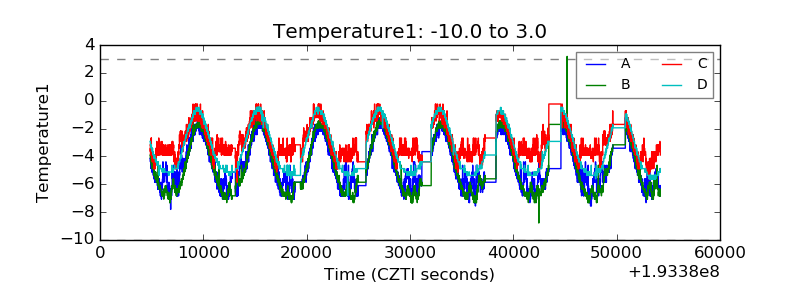 |
| Veto HV Monitor |  |
| Veto LLD |  |
| Alpha Counter |  |
| _CPM_Rate | 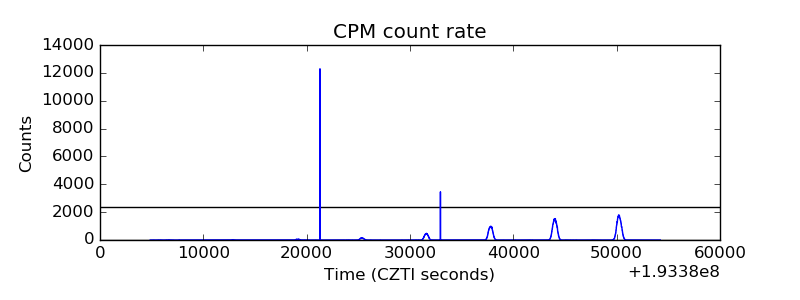 |
| CZT Counter |  |
| +2.5 Volts monitor |  |
| +5 Volts monitor |  |
| _ROLL_ROT |  |
| _Roll_DEC |  |
| _Roll_RA |  |
| Veto Counter | 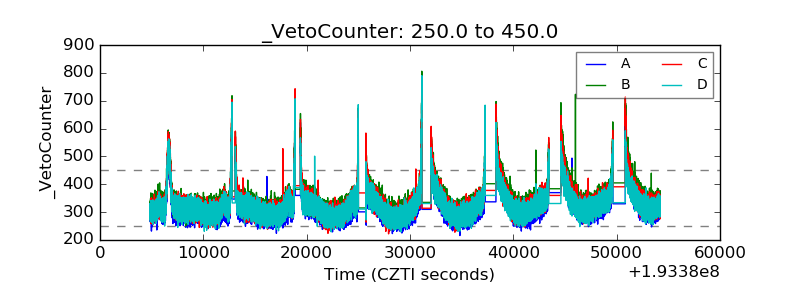 |