| Param | Original file | Final file |
|---|---|---|
| Filename | modeM0/AS1P01_175T02_9000000326_02104cztM0_level2.evt | modeM0/AS1P01_175T02_9000000326_02104cztM0_level2_quad_clean.evt |
| Size (bytes) | 232,640,640 | 61,675,200 |
| Size | 221.9 MB | 58.8 MB |
| Events in quadrant A | 1,660,712 | 409,086 |
| Events in quadrant B | 1,695,888 | 418,316 |
| Events in quadrant C | 1,818,814 | 399,122 |
| Events in quadrant D | 1,627,260 | 389,988 |
| Mode M0 | |||
|---|---|---|---|
| Quadrant | BADHDUFLAG | Total packets | Discarded packets |
| A | 0 | 7620 | 1 |
| B | 0 | 7650 | 0 |
| C | 0 | 8124 | 0 |
| D | 0 | 7824 | 0 |
| Mode SS | |||
|---|---|---|---|
| Quadrant | BADHDUFLAG | Total packets | Discarded packets |
| A | 0 | 70 | 0 |
| B | 0 | 70 | 0 |
| C | 0 | 70 | 0 |
| D | 0 | 70 | 0 |
| Quadrant | Total seconds | Saturated seconds | Saturation percentage |
|---|---|---|---|
| A | 3546 | 152 | 4.286520% |
| B | 3546 | 132 | 3.722504% |
| C | 3546 | 115 | 3.243091% |
| D | 3546 | 91 | 2.566272% |
Noise dominated data is calculated using 1-second bins in cleaned event files. If a bin has >2000 counts, and if more than 50% of those come from <1% of pixels, then it is considered to be noise-dominated and hence unusable.
| Quadrant | # 1 sec bins | Bins with >0 counts | Bins with >2000 counts | High rate bins dominated by noise | Noise dominated (total time) | Noise dominated (detector-on time) | Marked lightcurve |
|---|---|---|---|---|---|---|---|
| A | 3546 | 3546 | 0 | 0 | 0.00% | 0.00% | 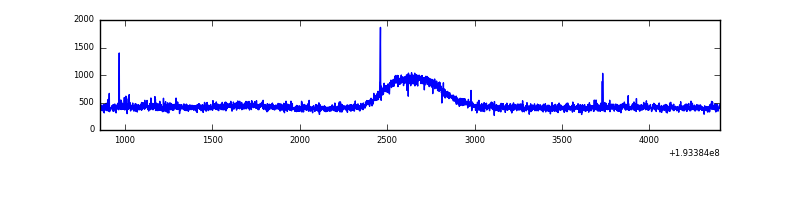 |
| B | 3546 | 3546 | 0 | 0 | 0.00% | 0.00% | 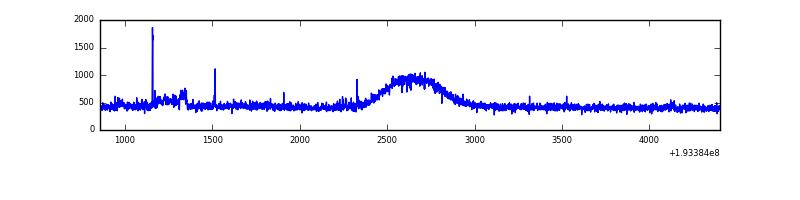 |
| C | 3546 | 3546 | 21 | 21 | 0.59% | 0.59% | 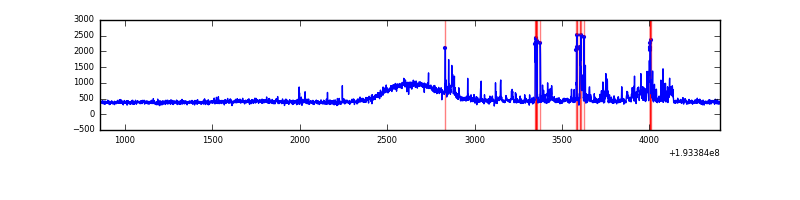 |
| D | 3546 | 3546 | 2 | 2 | 0.06% | 0.06% | 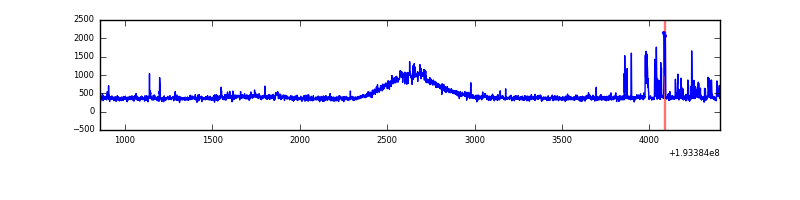 |
Top three noisy pixels from each quadrant. If the there are fewer than three noisy pixels in the level2.evt file, extra rows are filled as -1
| Pixel properties | Quadrant properties | ||||||
|---|---|---|---|---|---|---|---|
| Quadrant | DetID | PixID | Counts | Sigma | Mean | Median | Sigma |
| A | 15 | 236 | 56624 | 670.93 | 412 | 404 | 83.8 |
| A | 0 | 199 | 13751 | 159.28 | 412 | 404 | 83.8 |
| A | 10 | 2 | 2867 | 29.39 | 412 | 404 | 83.8 |
| B | 0 | 198 | 31279 | 384.32 | 428 | 417 | 80.3 |
| B | 4 | 48 | 10548 | 126.16 | 428 | 417 | 80.3 |
| B | 5 | 68 | 8632 | 102.3 | 428 | 417 | 80.3 |
| C | 10 | 82 | 211903 | 2323.67 | 405 | 404 | 91.0 |
| C | 14 | 48 | 10099 | 106.52 | 405 | 404 | 91.0 |
| C | 10 | 65 | 5344 | 54.27 | 405 | 404 | 91.0 |
| D | 10 | 215 | 92601 | 1014.09 | 398 | 386 | 90.9 |
| D | 11 | 135 | 13650 | 145.86 | 398 | 386 | 90.9 |
| D | 2 | 32 | 6603 | 68.37 | 398 | 386 | 90.9 |
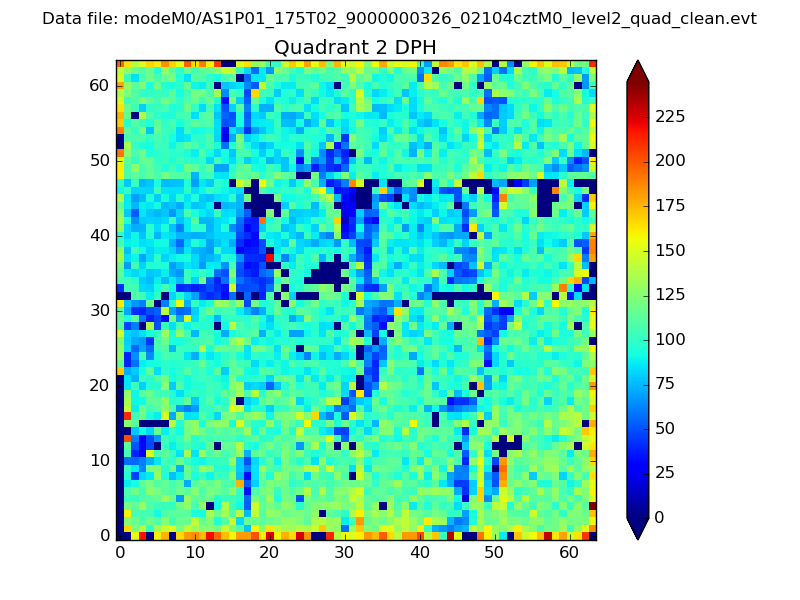
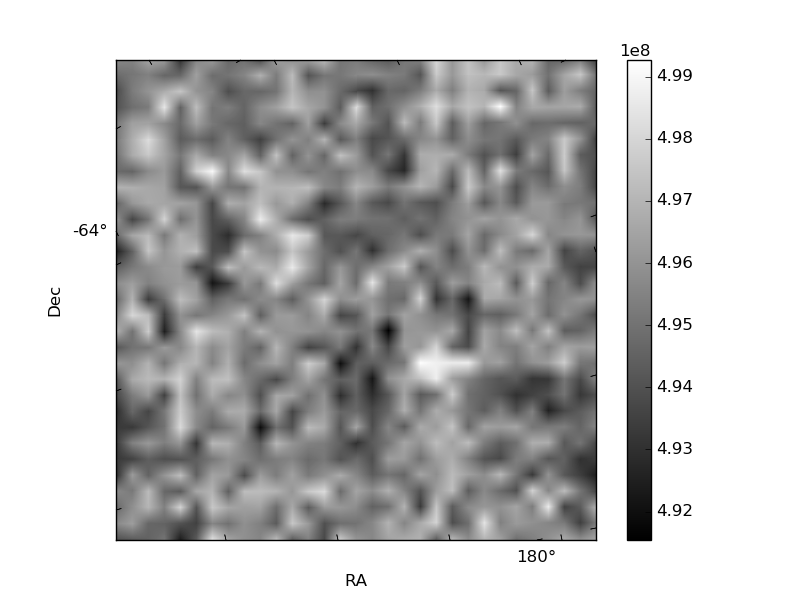
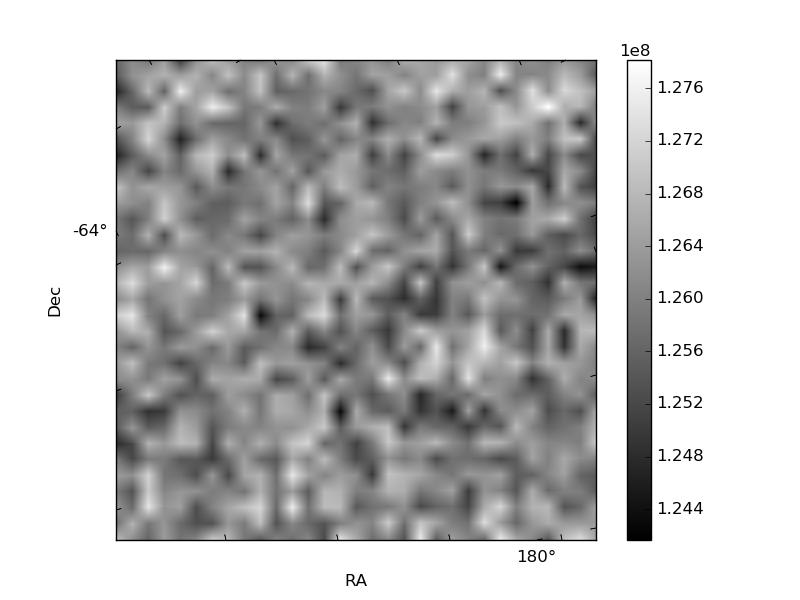
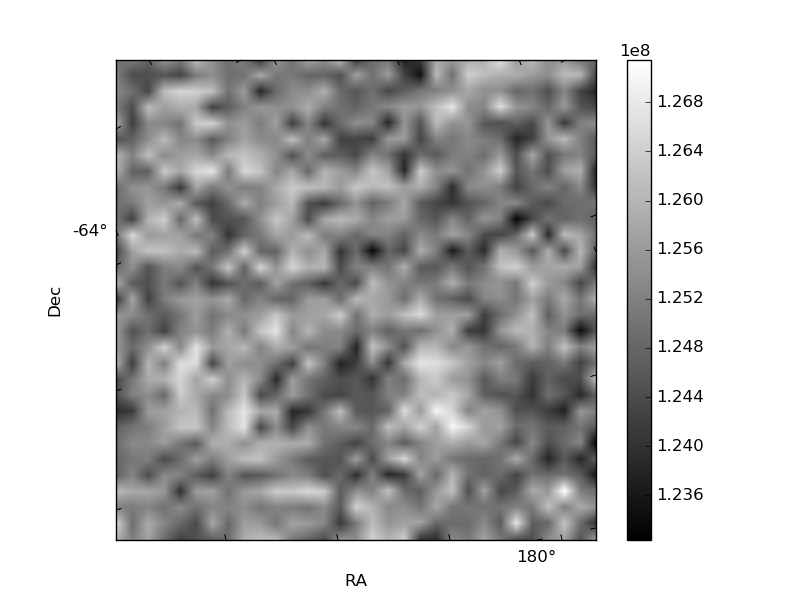
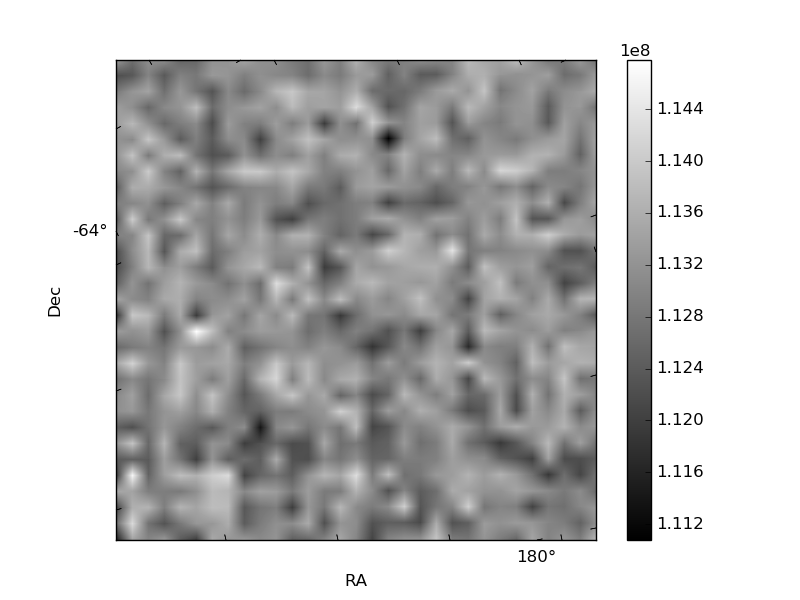
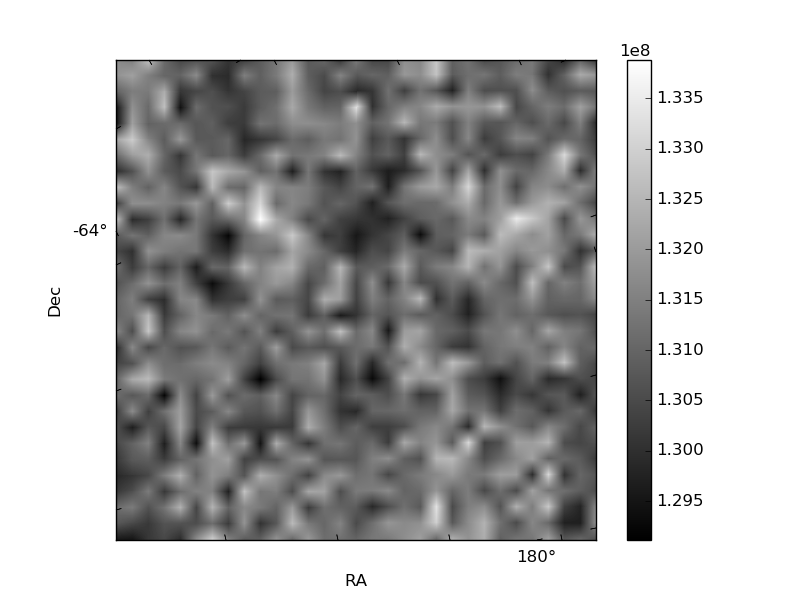
Histogram calculated using DETX and DETY for each event in the final _common_clean file
| Quadrant A | 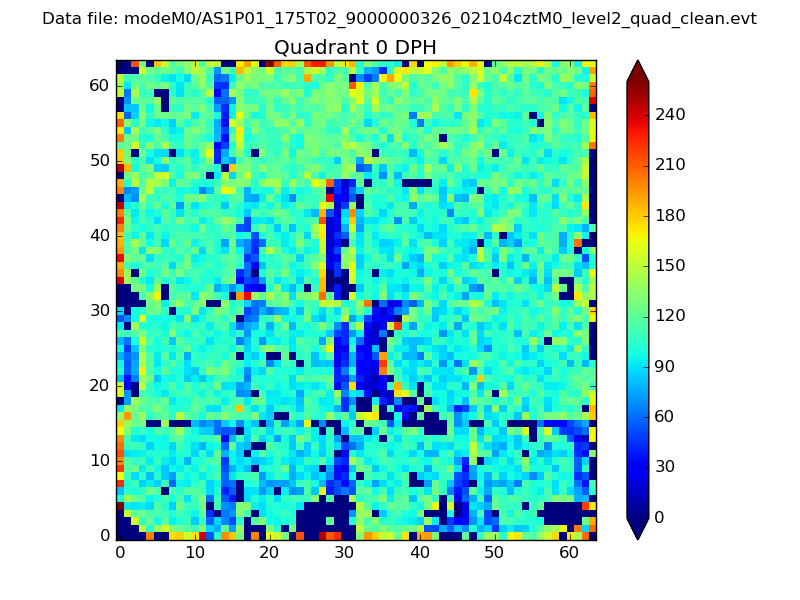 |
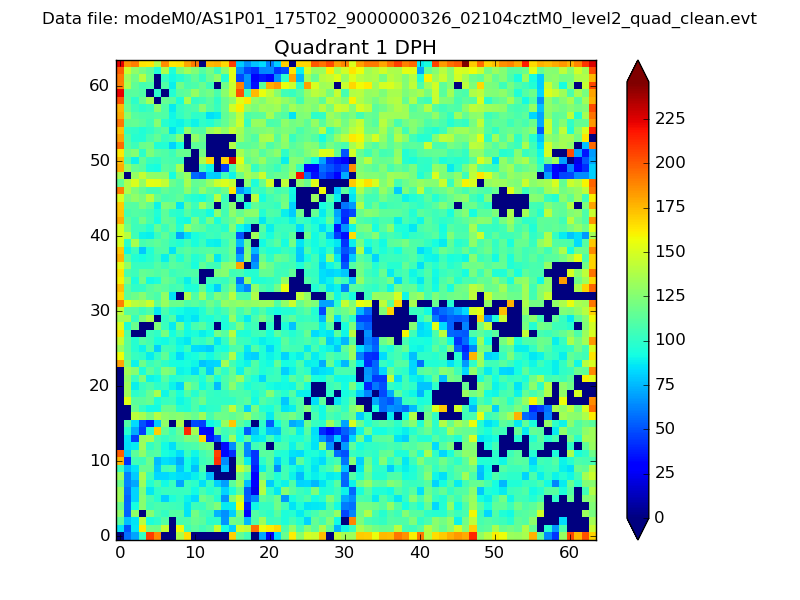 |
Quadrant B |
|---|---|---|---|
| Quadrant D | 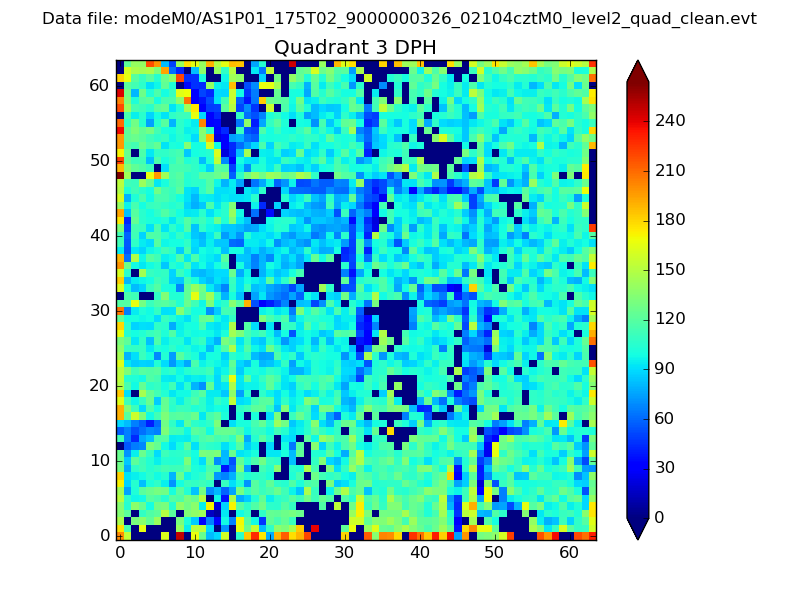 |
 |
Quadrant C |
| Plot type | Count rate plots | Images |
|---|---|---|
| Comparison with Poisson distribution Blue bars denote a histogram of data divided into 1 sec bins. Red curve is a Poisson curve with rate = median count rate of data. |
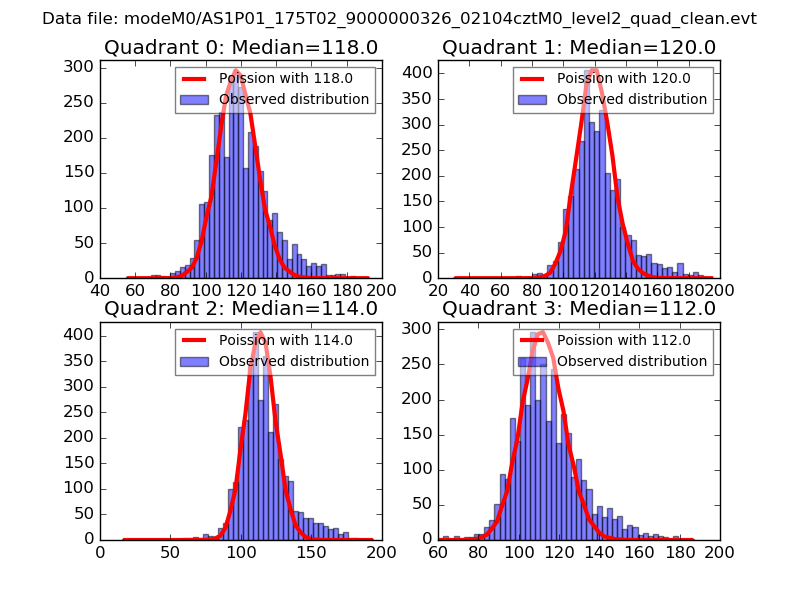 |
 |
| Quadrant-wise count rates Data is divided into 100 sec bins |
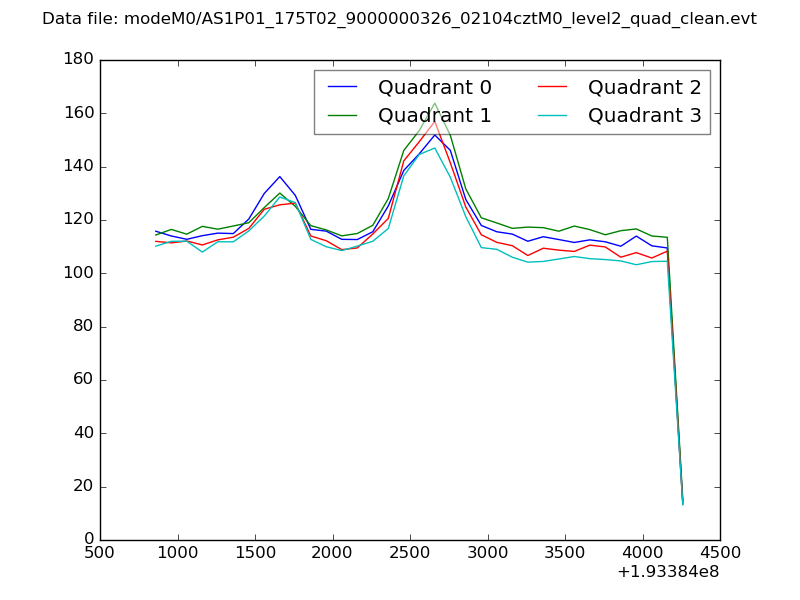 |
|
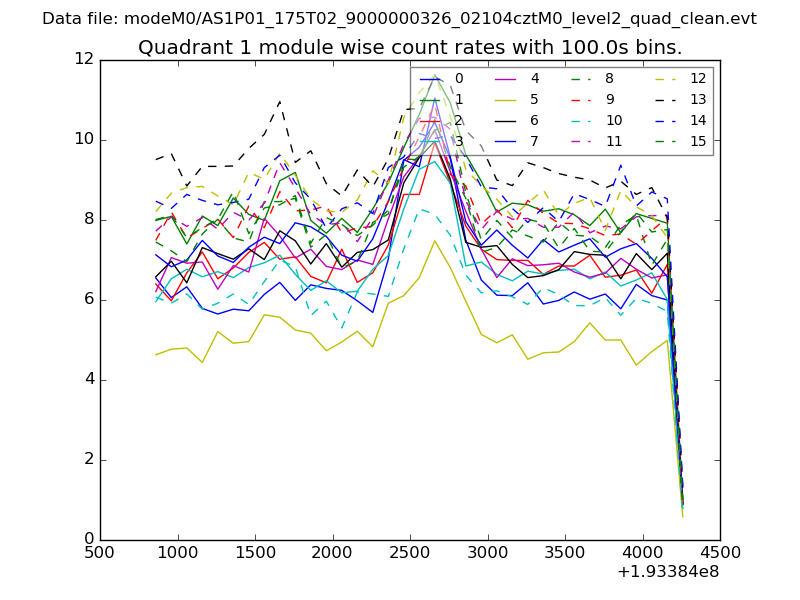
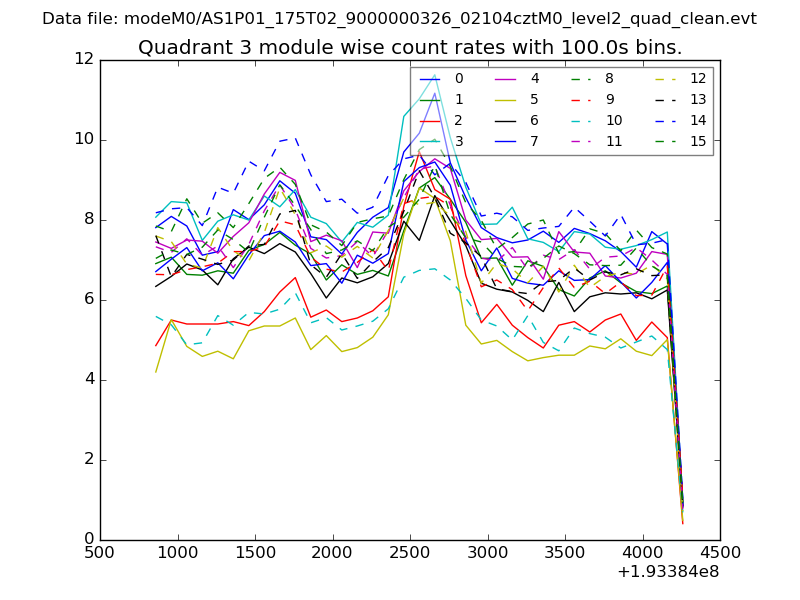
| Module-wise count rates for Quadrant A Data is divided into 100 sec bins |
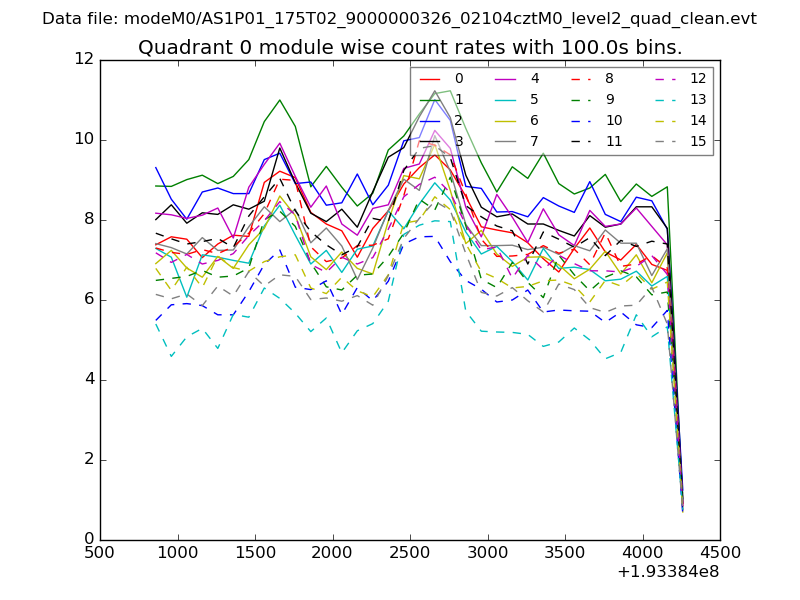 |
 |
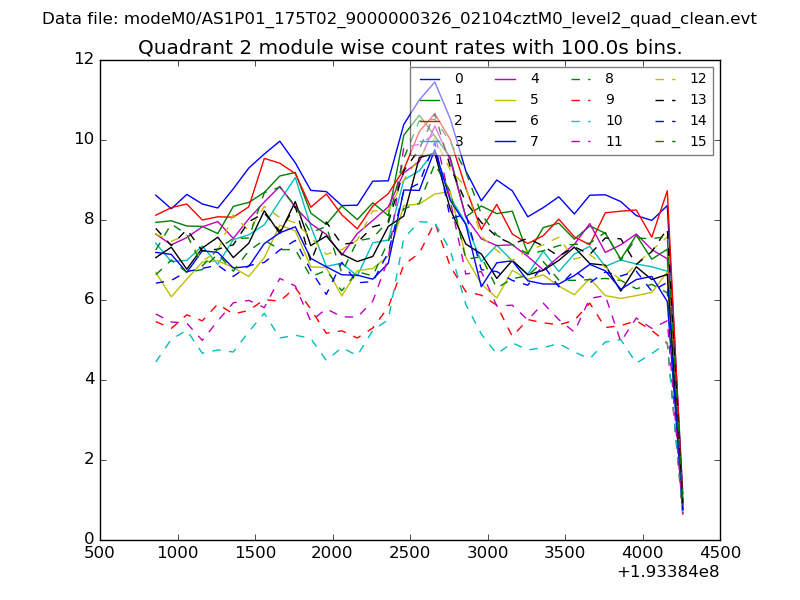
| Module-wise count rates for Quadrant B Data is divided into 100 sec bins |
 |
 |
| Module-wise count rates for Quadrant C Data is divided into 100 sec bins |
 |
 |
| Module-wise count rates for Quadrant D Data is divided into 100 sec bins |
 |
 |
| Parameter | Plot |
|---|---|
| CZT HV Monitor | 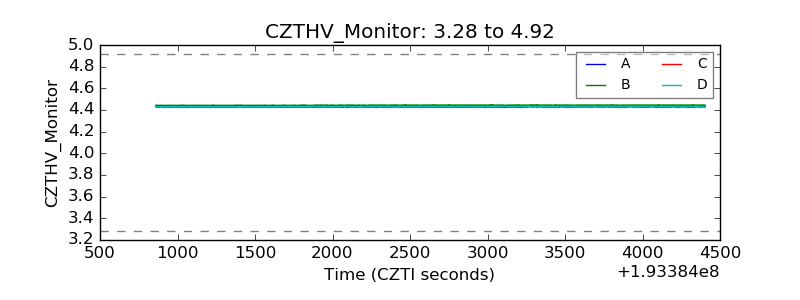 |
| D_VDD | 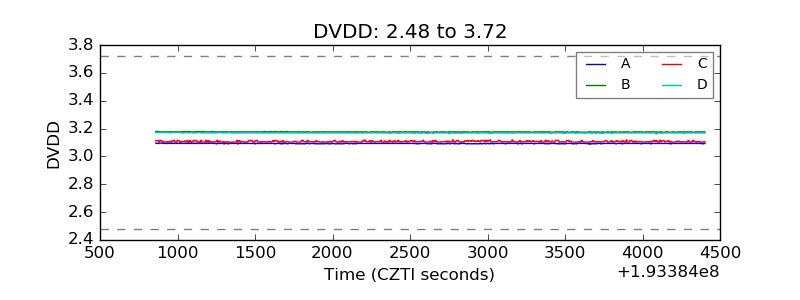 |
| Temperature 1 | 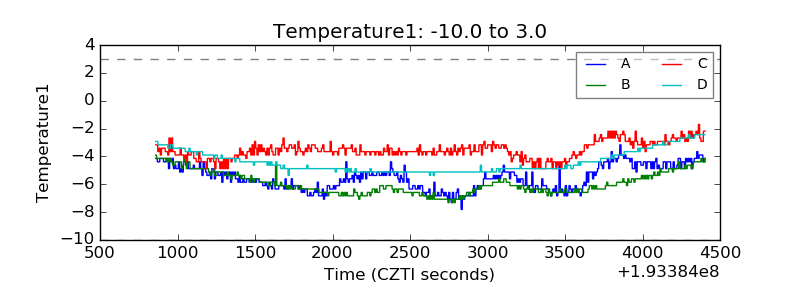 |
| Veto HV Monitor | 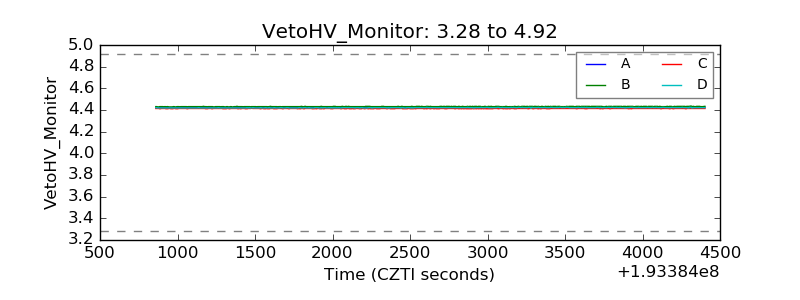 |
| Veto LLD | 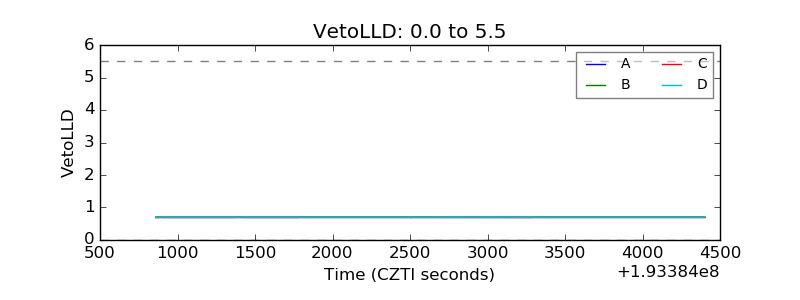 |
| Alpha Counter | 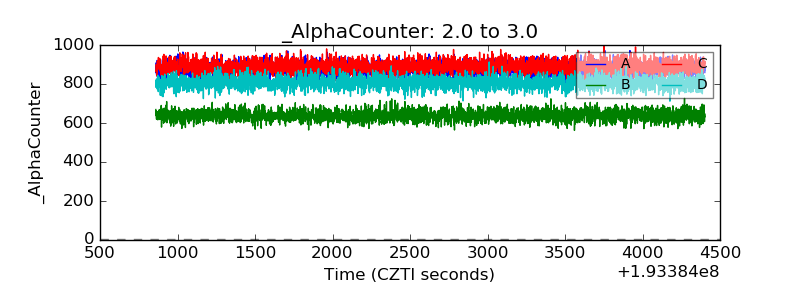 |
| _CPM_Rate | 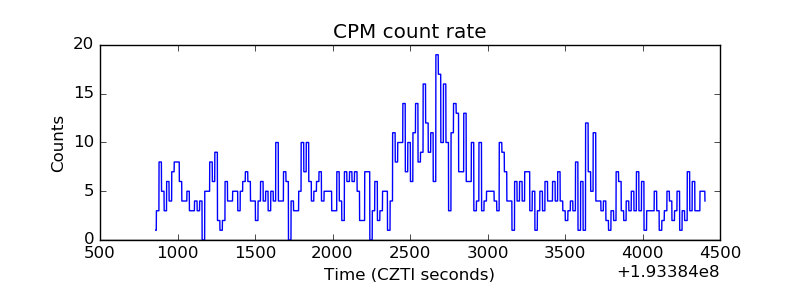 |
| CZT Counter | 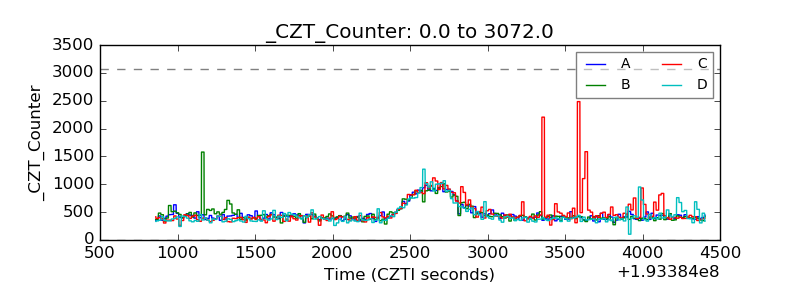 |
| +2.5 Volts monitor | 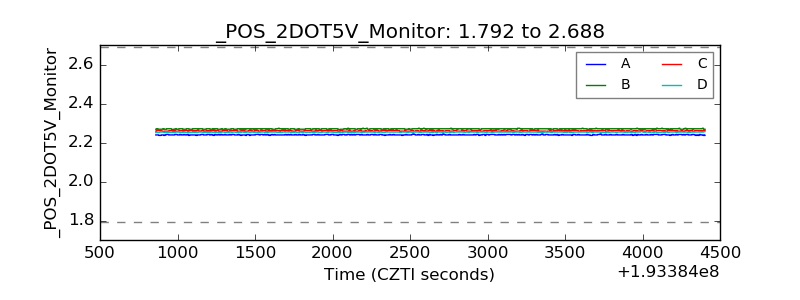 |
| +5 Volts monitor |  |
| _ROLL_ROT | 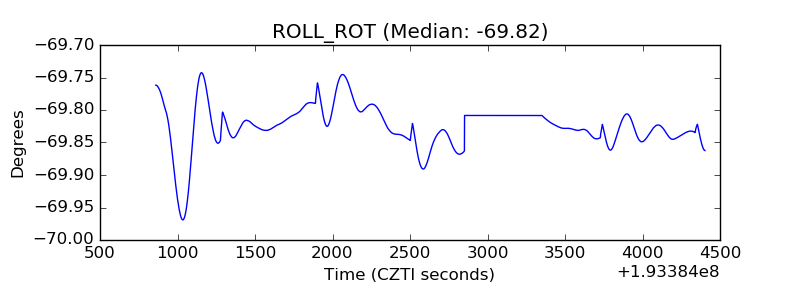 |
| _Roll_DEC | 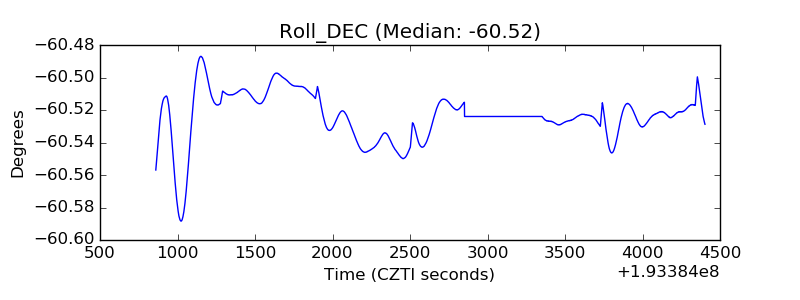 |
| _Roll_RA | 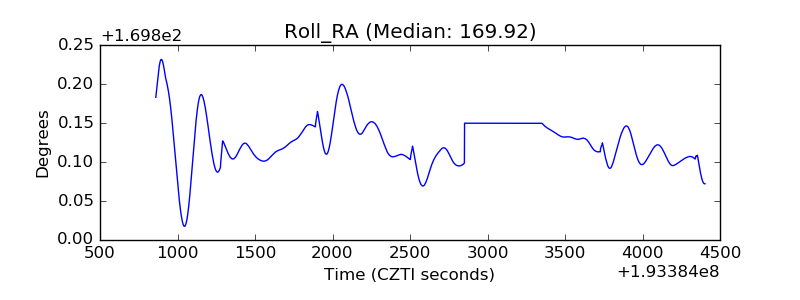 |
| Veto Counter | 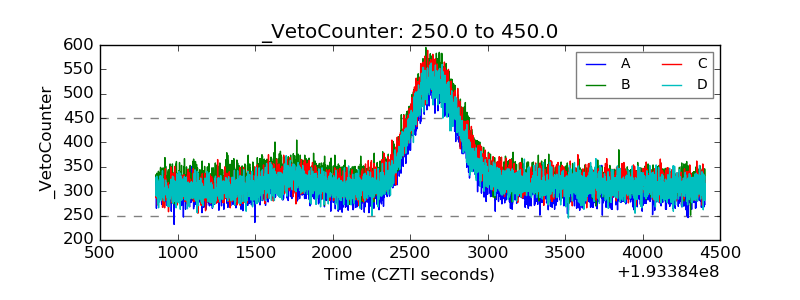 |