| Param | Original file | Final file |
|---|---|---|
| Filename | modeM0/AS1SLEW_01234_9000000325_02104cztM0_level2.evt | modeM0/AS1SLEW_01234_9000000325_02104cztM0_level2_quad_clean.evt |
| Size (bytes) | 31,060,800 | 8,942,400 |
| Size | 29.6 MB | 8.5 MB |
| Events in quadrant A | 226,693 | 56,484 |
| Events in quadrant B | 241,053 | 55,994 |
| Events in quadrant C | 220,453 | 55,238 |
| Events in quadrant D | 209,557 | 54,486 |
| Mode SS | |||
|---|---|---|---|
| Quadrant | BADHDUFLAG | Total packets | Discarded packets |
| A | 0 | 12 | 0 |
| B | 0 | 12 | 0 |
| C | 0 | 12 | 0 |
| D | 0 | 12 | 0 |
| Mode M0 | |||
|---|---|---|---|
| Quadrant | BADHDUFLAG | Total packets | Discarded packets |
| A | 0 | 1149 | 0 |
| B | 0 | 1152 | 0 |
| C | 0 | 1169 | 0 |
| D | 0 | 1152 | 0 |
| Quadrant | Total seconds | Saturated seconds | Saturation percentage |
|---|---|---|---|
| A | 574 | 1 | 0.174216% |
| B | 574 | 0 | 0.000000% |
| C | 574 | 1 | 0.174216% |
| D | 574 | 0 | 0.000000% |
Noise dominated data is calculated using 1-second bins in cleaned event files. If a bin has >2000 counts, and if more than 50% of those come from <1% of pixels, then it is considered to be noise-dominated and hence unusable.
| Quadrant | # 1 sec bins | Bins with >0 counts | Bins with >2000 counts | High rate bins dominated by noise | Noise dominated (total time) | Noise dominated (detector-on time) | Marked lightcurve |
|---|---|---|---|---|---|---|---|
| A | 574 | 574 | 0 | 0 | 0.00% | 0.00% | 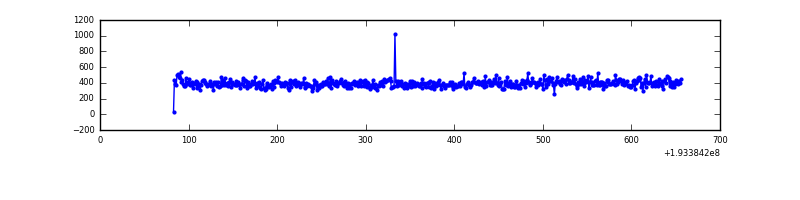 |
| B | 574 | 574 | 0 | 0 | 0.00% | 0.00% | 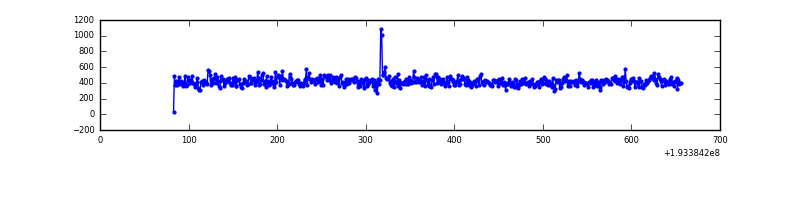 |
| C | 574 | 574 | 1 | 1 | 0.17% | 0.17% | 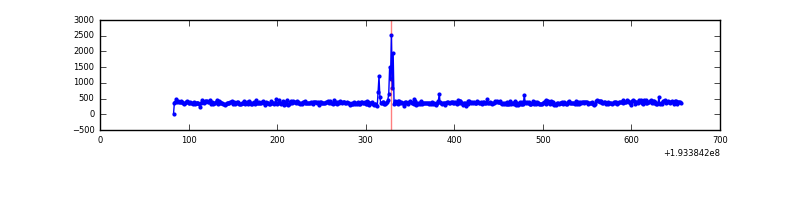 |
| D | 574 | 574 | 0 | 0 | 0.00% | 0.00% | 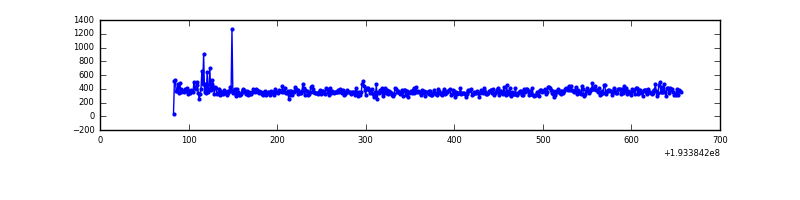 |
Top three noisy pixels from each quadrant. If the there are fewer than three noisy pixels in the level2.evt file, extra rows are filled as -1
| Pixel properties | Quadrant properties | ||||||
|---|---|---|---|---|---|---|---|
| Quadrant | DetID | PixID | Counts | Sigma | Mean | Median | Sigma |
| A | 10 | 2 | 1950 | 138.28 | 57 | 56 | 13.7 |
| A | 0 | 199 | 1677 | 118.35 | 57 | 56 | 13.7 |
| A | 0 | 128 | 191 | 9.86 | 57 | 56 | 13.7 |
| B | 0 | 220 | 5419 | 413.98 | 58 | 57 | 13.0 |
| B | 5 | 68 | 3437 | 260.96 | 58 | 57 | 13.0 |
| B | 5 | 189 | 3015 | 228.38 | 58 | 57 | 13.0 |
| C | 14 | 223 | 8414 | 598.97 | 54 | 53 | 14.0 |
| C | 3 | 202 | 140 | 6.2 | 54 | 53 | 14.0 |
| C | 3 | 11 | 139 | 6.13 | 54 | 53 | 14.0 |
| D | 2 | 32 | 4242 | 300.27 | 53 | 52 | 14.0 |
| D | 10 | 166 | 984 | 66.79 | 53 | 52 | 14.0 |
| D | 2 | 206 | 549 | 35.62 | 53 | 52 | 14.0 |
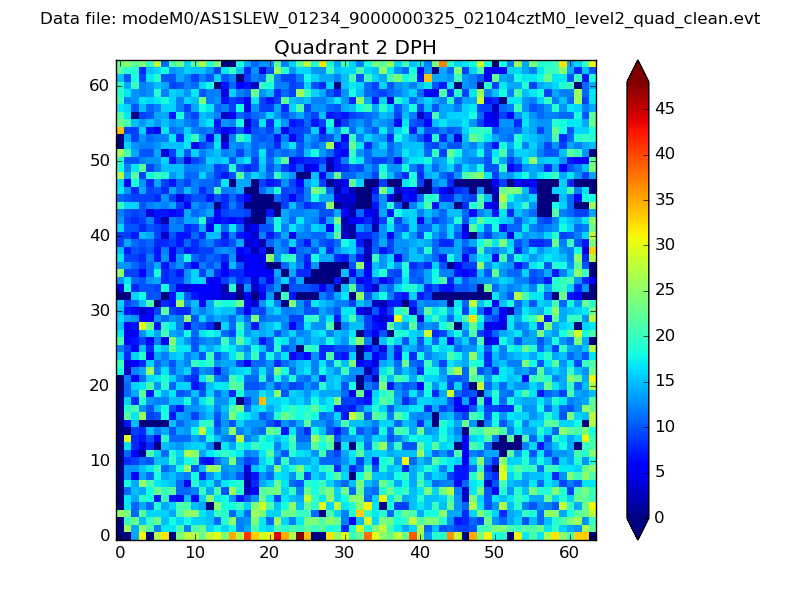
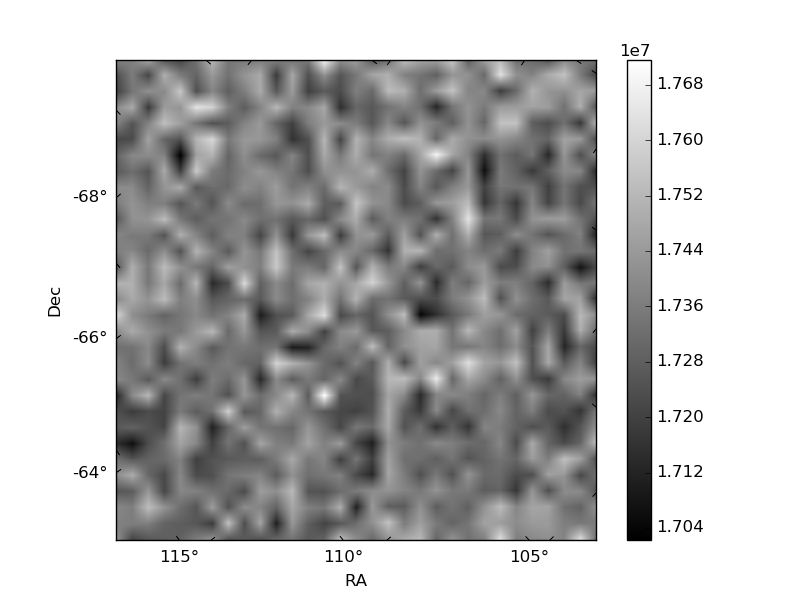
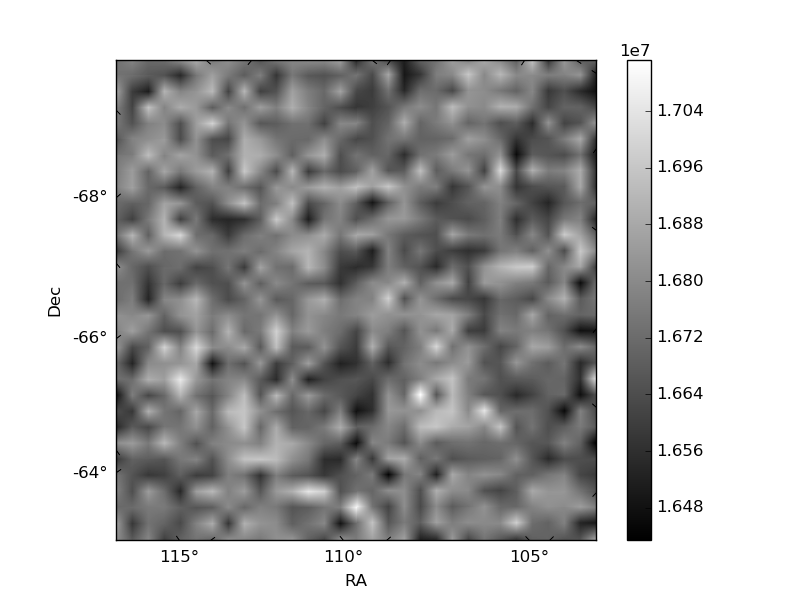
Histogram calculated using DETX and DETY for each event in the final _common_clean file
| Quadrant A | 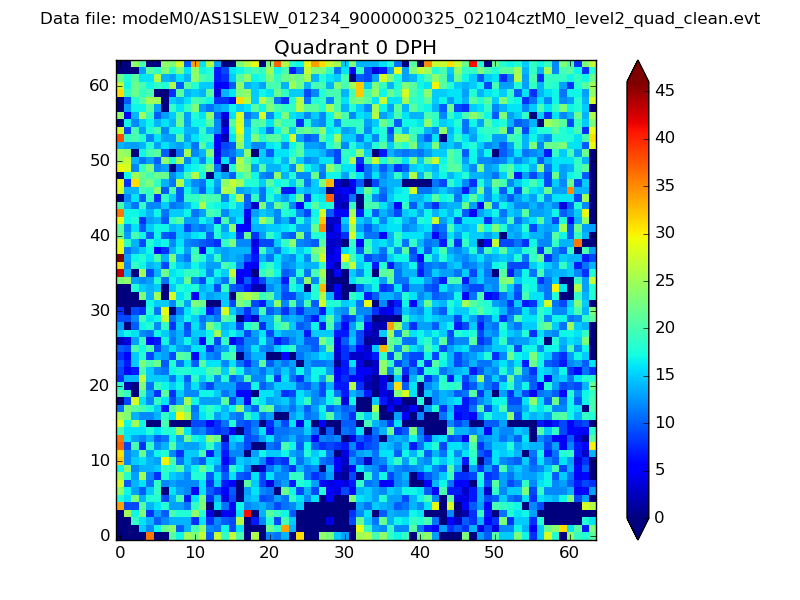 |
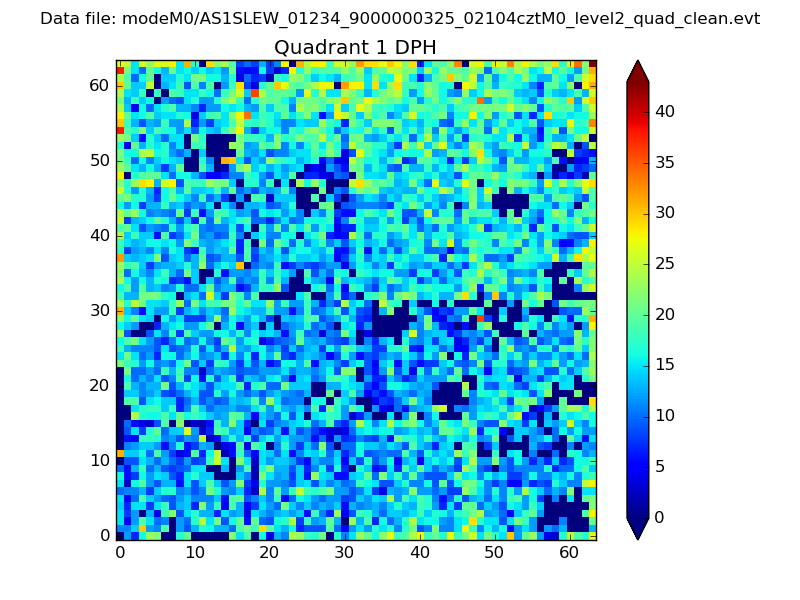 |
Quadrant B |
|---|---|---|---|
| Quadrant D | 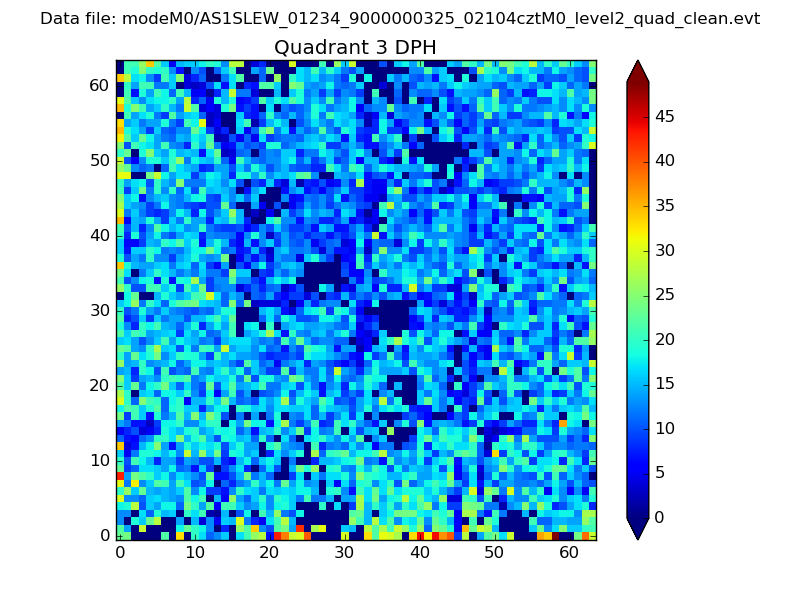 |
 |
Quadrant C |
| Plot type | Count rate plots | Images |
|---|---|---|
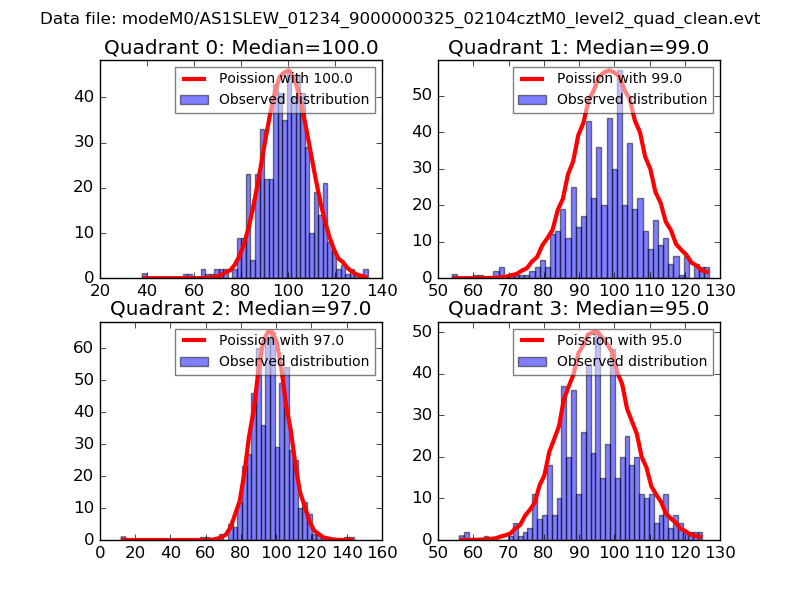
| Comparison with Poisson distribution Blue bars denote a histogram of data divided into 1 sec bins. Red curve is a Poisson curve with rate = median count rate of data. |
 |
 |
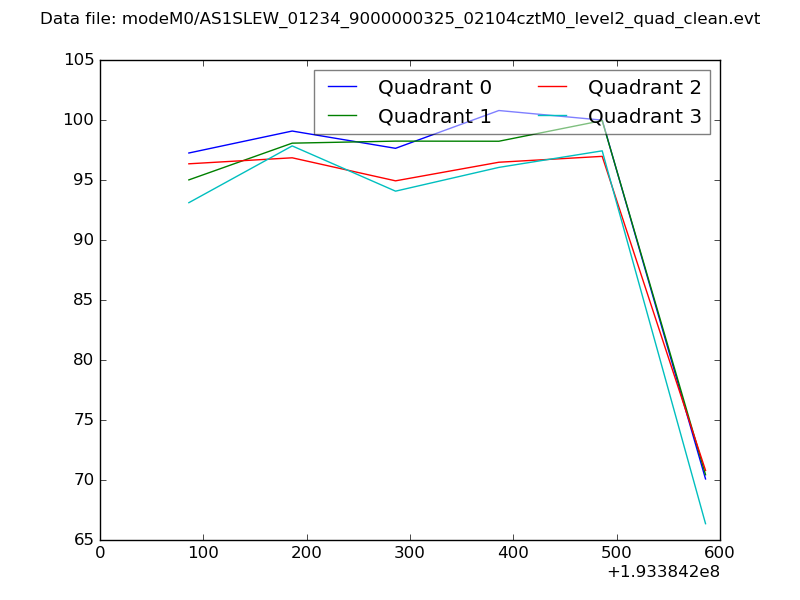
| Quadrant-wise count rates Data is divided into 100 sec bins |
 |
|
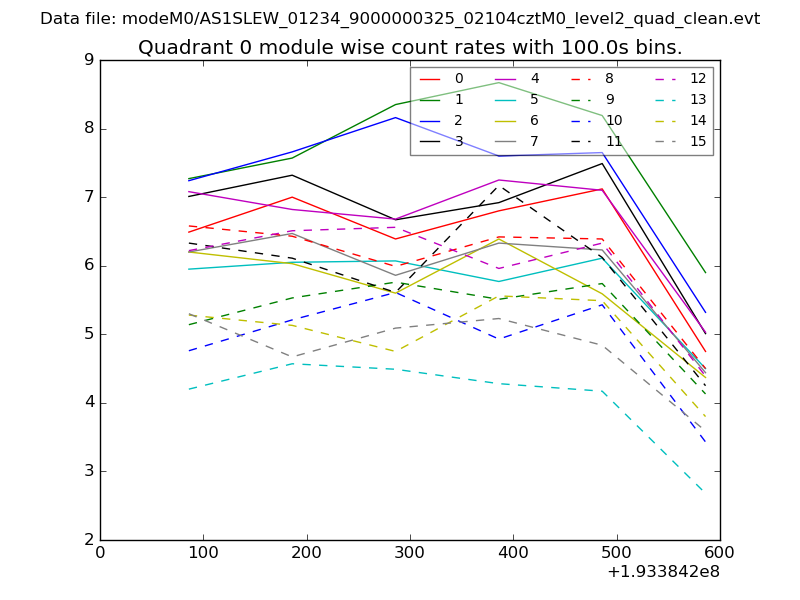
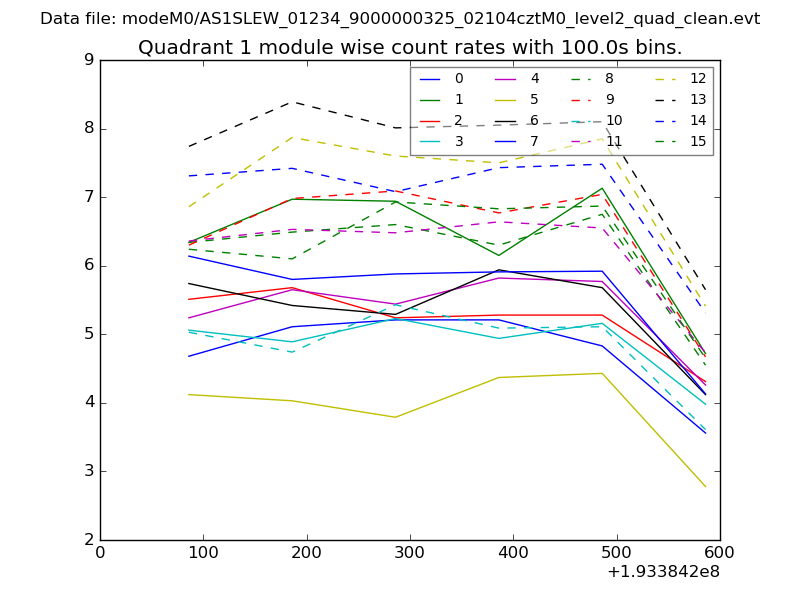
| Module-wise count rates for Quadrant A Data is divided into 100 sec bins |
 |
 |
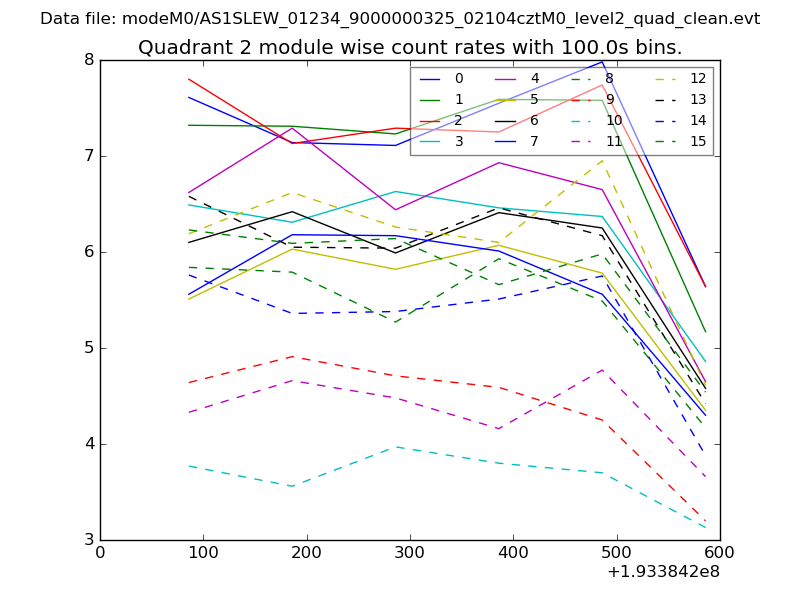
| Module-wise count rates for Quadrant B Data is divided into 100 sec bins |
 |
 |
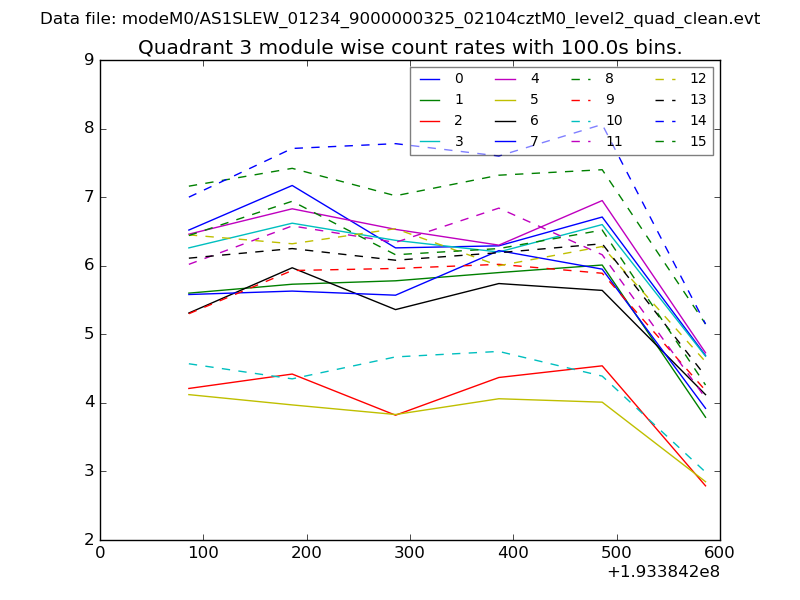
| Module-wise count rates for Quadrant C Data is divided into 100 sec bins |
 |
 |
| Module-wise count rates for Quadrant D Data is divided into 100 sec bins |
 |
 |
| Parameter | Plot |
|---|---|
| CZT HV Monitor | 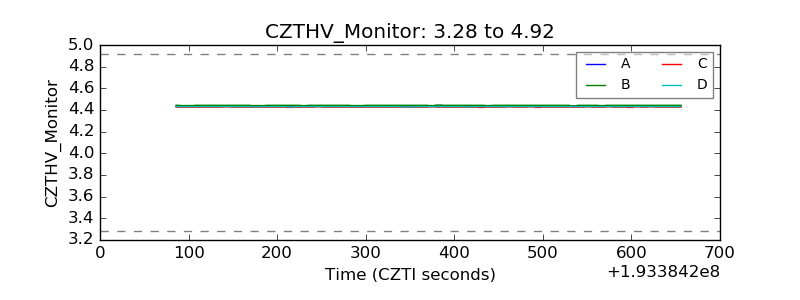 |
| D_VDD | 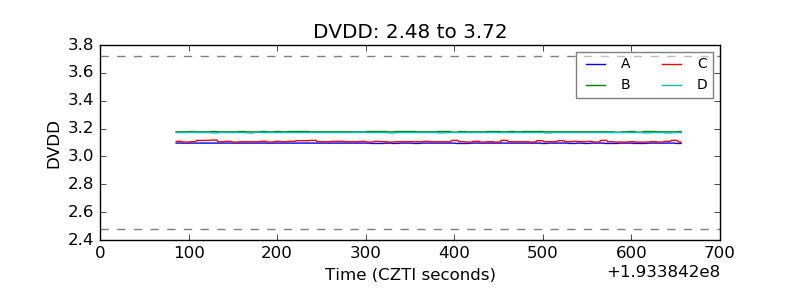 |
| Temperature 1 | 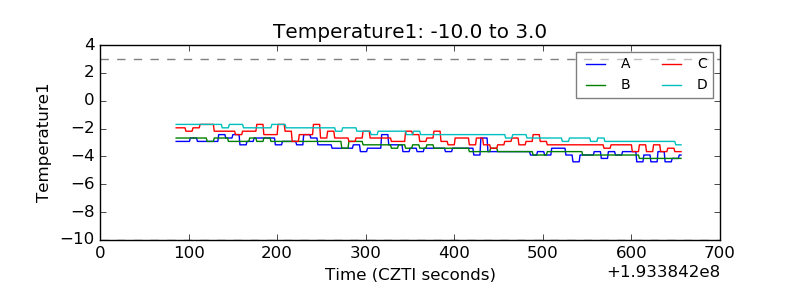 |
| Veto HV Monitor | 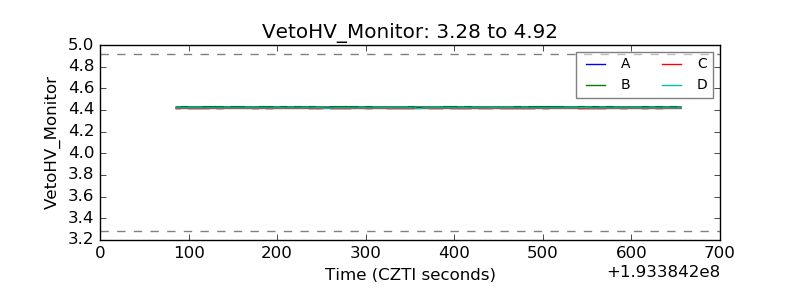 |
| Veto LLD | 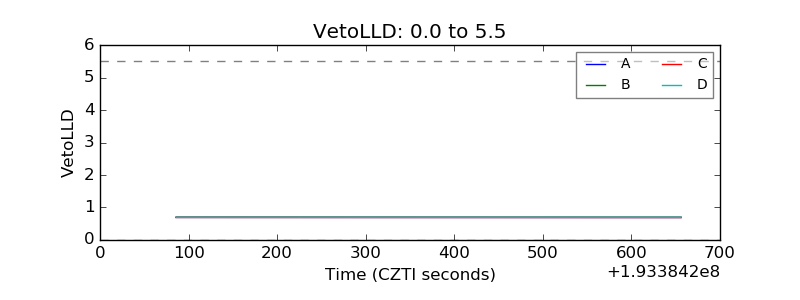 |
| Alpha Counter | 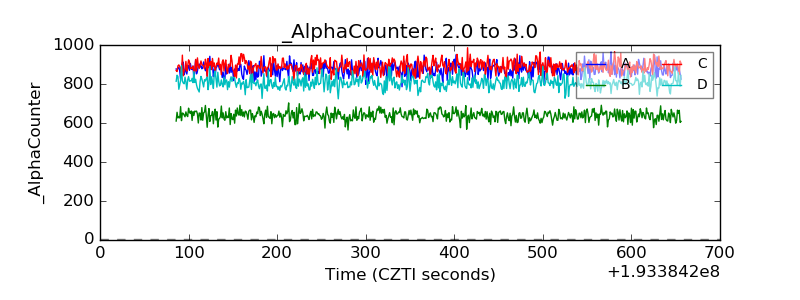 |
| _CPM_Rate | 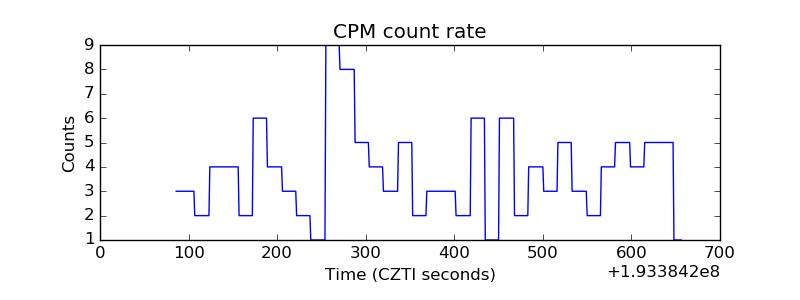 |
| CZT Counter | 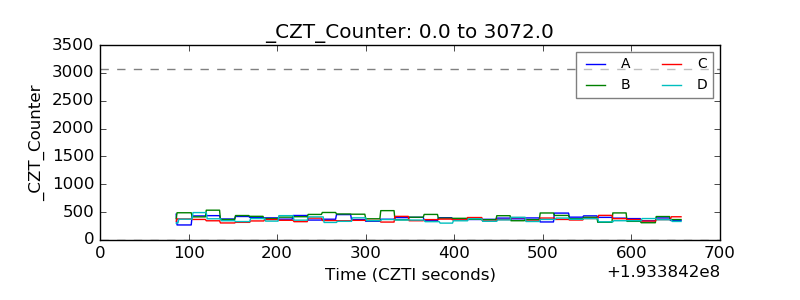 |
| +2.5 Volts monitor |  |
| +5 Volts monitor |  |
| Veto Counter | 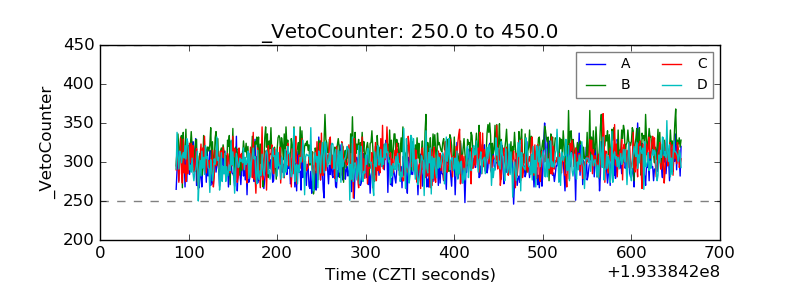 |