| Param | Original file | Final file |
|---|---|---|
| Filename | modeM0/AS1SLEW_01234_9000000327_02113cztM0_level2.evt | modeM0/AS1SLEW_01234_9000000327_02113cztM0_level2_quad_clean.evt |
| Size (bytes) | 31,129,920 | 5,103,360 |
| Size | 29.7 MB | 4.9 MB |
| Events in quadrant A | 226,942 | 27,528 |
| Events in quadrant B | 224,117 | 28,014 |
| Events in quadrant C | 223,943 | 26,434 |
| Events in quadrant D | 226,792 | 25,846 |
| Mode M0 | |||
|---|---|---|---|
| Quadrant | BADHDUFLAG | Total packets | Discarded packets |
| A | 0 | 1109 | 0 |
| B | 0 | 1101 | 0 |
| C | 0 | 1104 | 0 |
| D | 0 | 1129 | 0 |
| Mode SS | |||
|---|---|---|---|
| Quadrant | BADHDUFLAG | Total packets | Discarded packets |
| A | 0 | 10 | 0 |
| B | 0 | 10 | 0 |
| C | 0 | 10 | 0 |
| D | 0 | 10 | 0 |
| Quadrant | Total seconds | Saturated seconds | Saturation percentage |
|---|---|---|---|
| A | 551 | 0 | 0.000000% |
| B | 551 | 0 | 0.000000% |
| C | 551 | 0 | 0.000000% |
| D | 551 | 0 | 0.000000% |
Noise dominated data is calculated using 1-second bins in cleaned event files. If a bin has >2000 counts, and if more than 50% of those come from <1% of pixels, then it is considered to be noise-dominated and hence unusable.
| Quadrant | # 1 sec bins | Bins with >0 counts | Bins with >2000 counts | High rate bins dominated by noise | Noise dominated (total time) | Noise dominated (detector-on time) | Marked lightcurve |
|---|---|---|---|---|---|---|---|
| A | 551 | 551 | 0 | 0 | 0.00% | 0.00% | 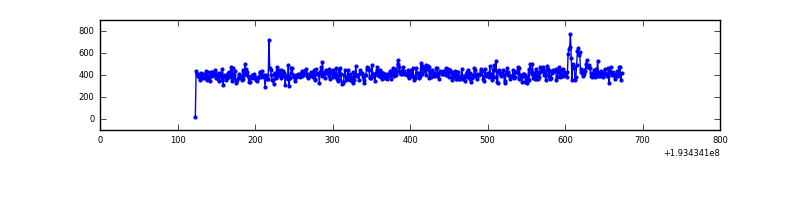 |
| B | 551 | 551 | 0 | 0 | 0.00% | 0.00% | 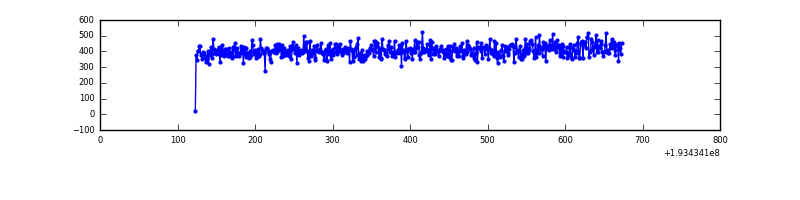 |
| C | 551 | 551 | 0 | 0 | 0.00% | 0.00% | 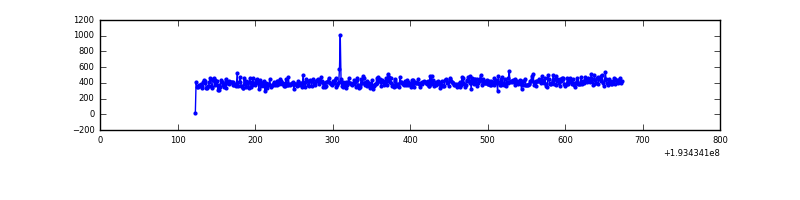 |
| D | 551 | 551 | 0 | 0 | 0.00% | 0.00% | 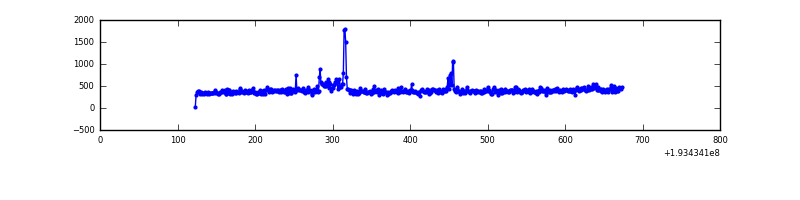 |
Top three noisy pixels from each quadrant. If the there are fewer than three noisy pixels in the level2.evt file, extra rows are filled as -1
| Pixel properties | Quadrant properties | ||||||
|---|---|---|---|---|---|---|---|
| Quadrant | DetID | PixID | Counts | Sigma | Mean | Median | Sigma |
| A | 0 | 199 | 8953 | 679.3 | 56 | 55 | 13.1 |
| A | 10 | 2 | 256 | 15.34 | 56 | 55 | 13.1 |
| A | 3 | 1 | 253 | 15.12 | 56 | 55 | 13.1 |
| B | 0 | 234 | 194 | 10.79 | 58 | 57 | 12.7 |
| B | 0 | 198 | 170 | 8.9 | 58 | 57 | 12.7 |
| B | 4 | 202 | 169 | 8.82 | 58 | 57 | 12.7 |
| C | 10 | 65 | 1358 | 90.39 | 56 | 56 | 14.4 |
| C | 14 | 48 | 381 | 22.56 | 56 | 56 | 14.4 |
| C | 5 | 234 | 371 | 21.87 | 56 | 56 | 14.4 |
| D | 14 | 34 | 12929 | 914.46 | 54 | 53 | 14.1 |
| D | 5 | 233 | 3813 | 267.04 | 54 | 53 | 14.1 |
| D | 10 | 170 | 1185 | 80.39 | 54 | 53 | 14.1 |
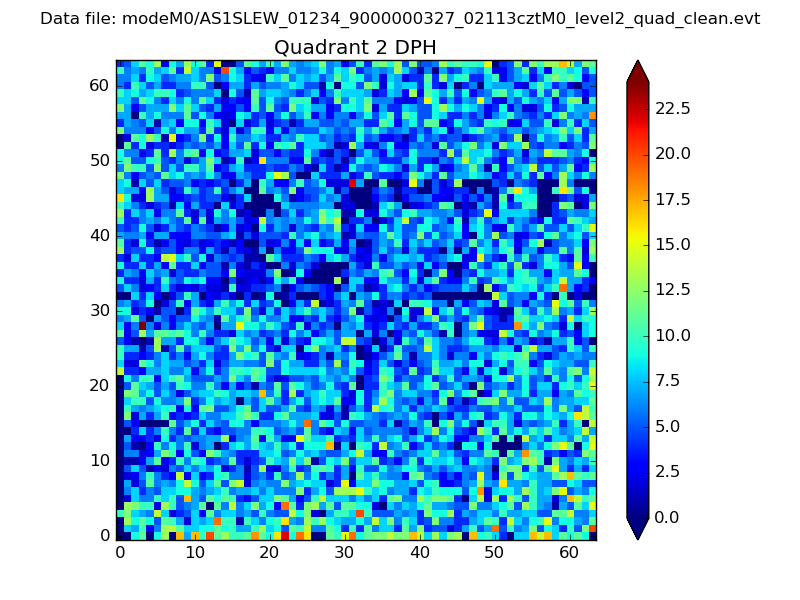
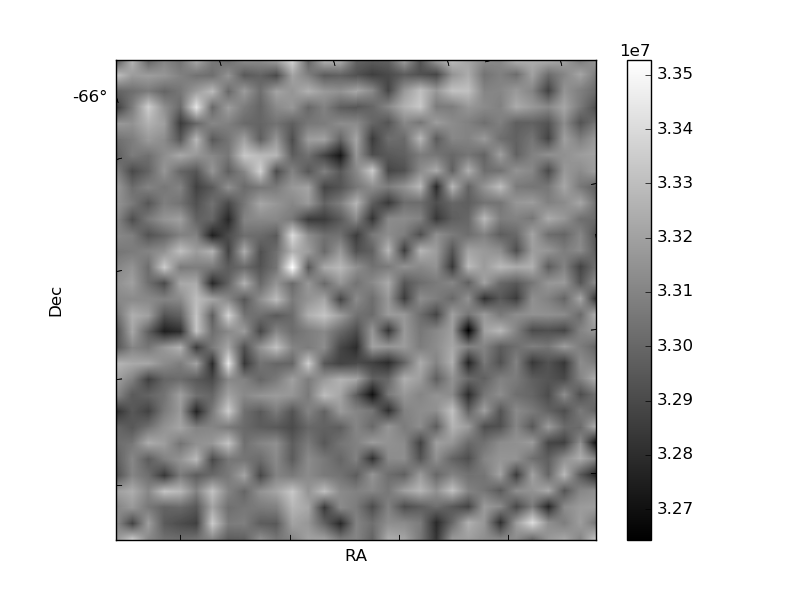
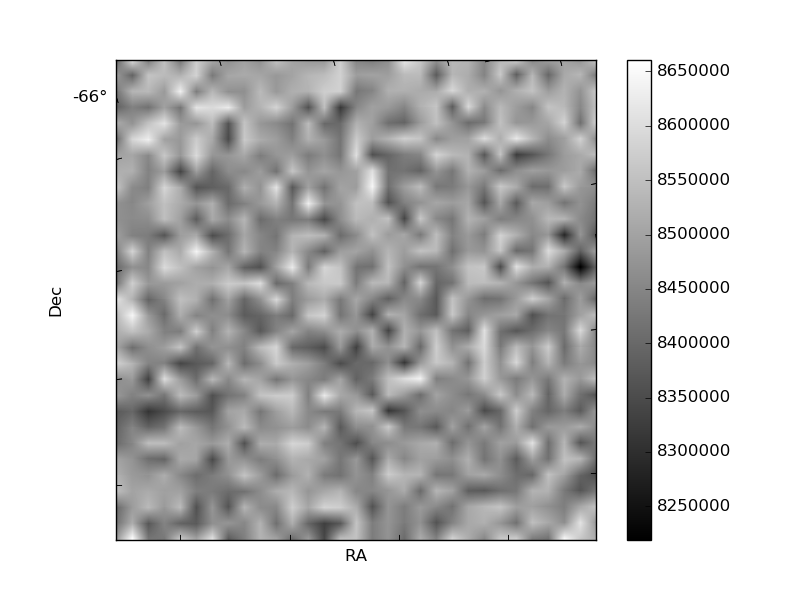
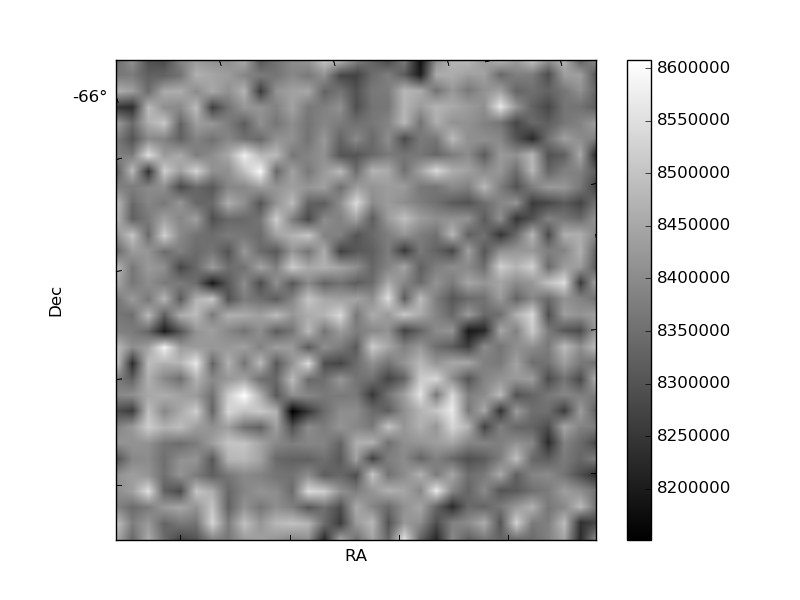
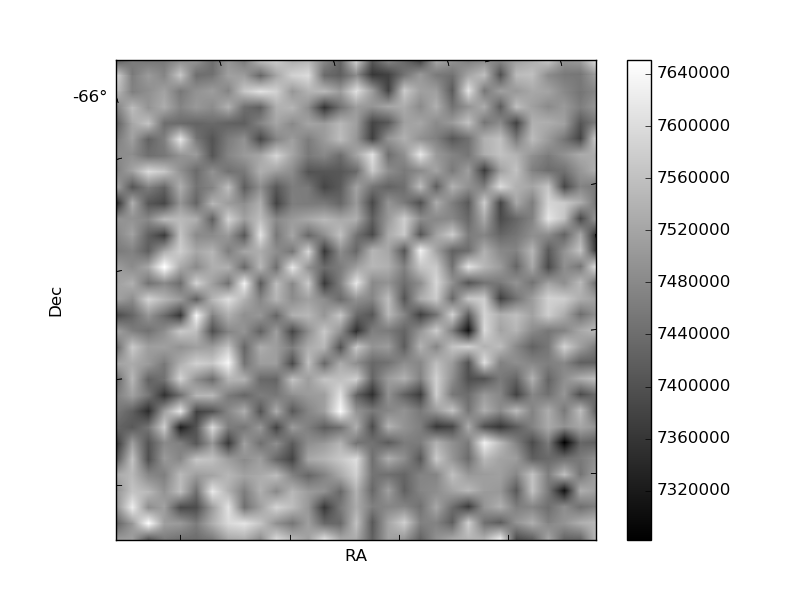
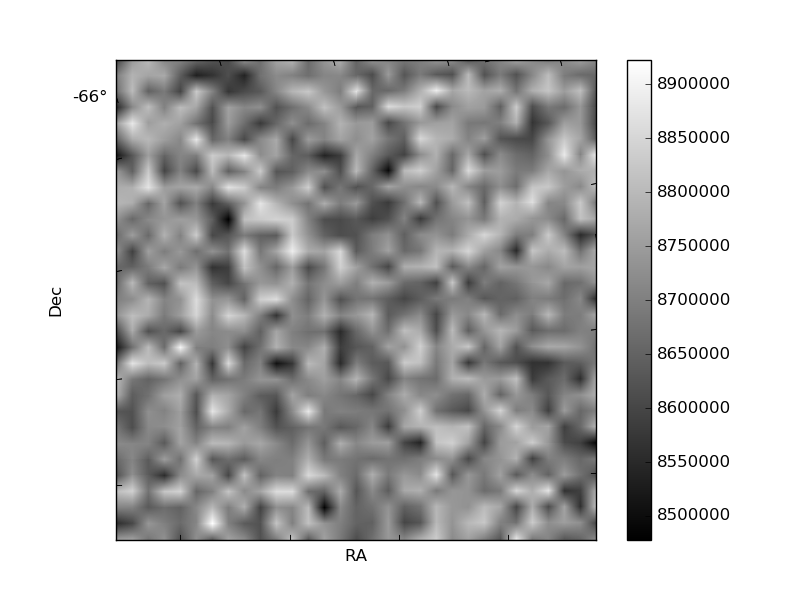
Histogram calculated using DETX and DETY for each event in the final _common_clean file
| Quadrant A | 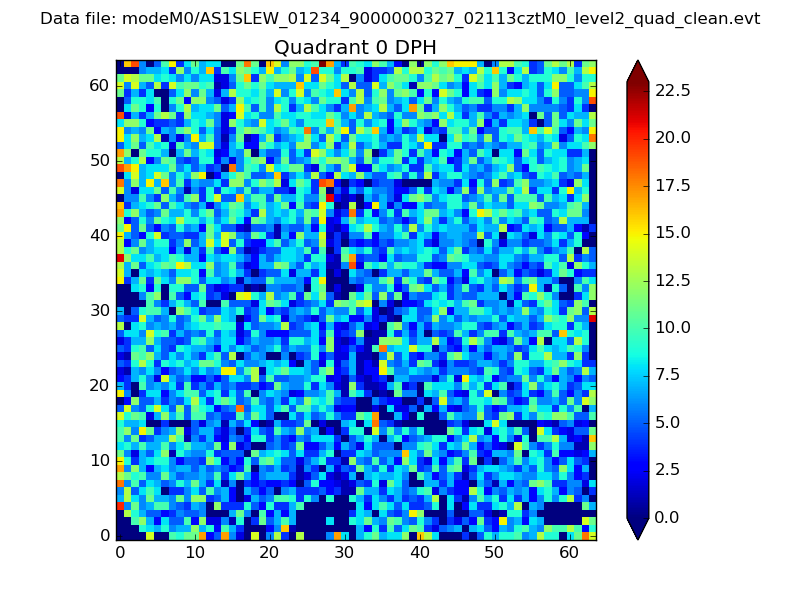 |
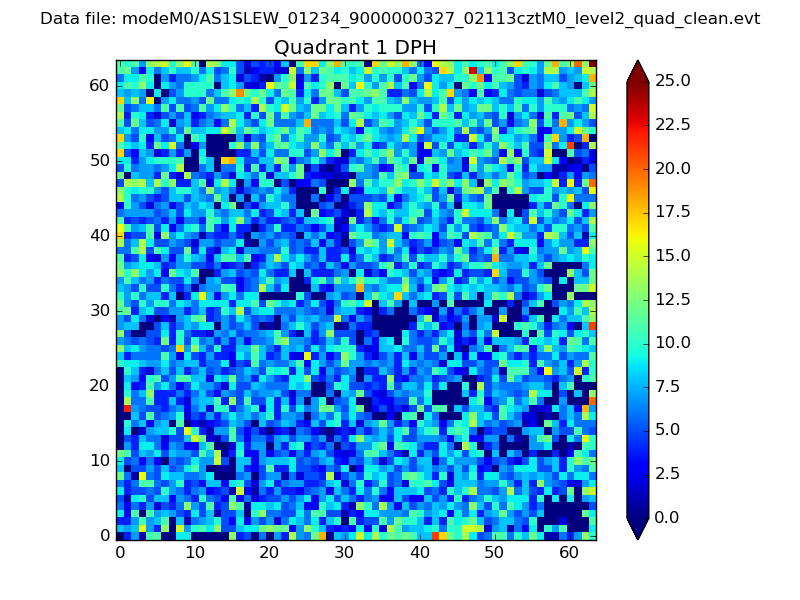 |
Quadrant B |
|---|---|---|---|
| Quadrant D | 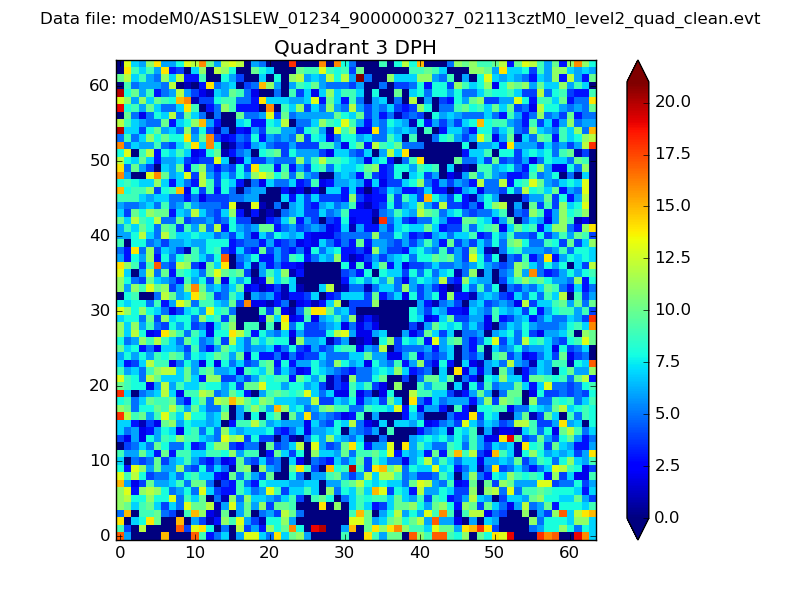 |
 |
Quadrant C |
| Plot type | Count rate plots | Images |
|---|---|---|
| Comparison with Poisson distribution Blue bars denote a histogram of data divided into 1 sec bins. Red curve is a Poisson curve with rate = median count rate of data. |
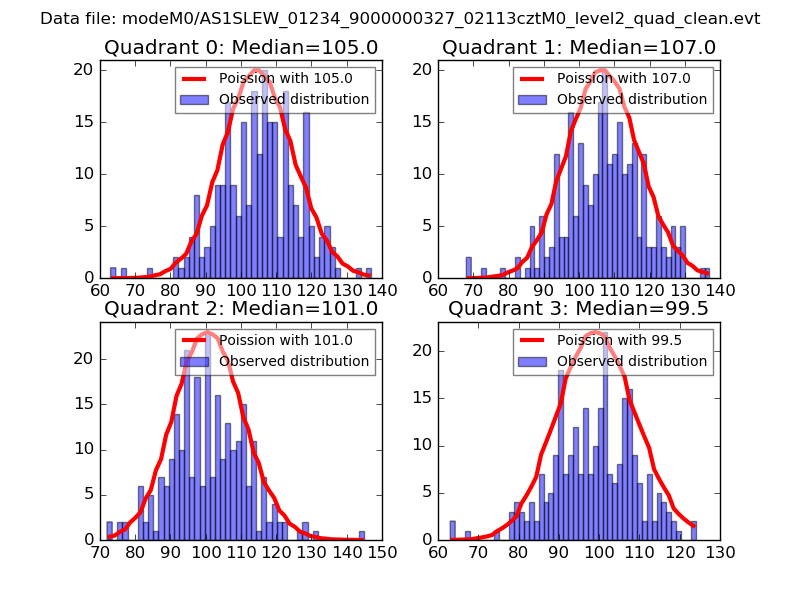 |
 |
| Quadrant-wise count rates Data is divided into 100 sec bins |
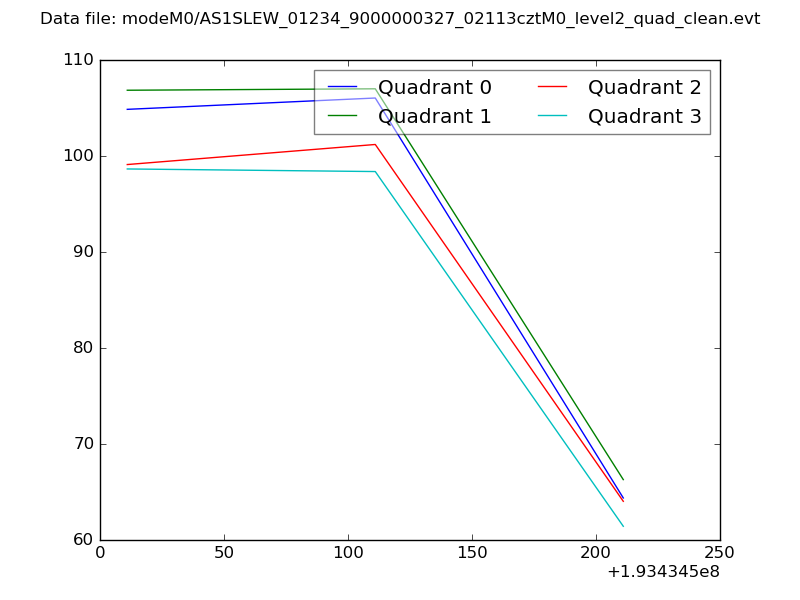 |
|
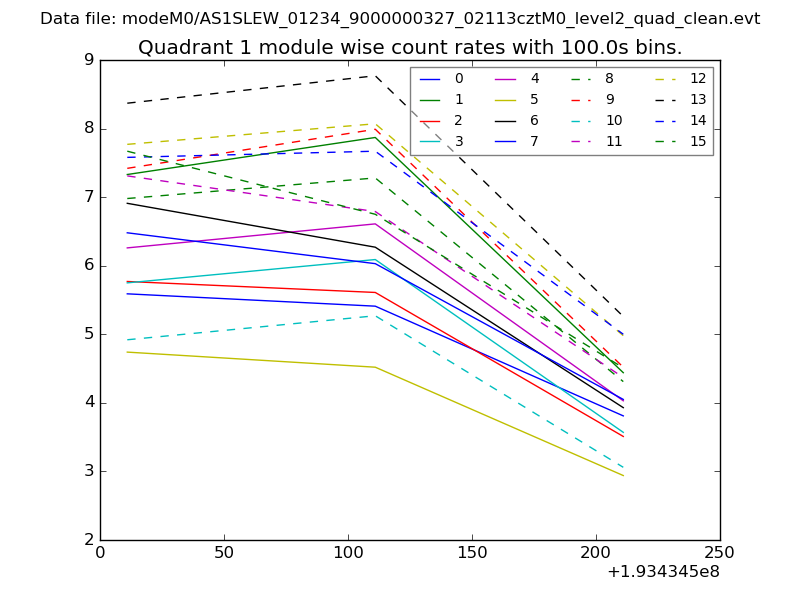
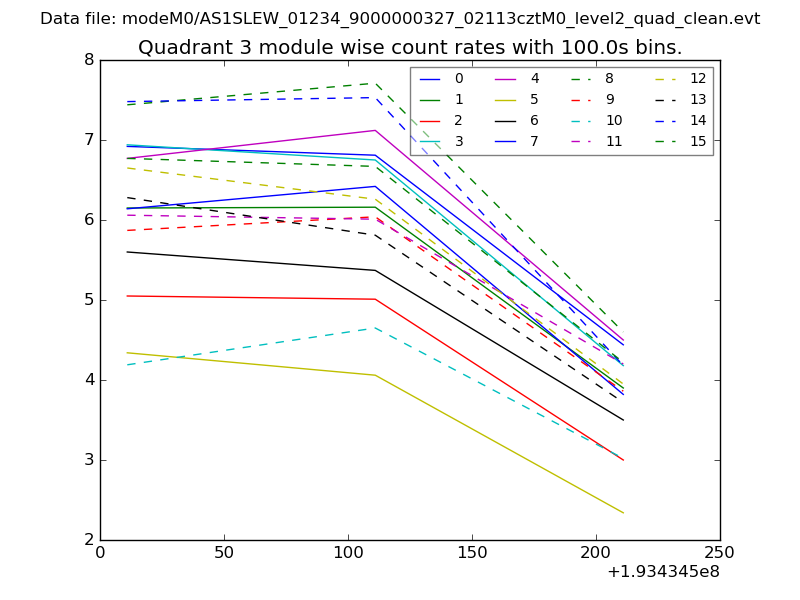
| Module-wise count rates for Quadrant A Data is divided into 100 sec bins |
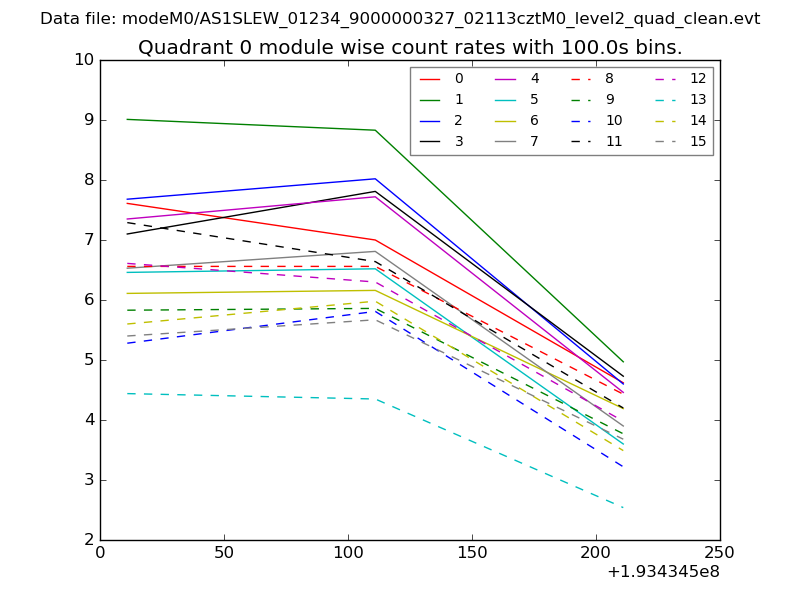 |
 |
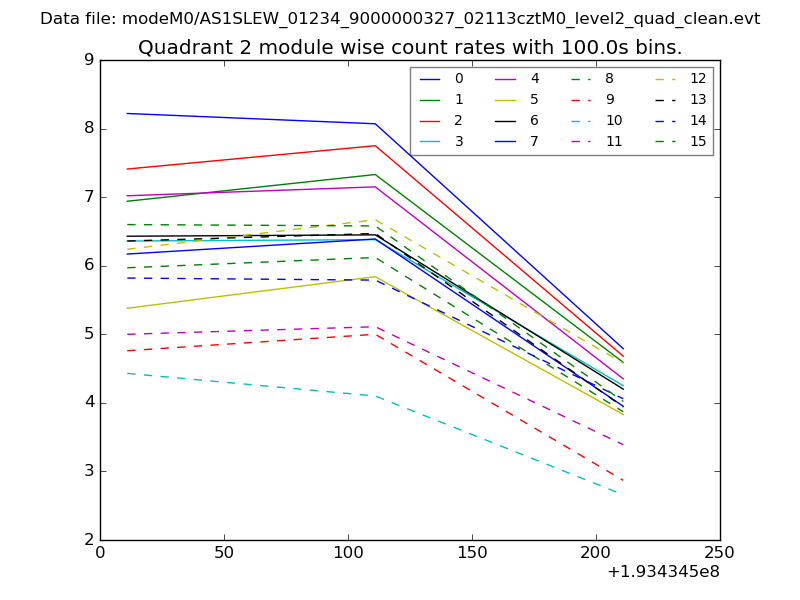
| Module-wise count rates for Quadrant B Data is divided into 100 sec bins |
 |
 |
| Module-wise count rates for Quadrant C Data is divided into 100 sec bins |
 |
 |
| Module-wise count rates for Quadrant D Data is divided into 100 sec bins |
 |
 |
| Parameter | Plot |
|---|---|
| CZT HV Monitor | 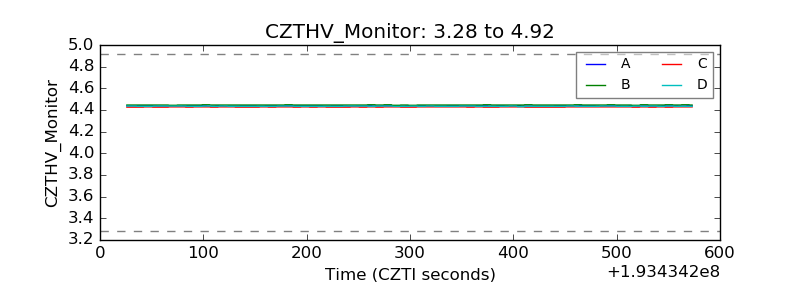 |
| D_VDD | 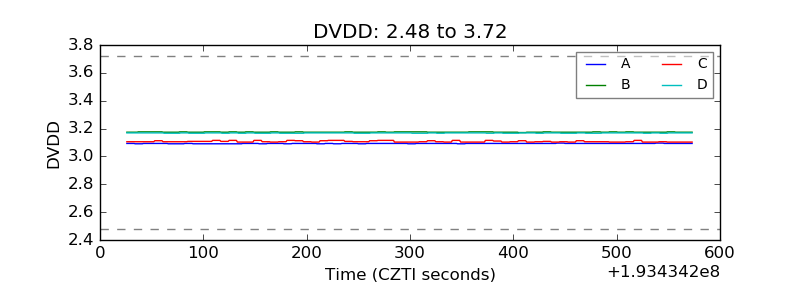 |
| Temperature 1 | 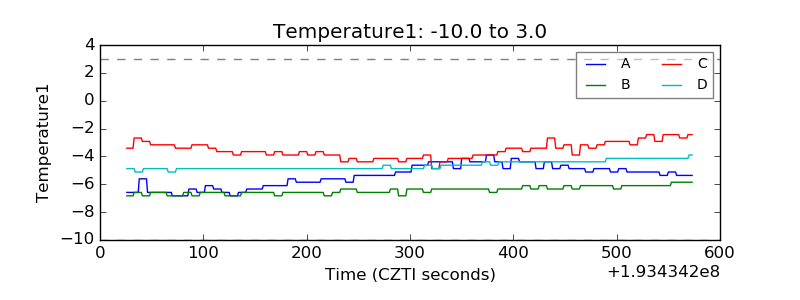 |
| Veto HV Monitor | 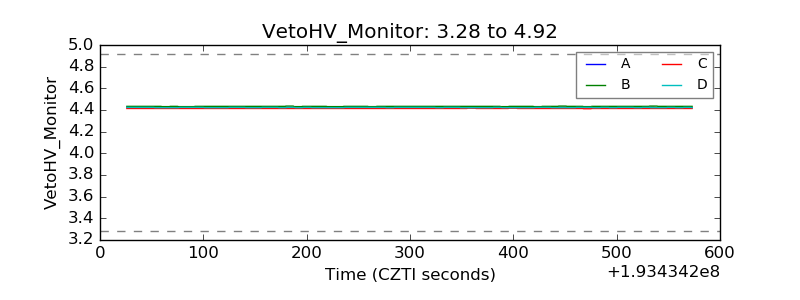 |
| Veto LLD | 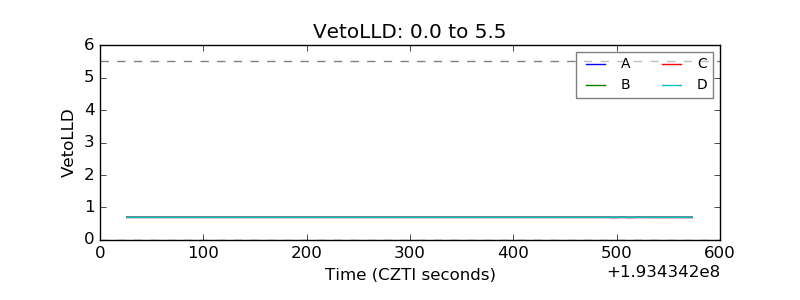 |
| Alpha Counter | 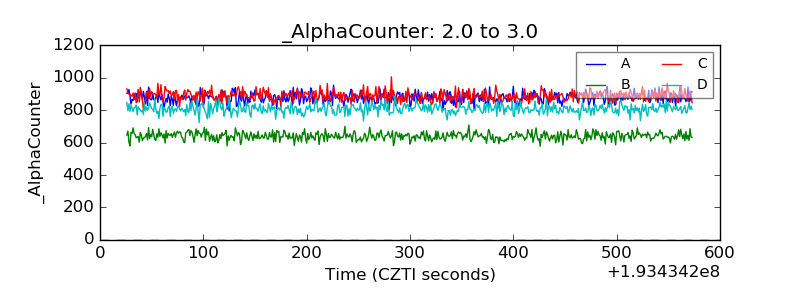 |
| _CPM_Rate | 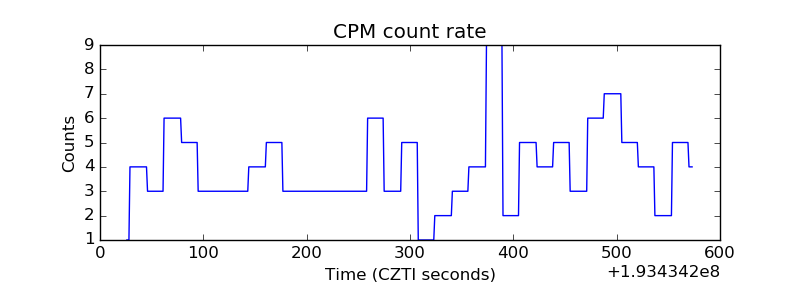 |
| CZT Counter | 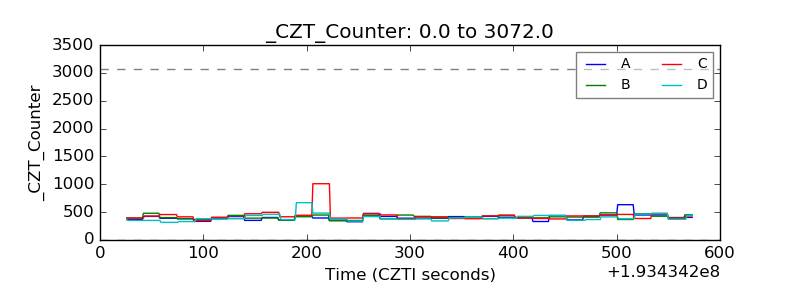 |
| +2.5 Volts monitor | 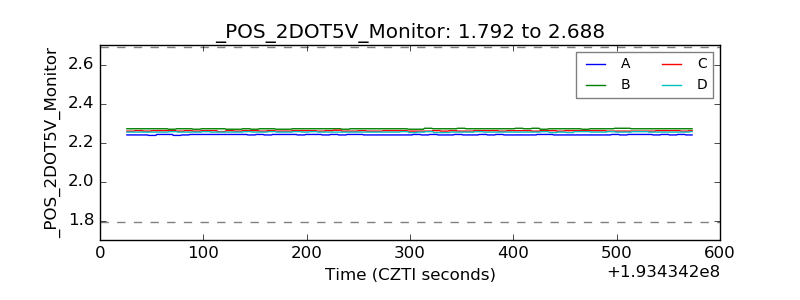 |
| +5 Volts monitor | 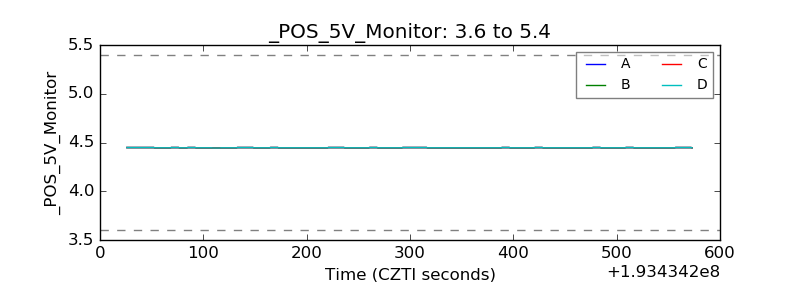 |
| Veto Counter | 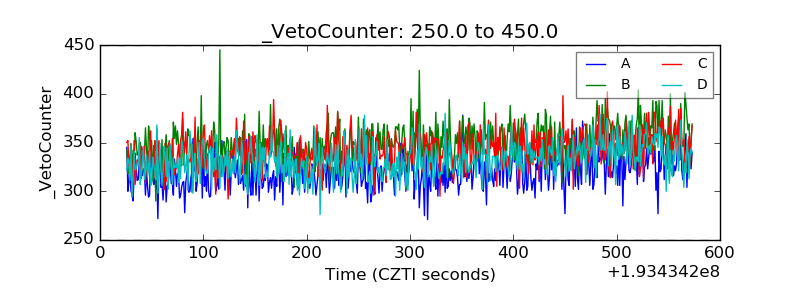 |