| Param | Original file | Final file |
|---|---|---|
| Filename | modeM0/AS1P01_069T01_9000000330cztM0_level2.fits | modeM0/AS1P01_069T01_9000000330cztM0_level2_quad_clean.evt |
| Size (bytes) | 199,287,360 | 265,541,760 |
| Size | 190.1 MB | 253.2 MB |
| Events in quadrant A | 1,141,216 | 1,660,846 |
| Events in quadrant B | 1,141,850 | 1,686,794 |
| Events in quadrant C | 1,136,090 | 1,597,836 |
| Events in quadrant D | 982,978 | 1,463,682 |
| Mode M9 | |||
|---|---|---|---|
| Quadrant | BADHDUFLAG | Total packets | Discarded packets |
| A | 1 | 139682588112936 | 139680926400558 |
| B | 1 | 139682588112936 | 139680926400558 |
| C | 1 | 139682588112936 | 139680926400558 |
| D | 1 | 139682588112936 | 139680926400558 |
| Mode SS | |||
|---|---|---|---|
| Quadrant | BADHDUFLAG | Total packets | Discarded packets |
| A | 0 | 476 | 0 |
| B | 0 | 476 | 0 |
| C | 0 | 476 | 0 |
| D | 0 | 476 | 0 |
| Mode M0 | |||
|---|---|---|---|
| Quadrant | BADHDUFLAG | Total packets | Discarded packets |
| A | 0 | 49765 | 0 |
| B | 0 | 49403 | 0 |
| C | 0 | 49367 | 0 |
| D | 0 | 50851 | 0 |
| Quadrant | Total seconds | Saturated seconds | Saturation percentage |
|---|---|---|---|
| A | 23737 | 391 | 1.647217% |
| B | 23737 | 285 | 1.200657% |
| C | 23737 | 256 | 1.078485% |
| D | 23736 | 223 | 0.939501% |
Noise dominated data is calculated using 1-second bins in cleaned event files. If a bin has >2000 counts, and if more than 50% of those come from <1% of pixels, then it is considered to be noise-dominated and hence unusable.
| Quadrant | # 1 sec bins | Bins with >0 counts | Bins with >2000 counts | High rate bins dominated by noise | Noise dominated (total time) | Noise dominated (detector-on time) | Marked lightcurve |
|---|---|---|---|---|---|---|---|
| A | 24654 | 23737 | 0 | 0 | 0.00% | 0.00% | 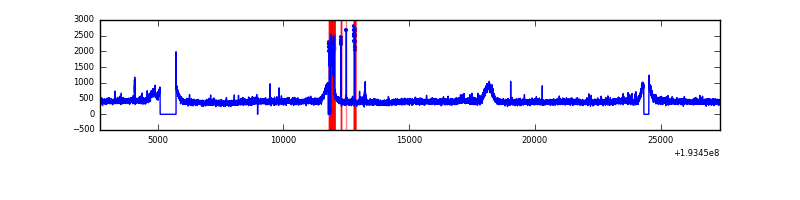 |
| B | 24654 | 23736 | 0 | 0 | 0.00% | 0.00% |  |
| C | 24654 | 23738 | 0 | 0 | 0.00% | 0.00% |  |
| D | 24654 | 23736 | 0 | 0 | 0.00% | 0.00% |  |
Top three noisy pixels from each quadrant. If the there are fewer than three noisy pixels in the level2.evt file, extra rows are filled as -1
| Pixel properties | Quadrant properties | ||||||
|---|---|---|---|---|---|---|---|
| Quadrant | DetID | PixID | Counts | Sigma | Mean | Median | Sigma |
| A | 0 | 29 | 1058 | 10.76 | 295 | 274 | 72.9 |
| A | 7 | 110 | 1015 | 10.17 | 295 | 274 | 72.9 |
| A | 14 | 188 | 995 | 9.89 | 295 | 274 | 72.9 |
| B | 2 | 9 | 911 | 10.81 | 301 | 285 | 57.9 |
| B | 10 | 225 | 784 | 8.61 | 301 | 285 | 57.9 |
| B | 14 | 254 | 778 | 8.51 | 301 | 285 | 57.9 |
| C | 12 | 241 | 779 | 6.72 | 299 | 276 | 74.9 |
| C | 9 | 242 | 743 | 6.24 | 299 | 276 | 74.9 |
| C | 2 | 127 | 741 | 6.21 | 299 | 276 | 74.9 |
| D | 3 | 30 | 699 | 6.58 | 279 | 255 | 67.4 |
| D | 10 | 189 | 696 | 6.54 | 279 | 255 | 67.4 |
| D | 1 | 19 | 691 | 6.47 | 279 | 255 | 67.4 |
Histogram calculated using DETX and DETY for each event in the final _common_clean file
| Quadrant A | 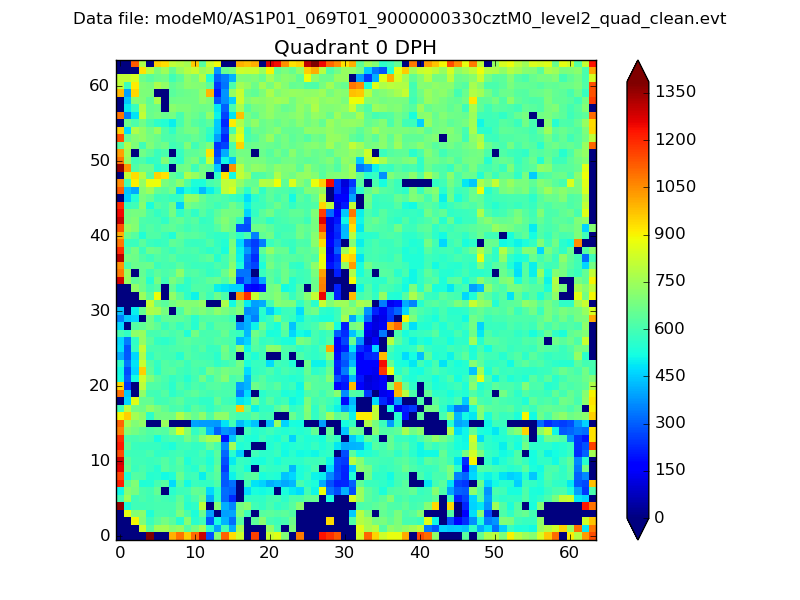 |
 |
Quadrant B |
|---|---|---|---|
| Quadrant D | 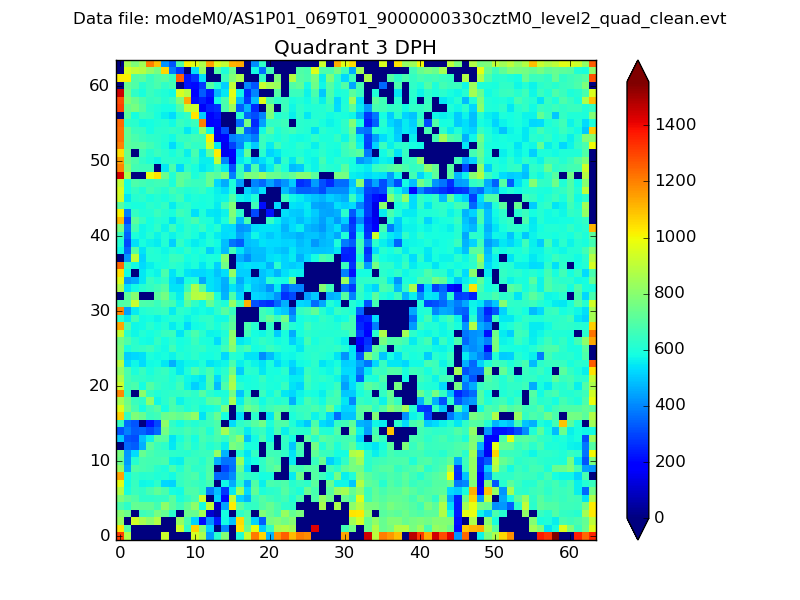 |
 |
Quadrant C |
| Plot type | Count rate plots | Images |
|---|---|---|
| Comparison with Poisson distribution Blue bars denote a histogram of data divided into 1 sec bins. Red curve is a Poisson curve with rate = median count rate of data. |
 |
 |
| Quadrant-wise count rates Data is divided into 100 sec bins |
 |
|
| Module-wise count rates for Quadrant A Data is divided into 100 sec bins |
 |
 |
| Module-wise count rates for Quadrant B Data is divided into 100 sec bins |
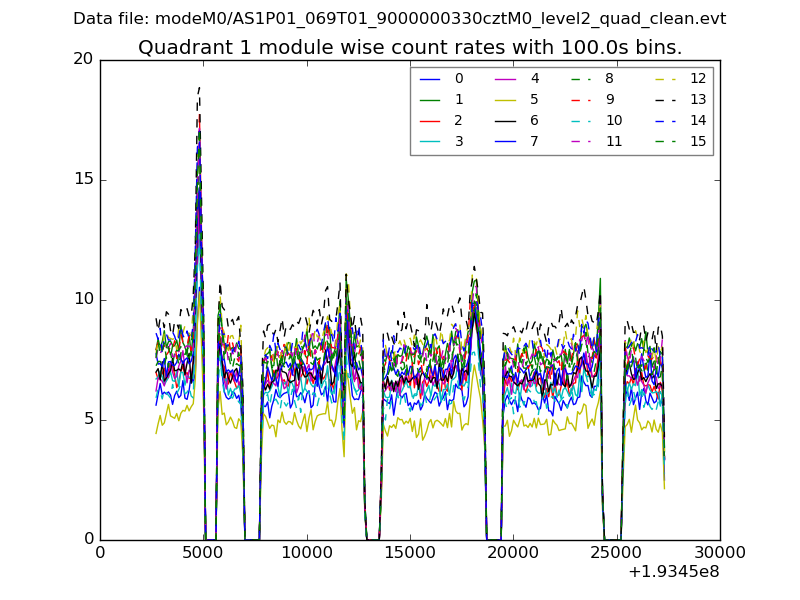 |
 |
| Module-wise count rates for Quadrant C Data is divided into 100 sec bins |
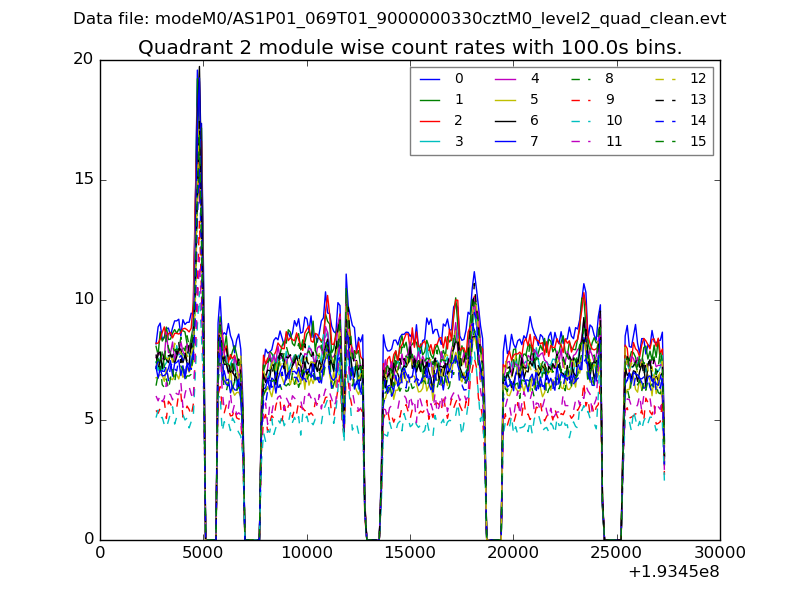 |
 |
| Module-wise count rates for Quadrant D Data is divided into 100 sec bins |
 |
 |
| Parameter | Plot |
|---|---|
| CZT HV Monitor |  |
| D_VDD | 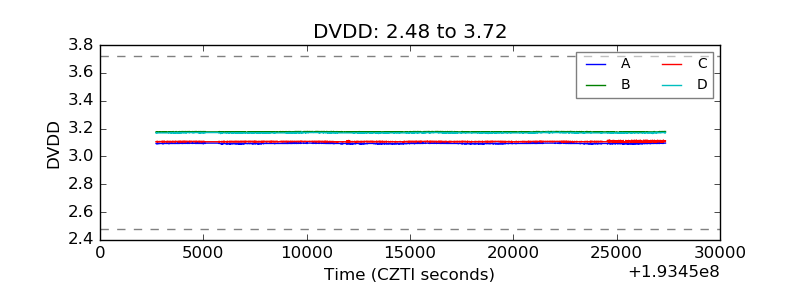 |
| Temperature 1 |  |
| Veto HV Monitor |  |
| Veto LLD |  |
| Alpha Counter |  |
| _CPM_Rate |  |
| CZT Counter |  |
| +2.5 Volts monitor |  |
| +5 Volts monitor |  |
| _ROLL_ROT |  |
| _Roll_DEC |  |
| _Roll_RA |  |
| Veto Counter |  |