| Param | Original file | Final file |
|---|---|---|
| Filename | modeM0/AS1T01_034T01_9000000334cztM0_level2.fits | modeM0/AS1T01_034T01_9000000334cztM0_level2_quad_clean.evt |
| Size (bytes) | 424,382,400 | 676,232,640 |
| Size | 404.7 MB | 644.9 MB |
| Events in quadrant A | 2,405,748 | 4,319,550 |
| Events in quadrant B | 2,434,322 | 4,426,971 |
| Events in quadrant C | 2,440,298 | 4,325,712 |
| Events in quadrant D | 2,091,256 | 3,930,608 |
| Mode M0 | |||
|---|---|---|---|
| Quadrant | BADHDUFLAG | Total packets | Discarded packets |
| A | 0 | 113423 | 0 |
| B | 0 | 105537 | 0 |
| C | 0 | 103072 | 0 |
| D | 0 | 108723 | 0 |
| Mode SS | |||
|---|---|---|---|
| Quadrant | BADHDUFLAG | Total packets | Discarded packets |
| A | 0 | 1018 | 0 |
| B | 0 | 1018 | 0 |
| C | 0 | 1018 | 0 |
| D | 0 | 1018 | 0 |
| Mode M9 | |||
|---|---|---|---|
| Quadrant | BADHDUFLAG | Total packets | Discarded packets |
| A | 1 | 140568336730152 | 140565689663534 |
| B | 1 | 140568336730152 | 140565689663534 |
| C | 1 | 140568336730152 | 140565689663534 |
| D | 1 | 140568336730152 | 140565689663534 |
| Quadrant | Total seconds | Saturated seconds | Saturation percentage |
|---|---|---|---|
| A | 50719 | 644 | 1.269741% |
| B | 50719 | 133 | 0.262229% |
| C | 50721 | 144 | 0.283906% |
| D | 50721 | 626 | 1.234203% |
Noise dominated data is calculated using 1-second bins in cleaned event files. If a bin has >2000 counts, and if more than 50% of those come from <1% of pixels, then it is considered to be noise-dominated and hence unusable.
| Quadrant | # 1 sec bins | Bins with >0 counts | Bins with >2000 counts | High rate bins dominated by noise | Noise dominated (total time) | Noise dominated (detector-on time) | Marked lightcurve |
|---|---|---|---|---|---|---|---|
| A | 58206 | 50705 | 0 | 0 | 0.00% | 0.00% |  |
| B | 58206 | 50716 | 0 | 0 | 0.00% | 0.00% |  |
| C | 58206 | 50718 | 0 | 0 | 0.00% | 0.00% |  |
| D | 58206 | 50669 | 0 | 0 | 0.00% | 0.00% | 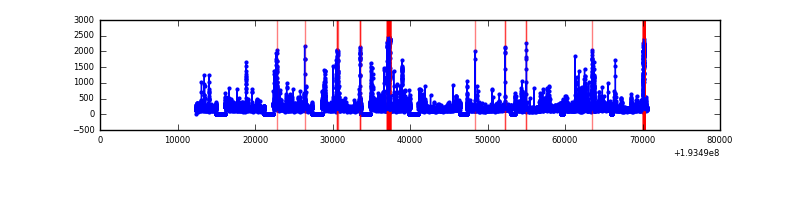 |
Top three noisy pixels from each quadrant. If the there are fewer than three noisy pixels in the level2.evt file, extra rows are filled as -1
| Pixel properties | Quadrant properties | ||||||
|---|---|---|---|---|---|---|---|
| Quadrant | DetID | PixID | Counts | Sigma | Mean | Median | Sigma |
| A | 0 | 29 | 2205 | 11.22 | 623 | 585 | 144.4 |
| A | 7 | 110 | 2133 | 10.72 | 623 | 585 | 144.4 |
| A | 14 | 79 | 1724 | 7.89 | 623 | 585 | 144.4 |
| B | 2 | 9 | 1964 | 11.67 | 643 | 613 | 115.8 |
| B | 5 | 128 | 1638 | 8.85 | 643 | 613 | 115.8 |
| B | 2 | 8 | 1530 | 7.92 | 643 | 613 | 115.8 |
| C | 12 | 241 | 1700 | 7.11 | 643 | 599 | 154.8 |
| C | 1 | 81 | 1656 | 6.83 | 643 | 599 | 154.8 |
| C | 2 | 191 | 1612 | 6.54 | 643 | 599 | 154.8 |
| D | 3 | 30 | 1510 | 6.81 | 595 | 546 | 141.6 |
| D | 3 | 14 | 1502 | 6.75 | 595 | 546 | 141.6 |
| D | 6 | 231 | 1494 | 6.69 | 595 | 546 | 141.6 |
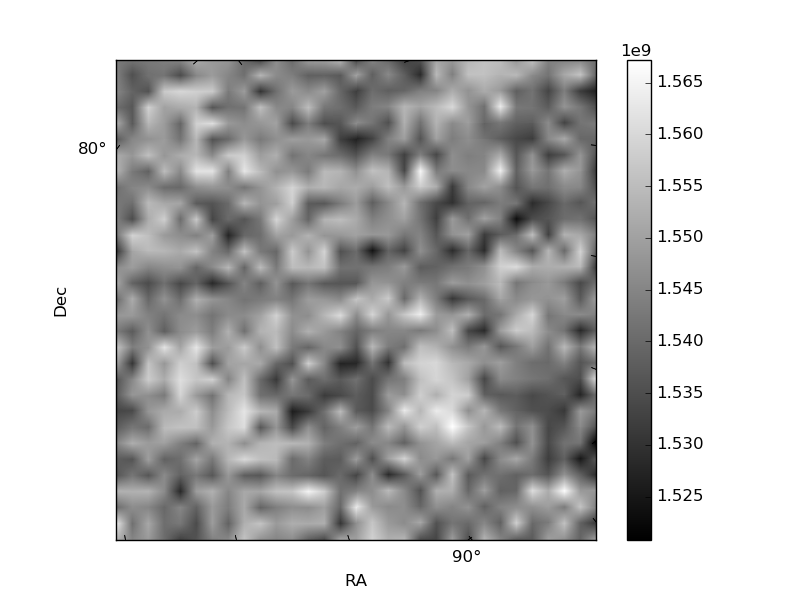
Histogram calculated using DETX and DETY for each event in the final _common_clean file
| Quadrant A |  |
 |
Quadrant B |
|---|---|---|---|
| Quadrant D | 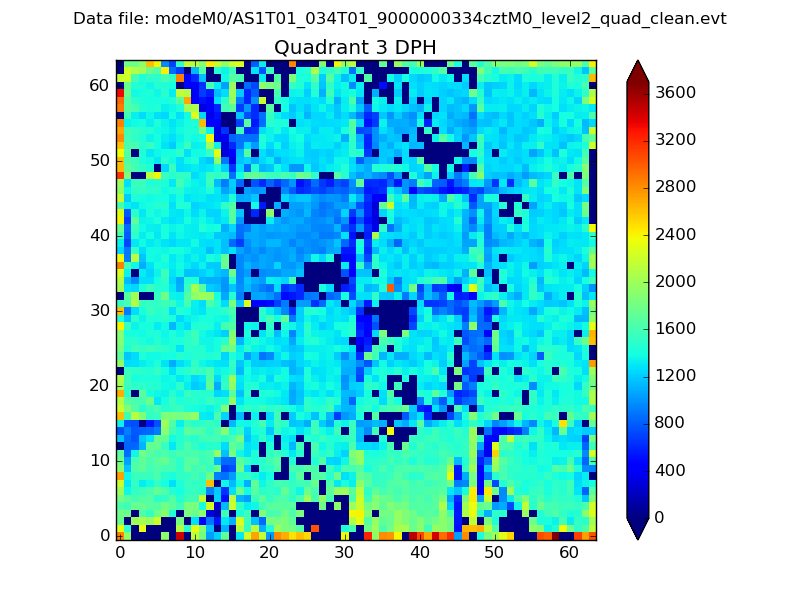 |
 |
Quadrant C |
| Plot type | Count rate plots | Images |
|---|---|---|
| Comparison with Poisson distribution Blue bars denote a histogram of data divided into 1 sec bins. Red curve is a Poisson curve with rate = median count rate of data. |
 |
 |
| Quadrant-wise count rates Data is divided into 100 sec bins |
 |
|
| Module-wise count rates for Quadrant A Data is divided into 100 sec bins |
 |
 |
| Module-wise count rates for Quadrant B Data is divided into 100 sec bins |
 |
 |
| Module-wise count rates for Quadrant C Data is divided into 100 sec bins |
 |
 |
| Module-wise count rates for Quadrant D Data is divided into 100 sec bins |
 |
 |
| Parameter | Plot |
|---|---|
| CZT HV Monitor |  |
| D_VDD |  |
| Temperature 1 |  |
| Veto HV Monitor |  |
| Veto LLD |  |
| Alpha Counter | 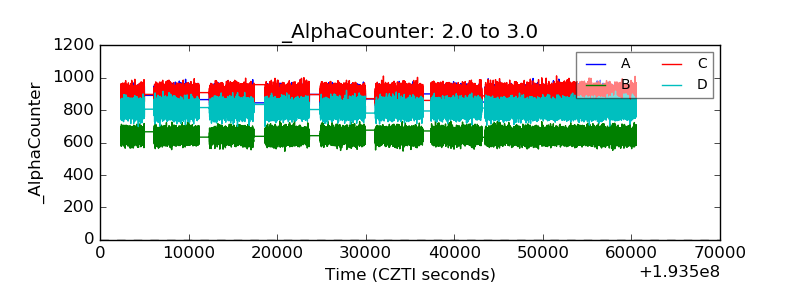 |
| _CPM_Rate | 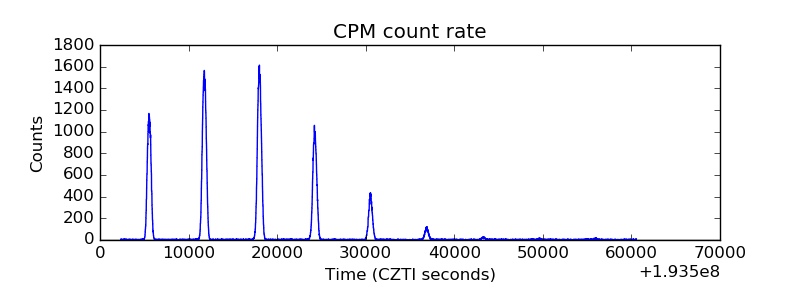 |
| CZT Counter | 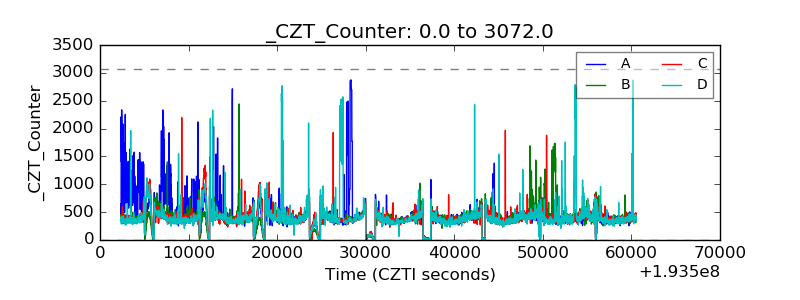 |
| +2.5 Volts monitor |  |
| +5 Volts monitor |  |
| _ROLL_ROT | 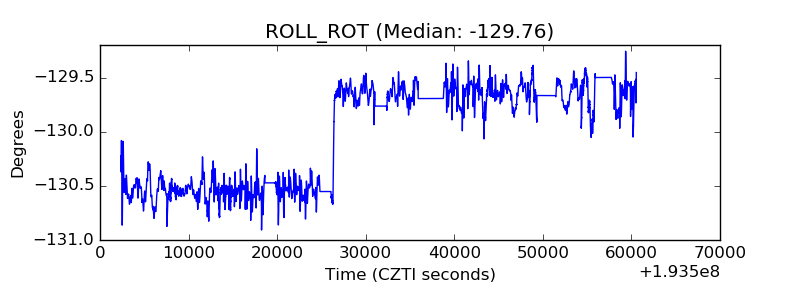 |
| _Roll_DEC |  |
| _Roll_RA | 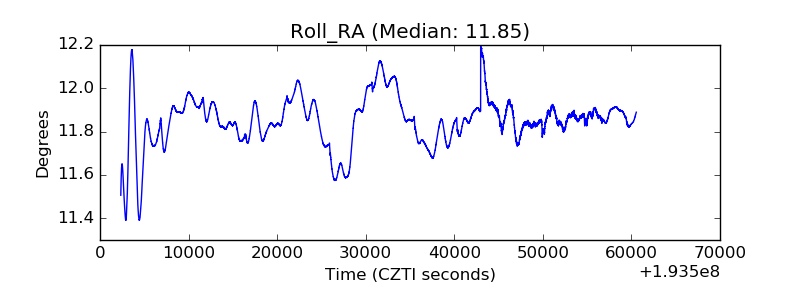 |
| Veto Counter |  |