| Param | Original file | Final file |
|---|---|---|
| Filename | modeM0/AS1T01_034T01_9000000334_02134cztM0_level2.evt | modeM0/AS1T01_034T01_9000000334_02134cztM0_level2_quad_clean.evt |
| Size (bytes) | 252,345,600 | 76,386,240 |
| Size | 240.7 MB | 72.8 MB |
| Events in quadrant A | 1,753,955 | 497,253 |
| Events in quadrant B | 1,829,785 | 508,720 |
| Events in quadrant C | 1,758,348 | 503,508 |
| Events in quadrant D | 1,988,812 | 483,918 |
| Mode M0 | |||
|---|---|---|---|
| Quadrant | BADHDUFLAG | Total packets | Discarded packets |
| A | 0 | 9175 | 2 |
| B | 0 | 9218 | 2 |
| C | 0 | 9167 | 2 |
| D | 0 | 9995 | 2 |
| Mode SS | |||
|---|---|---|---|
| Quadrant | BADHDUFLAG | Total packets | Discarded packets |
| A | 0 | 94 | 0 |
| B | 0 | 94 | 0 |
| C | 0 | 94 | 0 |
| D | 0 | 94 | 0 |
| Quadrant | Total seconds | Saturated seconds | Saturation percentage |
|---|---|---|---|
| A | 4539 | 14 | 0.308438% |
| B | 4539 | 15 | 0.330469% |
| C | 4539 | 9 | 0.198282% |
| D | 4539 | 96 | 2.115003% |
Noise dominated data is calculated using 1-second bins in cleaned event files. If a bin has >2000 counts, and if more than 50% of those come from <1% of pixels, then it is considered to be noise-dominated and hence unusable.
| Quadrant | # 1 sec bins | Bins with >0 counts | Bins with >2000 counts | High rate bins dominated by noise | Noise dominated (total time) | Noise dominated (detector-on time) | Marked lightcurve |
|---|---|---|---|---|---|---|---|
| A | 4638 | 4540 | 0 | 0 | 0.00% | 0.00% | 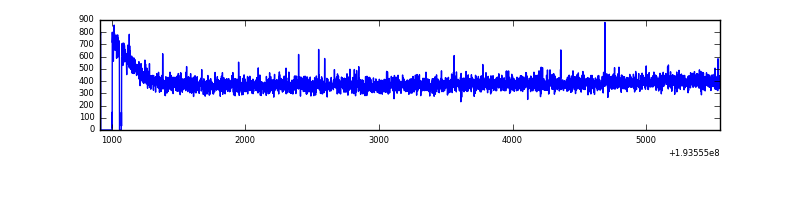 |
| B | 4639 | 4541 | 0 | 0 | 0.00% | 0.00% | 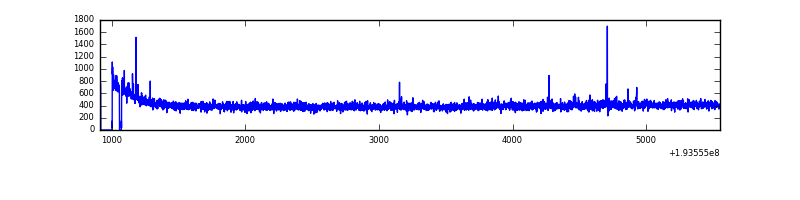 |
| C | 4638 | 4540 | 0 | 0 | 0.00% | 0.00% | 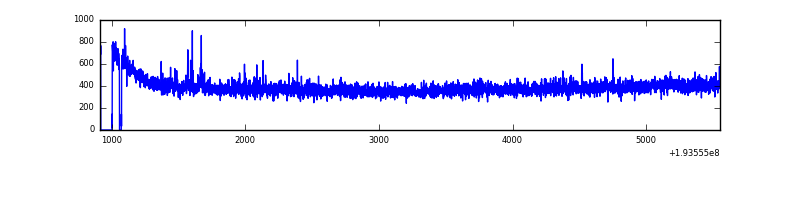 |
| D | 4638 | 4540 | 104 | 104 | 2.24% | 2.29% | 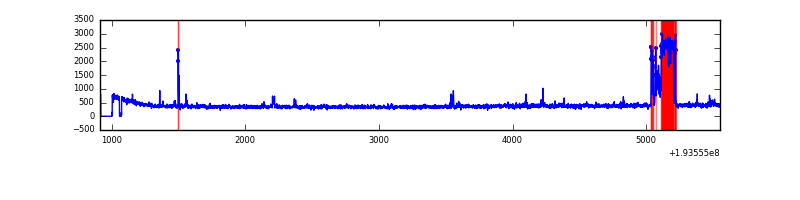 |
Top three noisy pixels from each quadrant. If the there are fewer than three noisy pixels in the level2.evt file, extra rows are filled as -1
| Pixel properties | Quadrant properties | ||||||
|---|---|---|---|---|---|---|---|
| Quadrant | DetID | PixID | Counts | Sigma | Mean | Median | Sigma |
| A | 10 | 2 | 1992 | 16.99 | 456 | 446 | 91.0 |
| A | 0 | 1 | 1321 | 9.61 | 456 | 446 | 91.0 |
| A | 15 | 236 | 1318 | 9.58 | 456 | 446 | 91.0 |
| B | 0 | 198 | 11413 | 127.82 | 468 | 459 | 85.7 |
| B | 5 | 189 | 9332 | 103.54 | 468 | 459 | 85.7 |
| B | 5 | 68 | 6685 | 72.65 | 468 | 459 | 85.7 |
| C | 10 | 82 | 12794 | 126.66 | 442 | 444 | 97.5 |
| C | 9 | 236 | 3409 | 30.41 | 442 | 444 | 97.5 |
| C | 10 | 65 | 2890 | 25.09 | 442 | 444 | 97.5 |
| D | 2 | 31 | 316386 | 3214.54 | 435 | 425 | 98.3 |
| D | 13 | 88 | 12093 | 118.71 | 435 | 425 | 98.3 |
| D | 9 | 64 | 7798 | 75.01 | 435 | 425 | 98.3 |
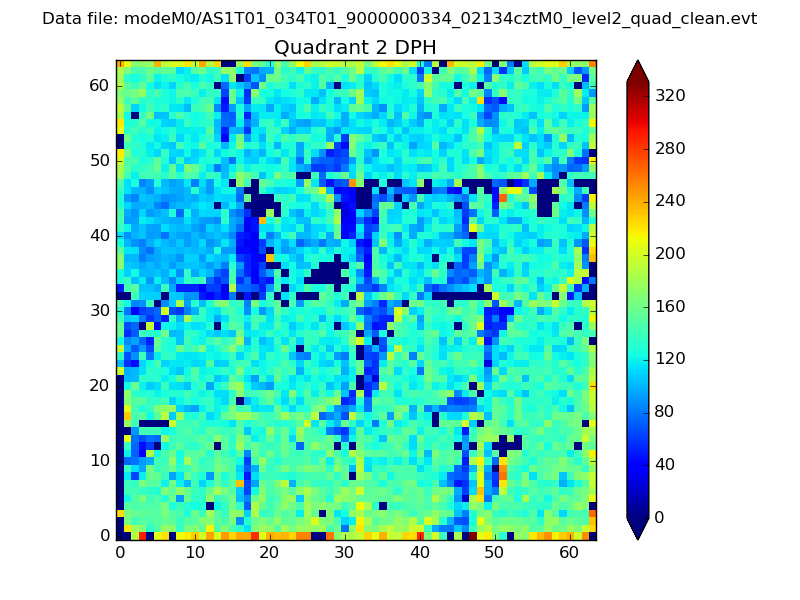
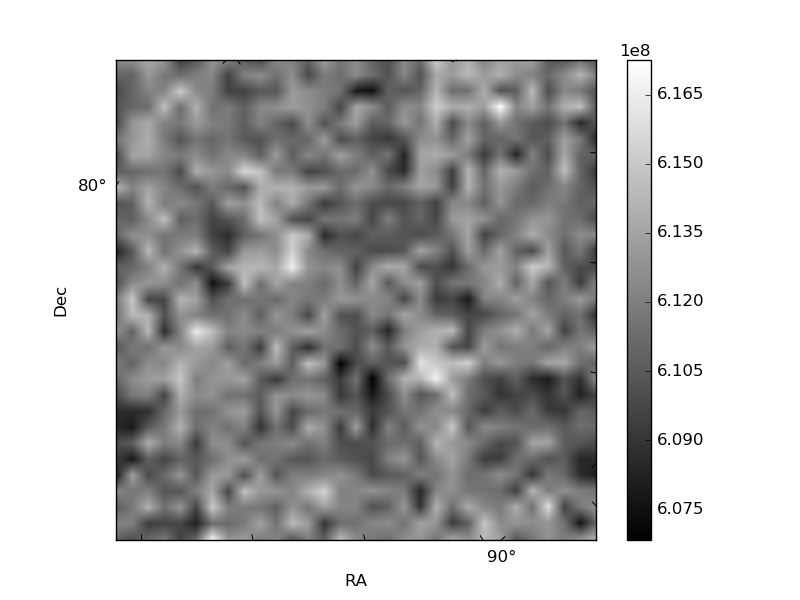
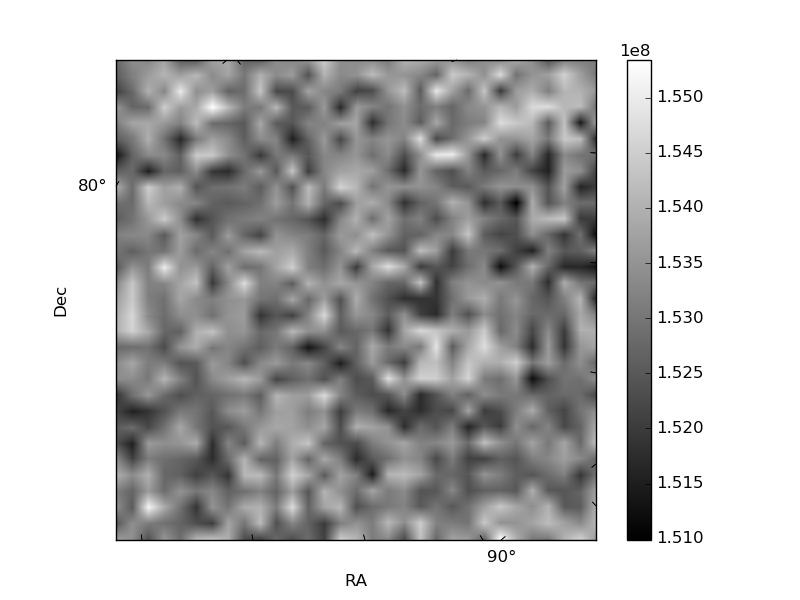
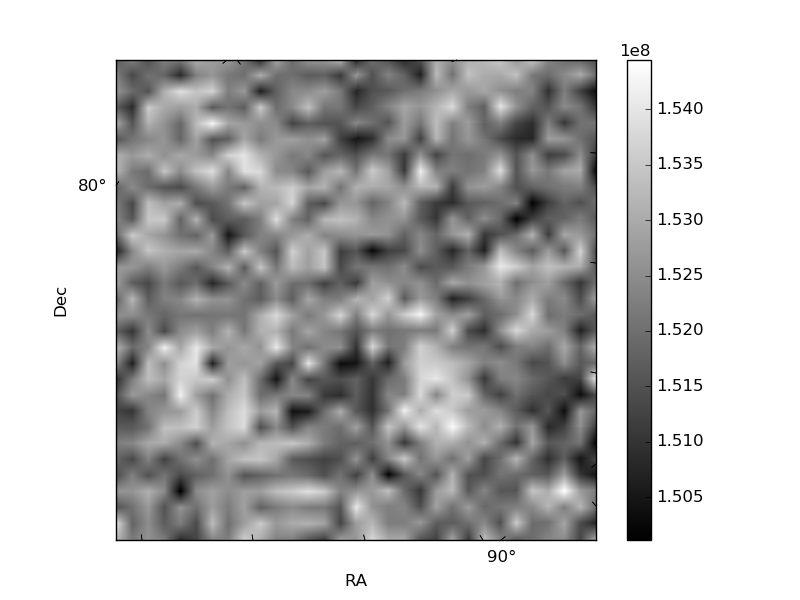
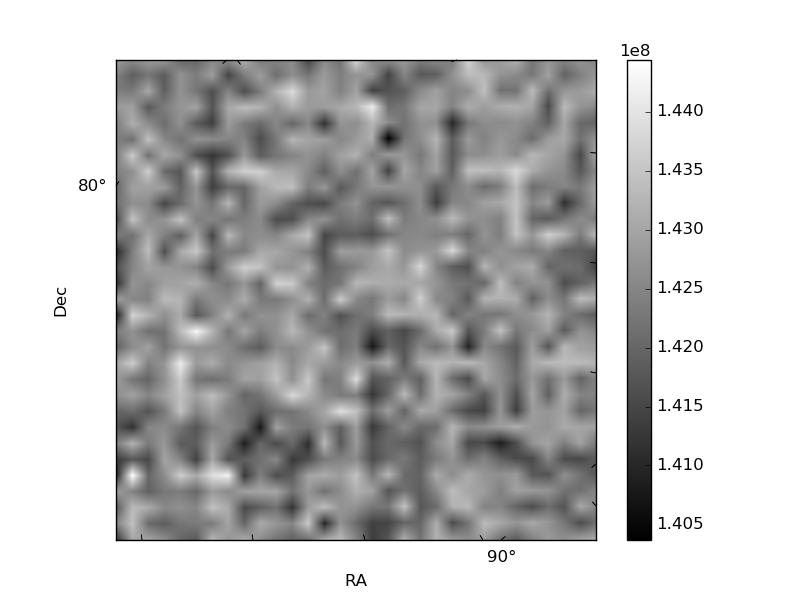
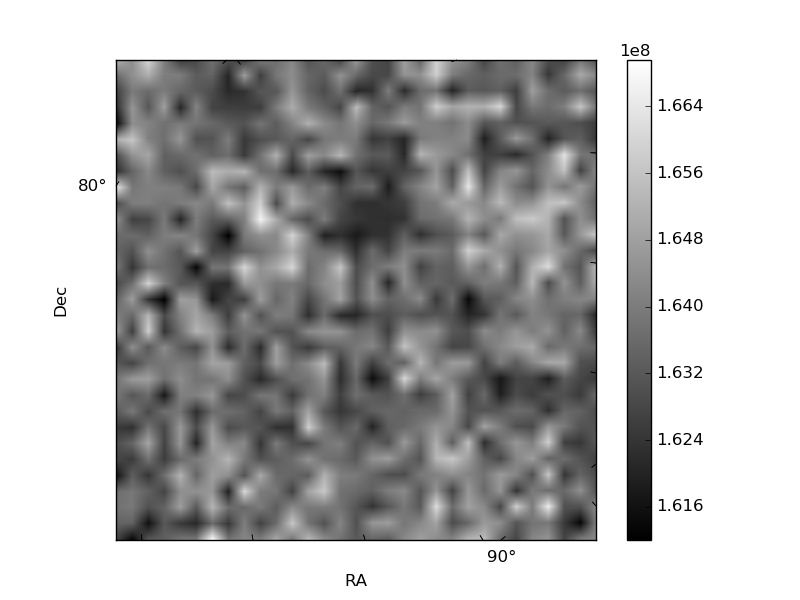
Histogram calculated using DETX and DETY for each event in the final _common_clean file
| Quadrant A | 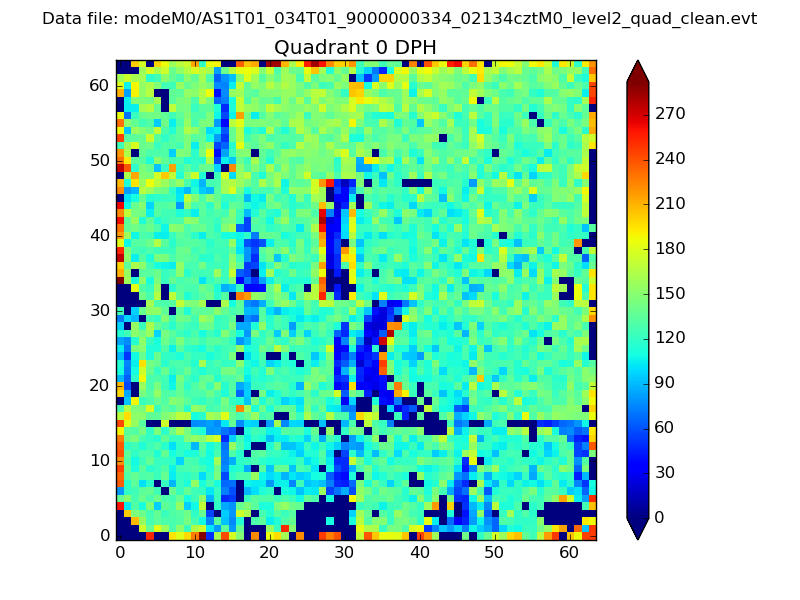 |
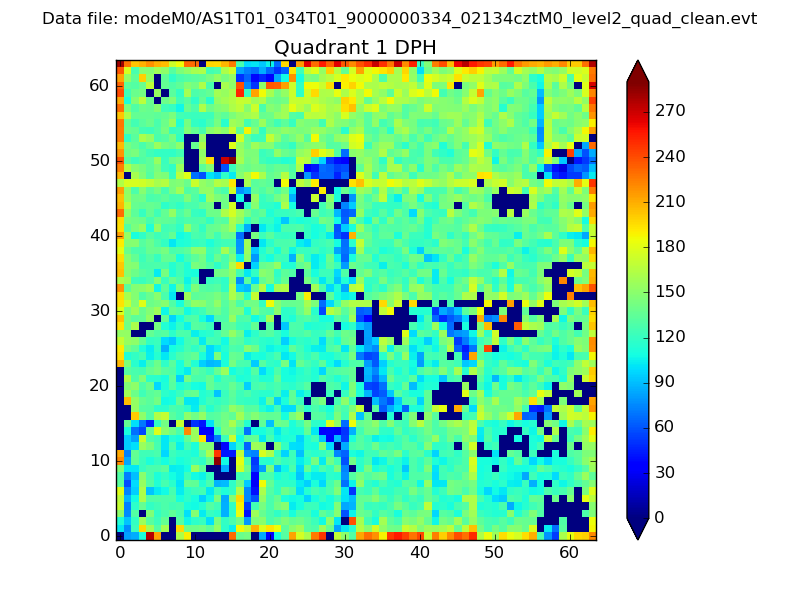 |
Quadrant B |
|---|---|---|---|
| Quadrant D | 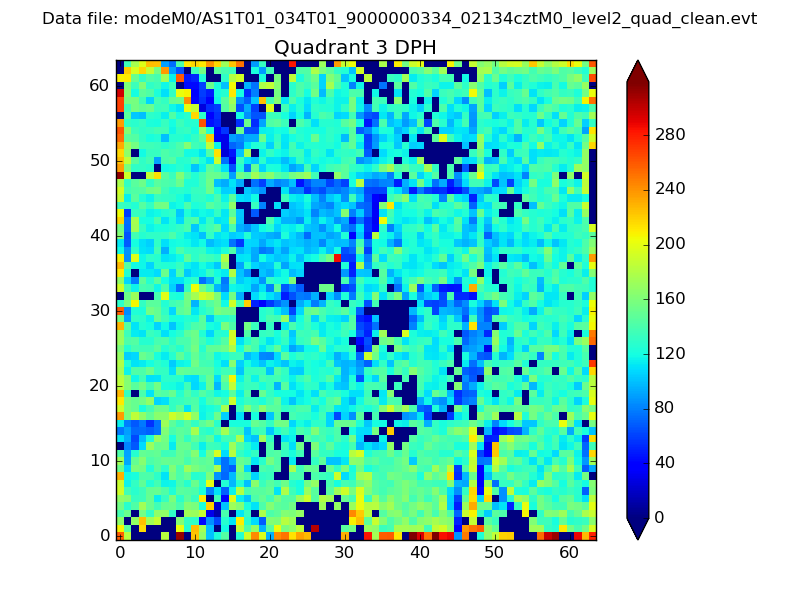 |
 |
Quadrant C |
| Plot type | Count rate plots | Images |
|---|---|---|
| Comparison with Poisson distribution Blue bars denote a histogram of data divided into 1 sec bins. Red curve is a Poisson curve with rate = median count rate of data. |
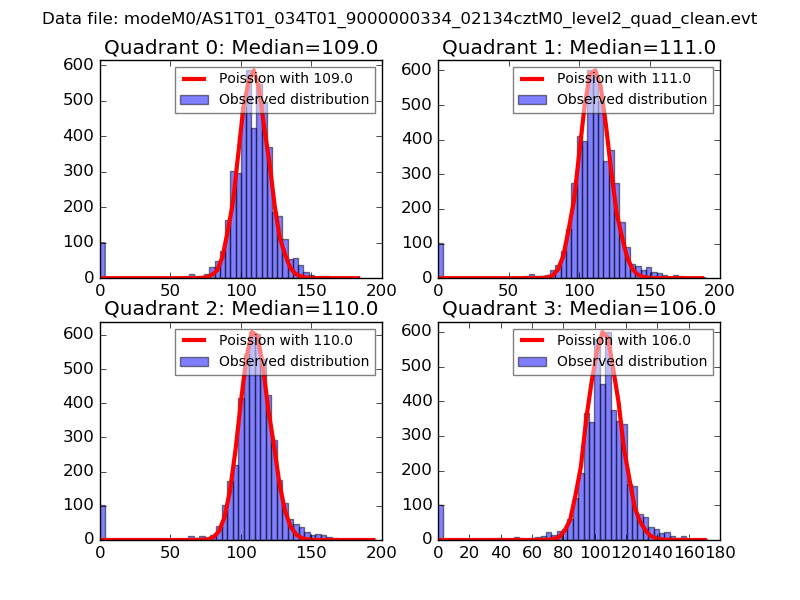 |
 |
| Quadrant-wise count rates Data is divided into 100 sec bins |
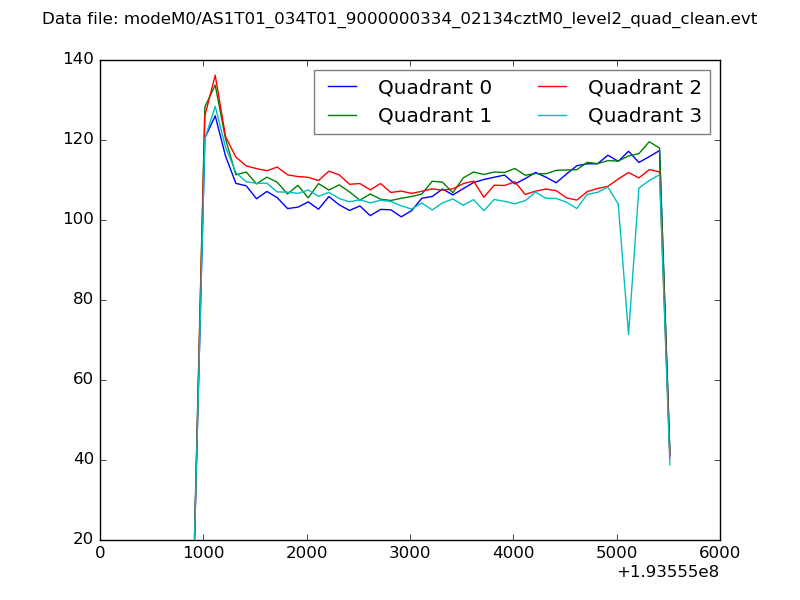 |
|
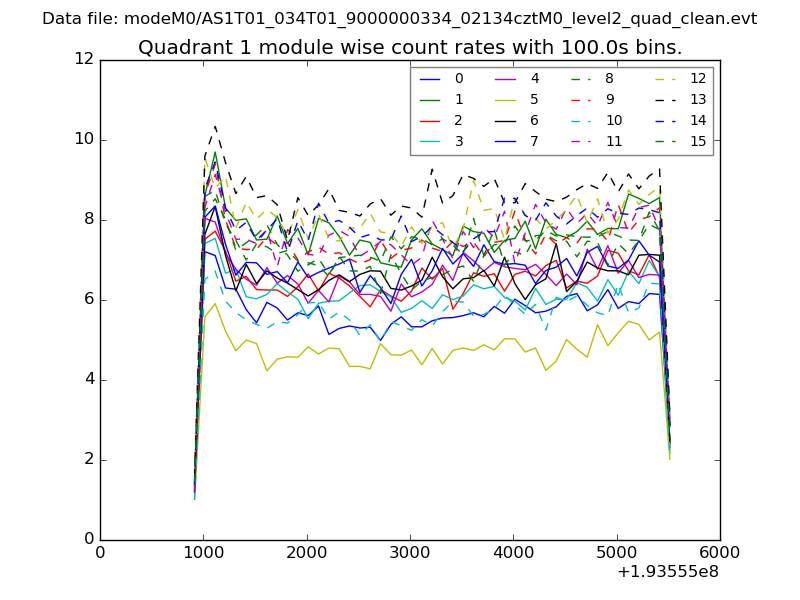
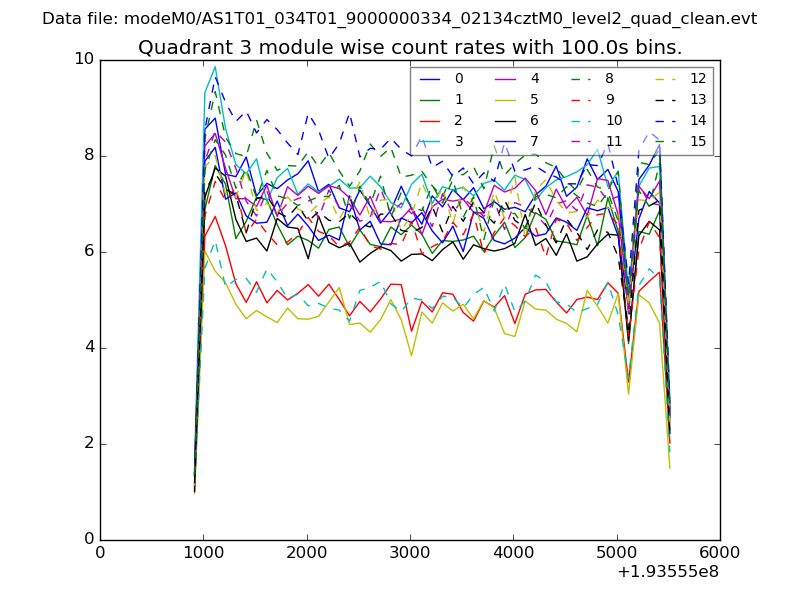
| Module-wise count rates for Quadrant A Data is divided into 100 sec bins |
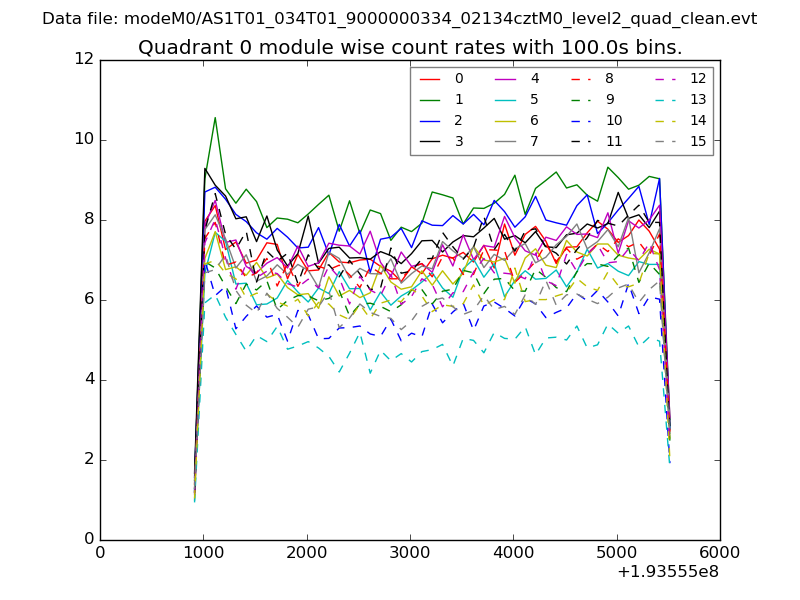 |
 |
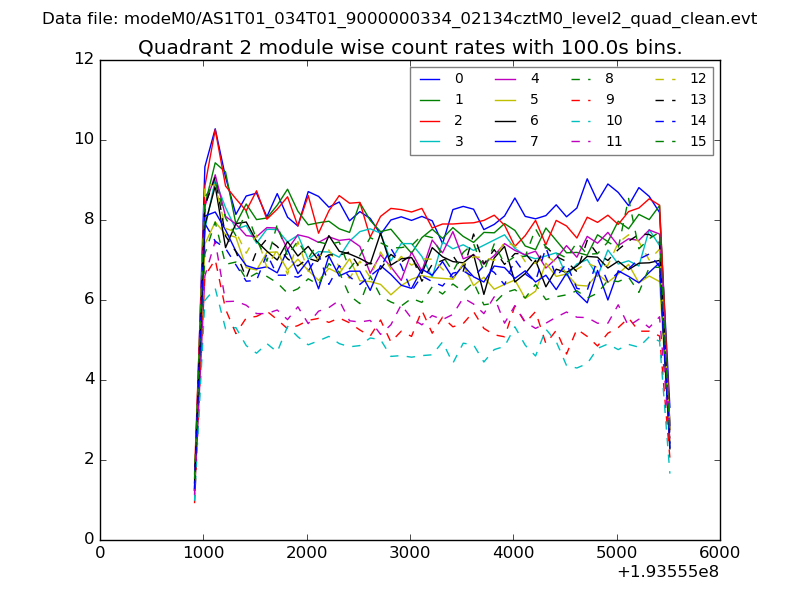
| Module-wise count rates for Quadrant B Data is divided into 100 sec bins |
 |
 |
| Module-wise count rates for Quadrant C Data is divided into 100 sec bins |
 |
 |
| Module-wise count rates for Quadrant D Data is divided into 100 sec bins |
 |
 |
| Parameter | Plot |
|---|---|
| CZT HV Monitor | 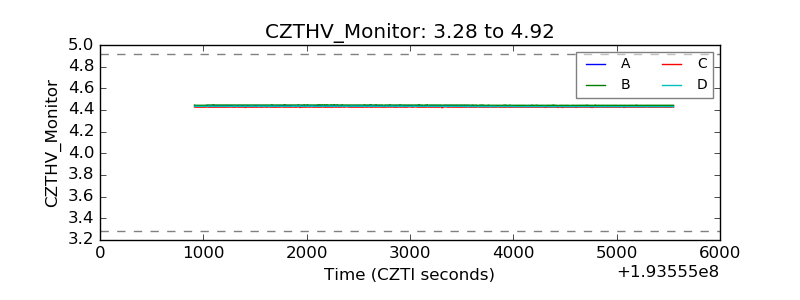 |
| D_VDD | 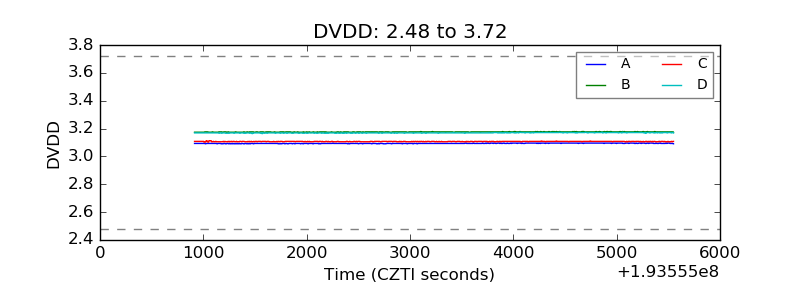 |
| Temperature 1 | 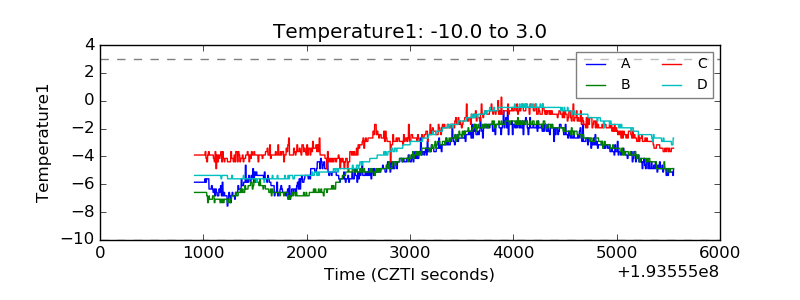 |
| Veto HV Monitor | 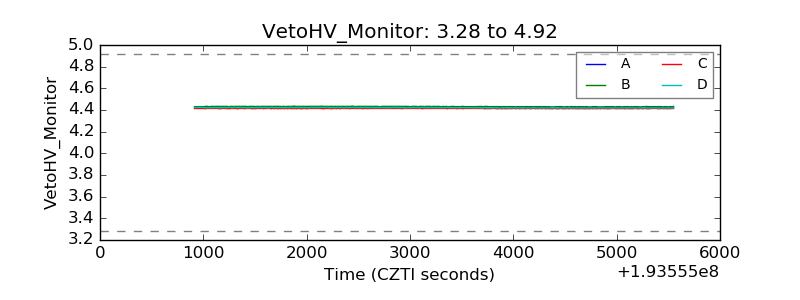 |
| Veto LLD | 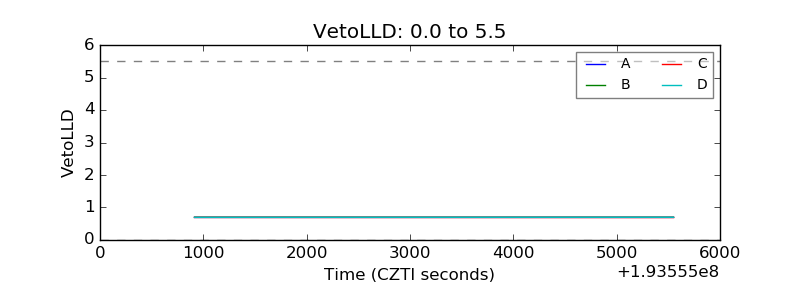 |
| Alpha Counter | 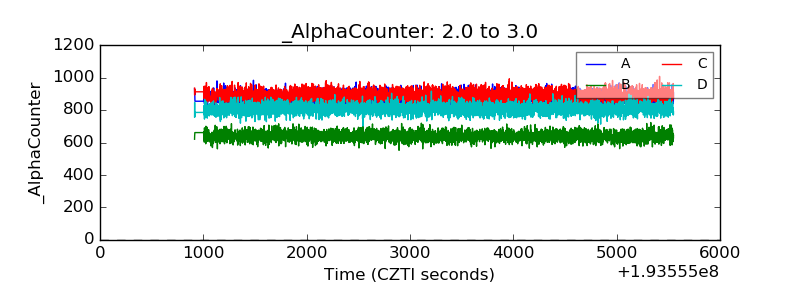 |
| _CPM_Rate | 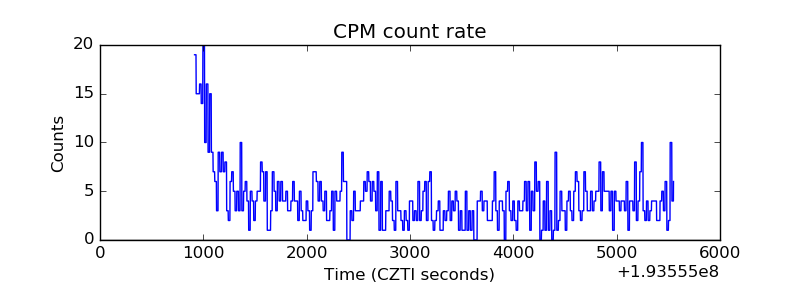 |
| CZT Counter | 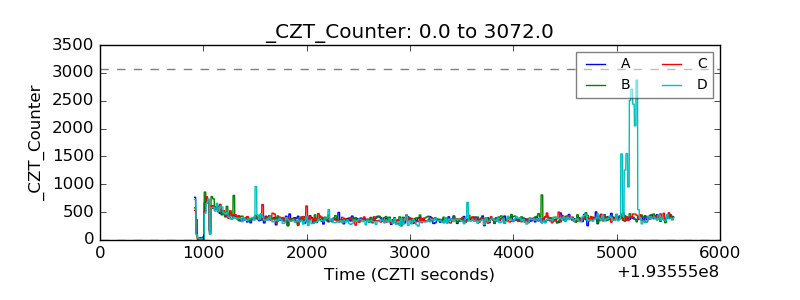 |
| +2.5 Volts monitor |  |
| +5 Volts monitor |  |
| _ROLL_ROT | 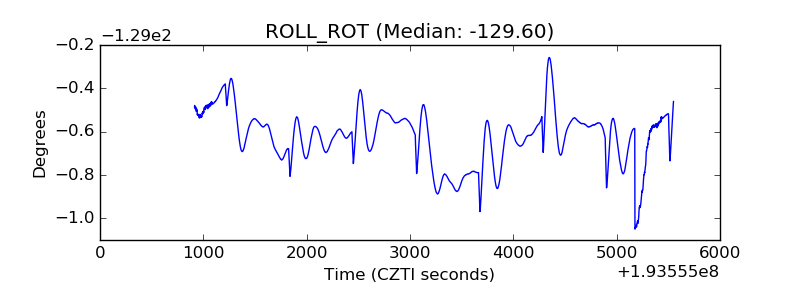 |
| _Roll_DEC | 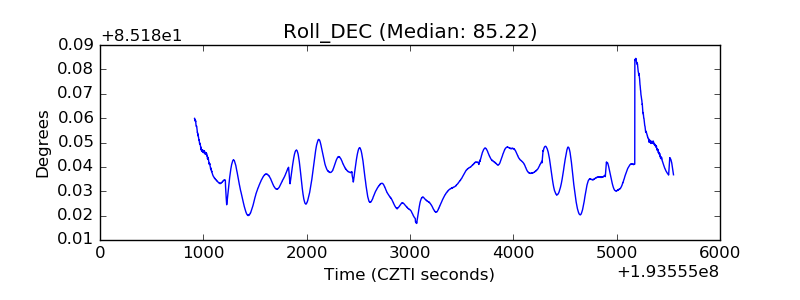 |
| _Roll_RA | 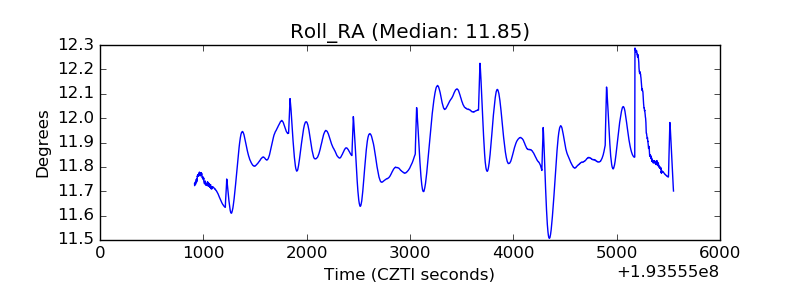 |
| Veto Counter | 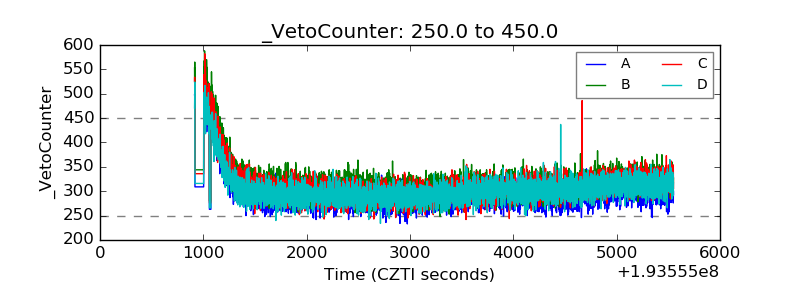 |