| Param | Original file | Final file |
|---|---|---|
| Filename | modeM0/AS1T01_051T01_9000000332cztM0_level2.fits | modeM0/AS1T01_051T01_9000000332cztM0_level2_quad_clean.evt |
| Size (bytes) | 170,040,960 | 264,801,600 |
| Size | 162.2 MB | 252.5 MB |
| Events in quadrant A | 969,480 | 1,708,045 |
| Events in quadrant B | 969,824 | 1,724,001 |
| Events in quadrant C | 968,168 | 1,654,384 |
| Events in quadrant D | 840,008 | 1,531,648 |
| Mode M0 | |||
|---|---|---|---|
| Quadrant | BADHDUFLAG | Total packets | Discarded packets |
| A | 0 | 45229 | 0 |
| B | 0 | 42122 | 0 |
| C | 0 | 41665 | 0 |
| D | 0 | 42726 | 0 |
| Mode SS | |||
|---|---|---|---|
| Quadrant | BADHDUFLAG | Total packets | Discarded packets |
| A | 0 | 406 | 0 |
| B | 0 | 406 | 0 |
| C | 0 | 406 | 0 |
| D | 0 | 406 | 0 |
| Mode M9 | |||
|---|---|---|---|
| Quadrant | BADHDUFLAG | Total packets | Discarded packets |
| A | 1 | 139811882838056 | 139809775419438 |
| B | 1 | 139811882838056 | 139809775419438 |
| C | 1 | 139811882838056 | 139809775419438 |
| D | 1 | 139811882838056 | 139809775419438 |
| Quadrant | Total seconds | Saturated seconds | Saturation percentage |
|---|---|---|---|
| A | 20364 | 407 | 1.998625% |
| B | 20364 | 102 | 0.500884% |
| C | 20364 | 95 | 0.466510% |
| D | 20364 | 166 | 0.815164% |
Noise dominated data is calculated using 1-second bins in cleaned event files. If a bin has >2000 counts, and if more than 50% of those come from <1% of pixels, then it is considered to be noise-dominated and hence unusable.
| Quadrant | # 1 sec bins | Bins with >0 counts | Bins with >2000 counts | High rate bins dominated by noise | Noise dominated (total time) | Noise dominated (detector-on time) | Marked lightcurve |
|---|---|---|---|---|---|---|---|
| A | 23175 | 20364 | 0 | 0 | 0.00% | 0.00% |  |
| B | 23175 | 20364 | 0 | 0 | 0.00% | 0.00% |  |
| C | 23175 | 20364 | 0 | 0 | 0.00% | 0.00% |  |
| D | 23175 | 20362 | 0 | 0 | 0.00% | 0.00% |  |
Top three noisy pixels from each quadrant. If the there are fewer than three noisy pixels in the level2.evt file, extra rows are filled as -1
| Pixel properties | Quadrant properties | ||||||
|---|---|---|---|---|---|---|---|
| Quadrant | DetID | PixID | Counts | Sigma | Mean | Median | Sigma |
| A | 14 | 188 | 902 | 11.15 | 251 | 235 | 59.8 |
| A | 0 | 29 | 894 | 11.01 | 251 | 235 | 59.8 |
| A | 7 | 110 | 869 | 10.6 | 251 | 235 | 59.8 |
| B | 2 | 9 | 754 | 10.46 | 256 | 243 | 48.9 |
| B | 5 | 128 | 646 | 8.25 | 256 | 243 | 48.9 |
| B | 14 | 254 | 640 | 8.12 | 256 | 243 | 48.9 |
| C | 3 | 235 | 671 | 6.84 | 255 | 236 | 63.6 |
| C | 1 | 81 | 656 | 6.6 | 255 | 236 | 63.6 |
| C | 12 | 241 | 650 | 6.51 | 255 | 236 | 63.6 |
| D | 6 | 231 | 624 | 6.93 | 239 | 218 | 58.6 |
| D | 6 | 38 | 613 | 6.74 | 239 | 218 | 58.6 |
| D | 6 | 44 | 607 | 6.64 | 239 | 218 | 58.6 |
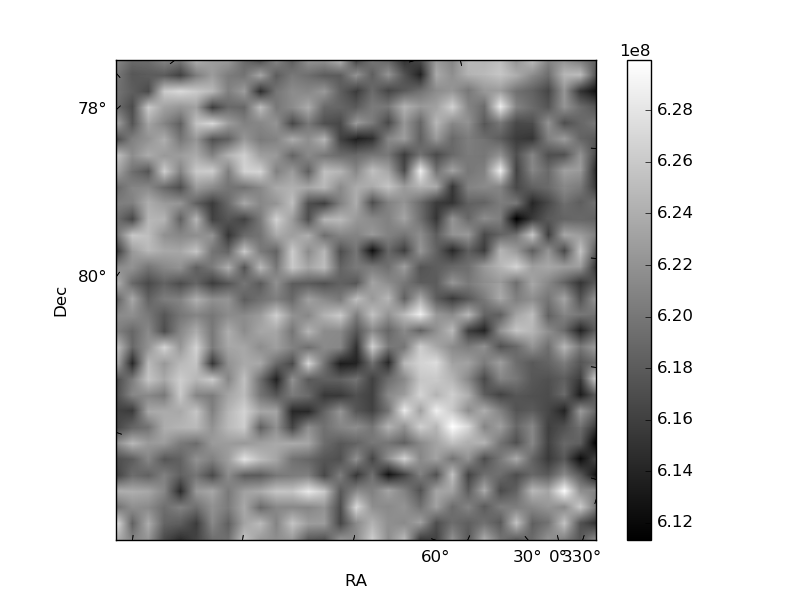
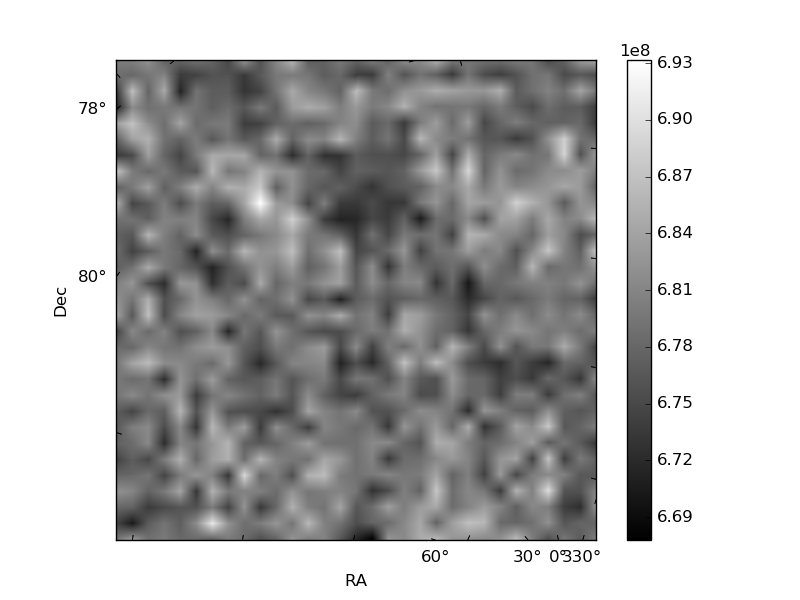
Histogram calculated using DETX and DETY for each event in the final _common_clean file
| Quadrant A | 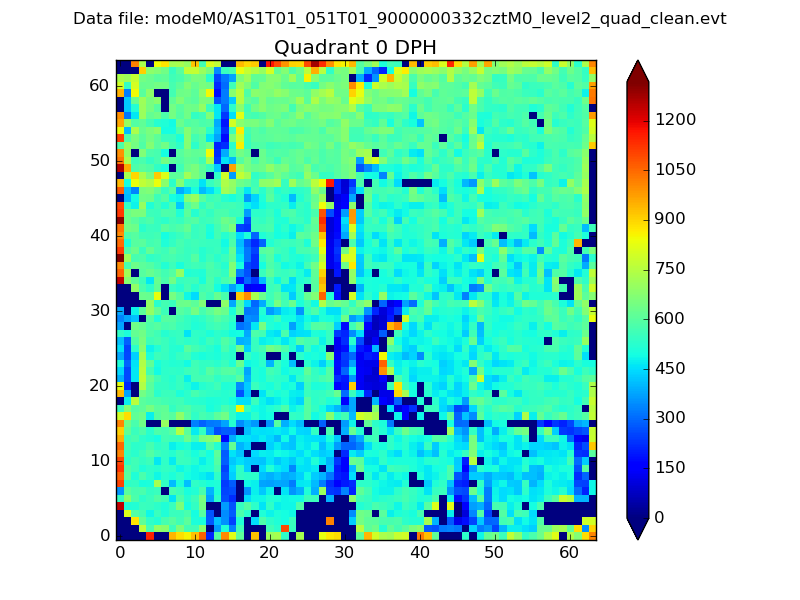 |
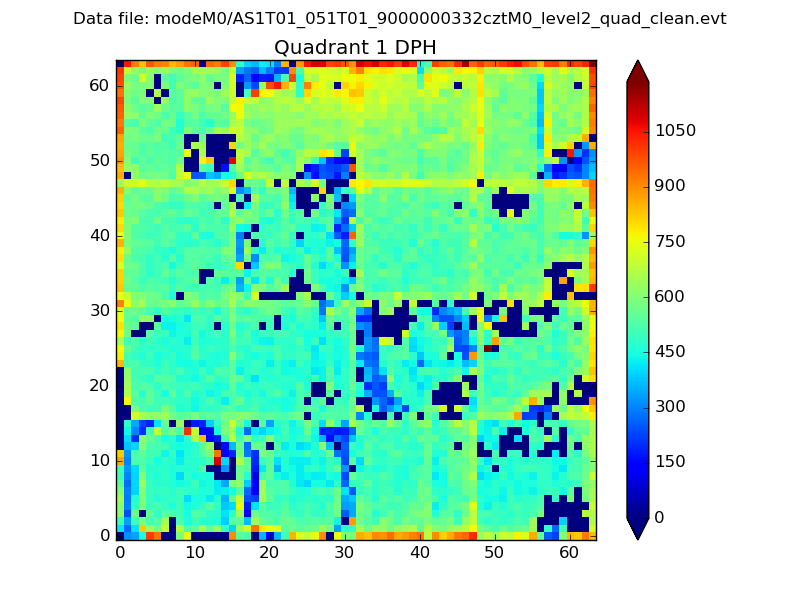 |
Quadrant B |
|---|---|---|---|
| Quadrant D | 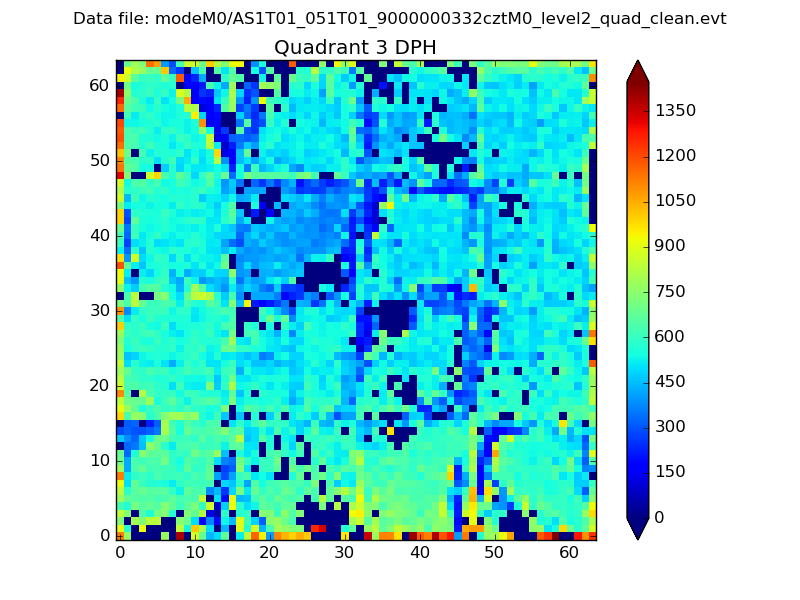 |
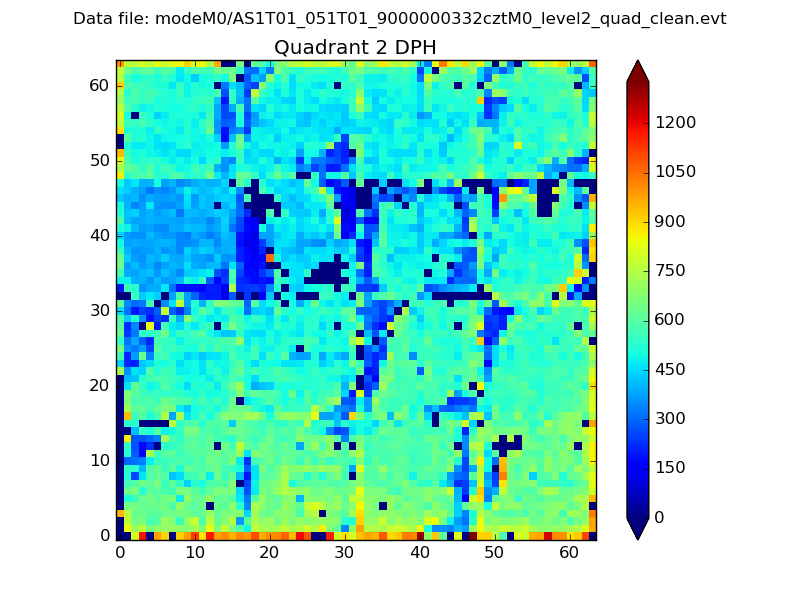 |
Quadrant C |
| Plot type | Count rate plots | Images |
|---|---|---|
| Comparison with Poisson distribution Blue bars denote a histogram of data divided into 1 sec bins. Red curve is a Poisson curve with rate = median count rate of data. |
 |
 |
| Quadrant-wise count rates Data is divided into 100 sec bins |
 |
|
| Module-wise count rates for Quadrant A Data is divided into 100 sec bins |
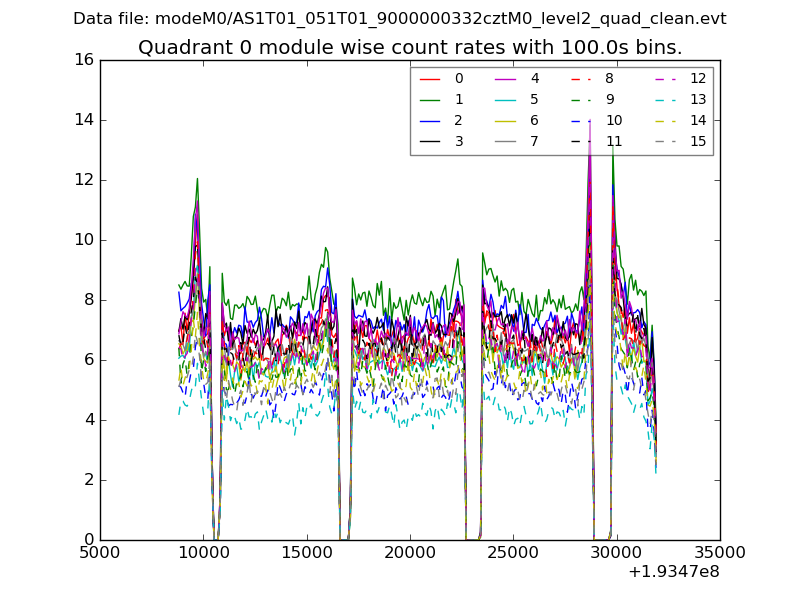 |
 |
| Module-wise count rates for Quadrant B Data is divided into 100 sec bins |
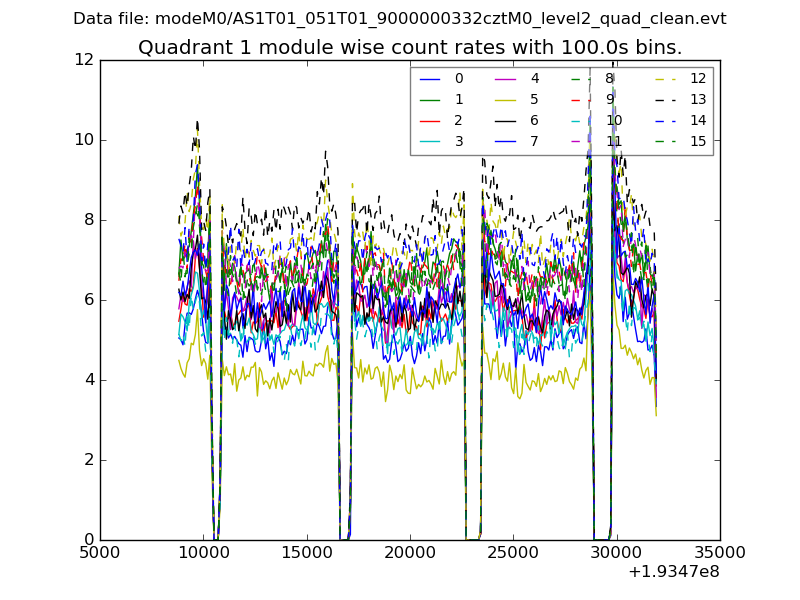 |
 |
| Module-wise count rates for Quadrant C Data is divided into 100 sec bins |
 |
 |
| Module-wise count rates for Quadrant D Data is divided into 100 sec bins |
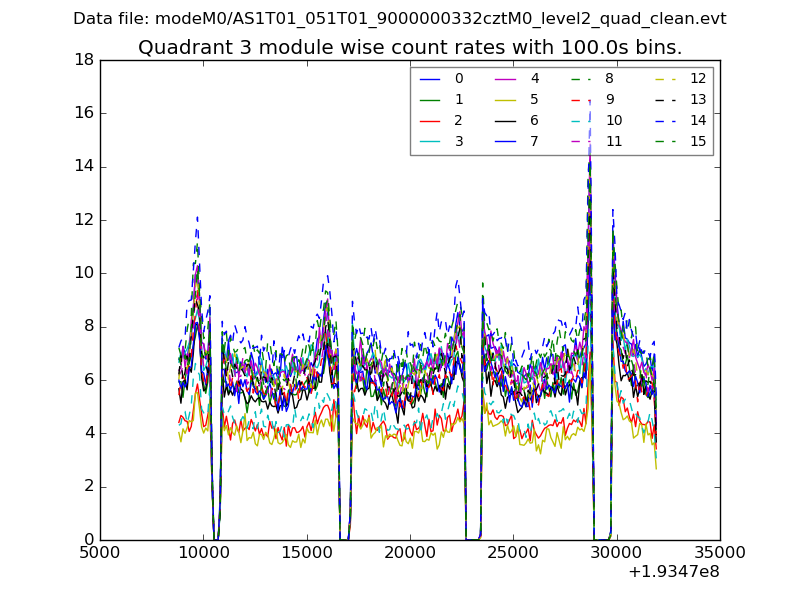 |
 |
| Parameter | Plot |
|---|---|
| CZT HV Monitor |  |
| D_VDD |  |
| Temperature 1 | 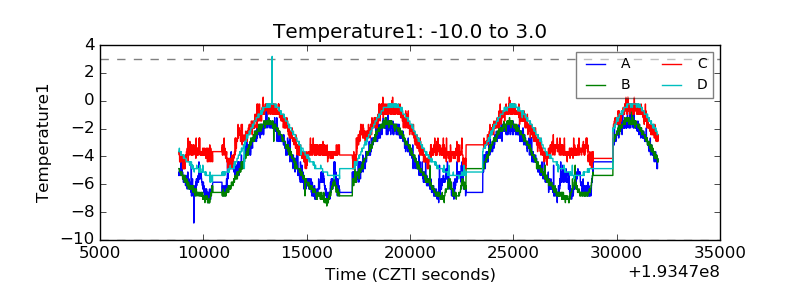 |
| Veto HV Monitor | 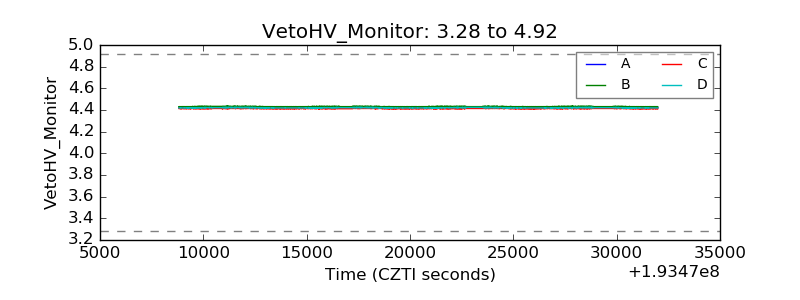 |
| Veto LLD | 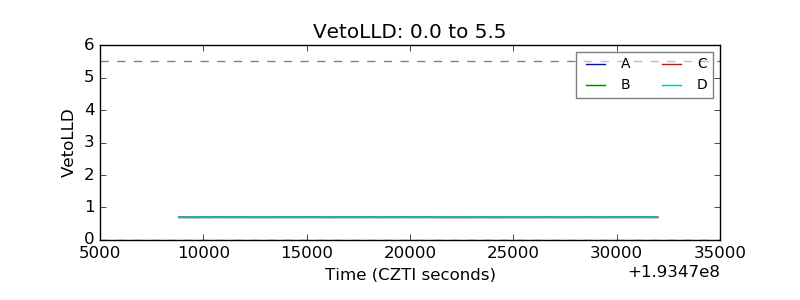 |
| Alpha Counter |  |
| _CPM_Rate |  |
| CZT Counter | 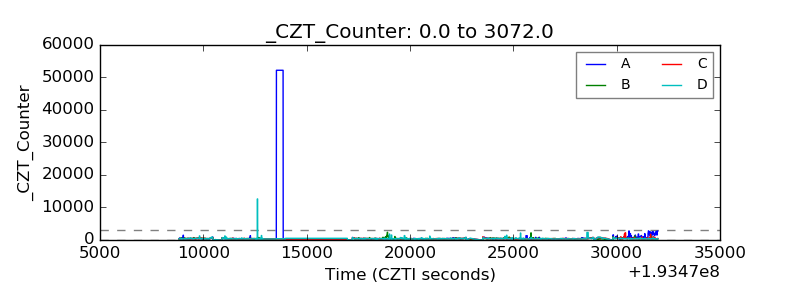 |
| +2.5 Volts monitor | 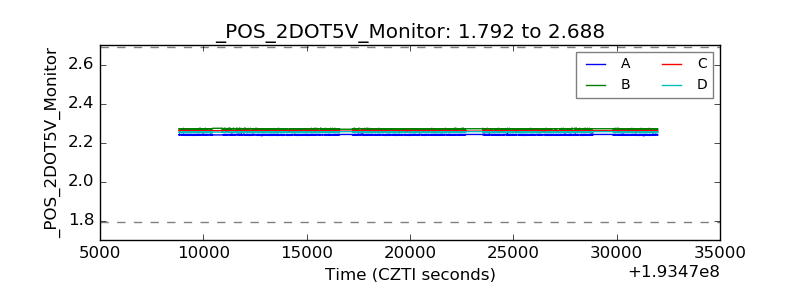 |
| +5 Volts monitor |  |
| _ROLL_ROT | 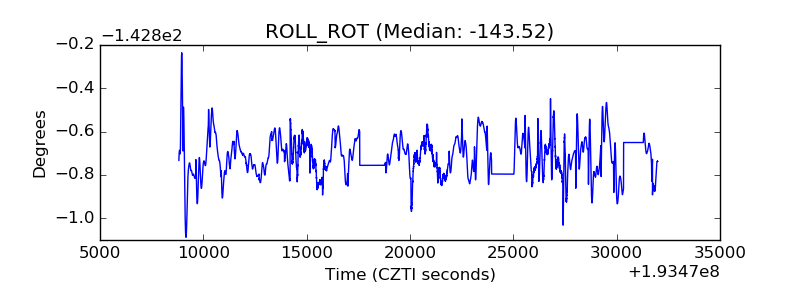 |
| _Roll_DEC | 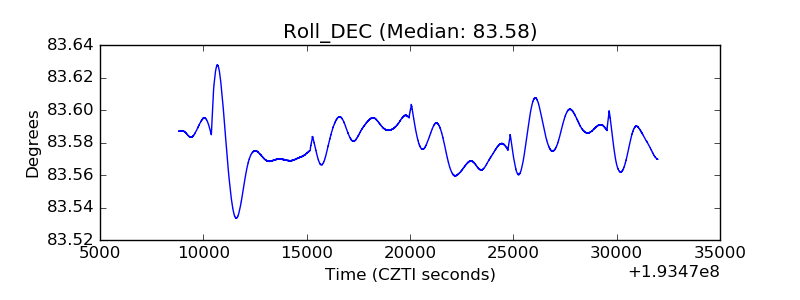 |
| _Roll_RA |  |
| Veto Counter | 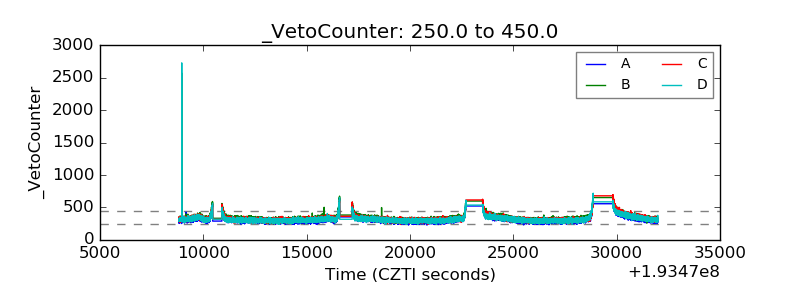 |