| Param | Original file | Final file |
|---|---|---|
| Filename | modeM0/AS1T01_072T02_9000000336cztM0_level2.fits | modeM0/AS1T01_072T02_9000000336cztM0_level2_quad_clean.evt |
| Size (bytes) | 809,484,480 | 928,212,480 |
| Size | 772.0 MB | 885.2 MB |
| Events in quadrant A | 4,627,048 | 5,600,546 |
| Events in quadrant B | 4,646,396 | 5,668,256 |
| Events in quadrant C | 4,627,068 | 5,322,932 |
| Events in quadrant D | 4,010,384 | 4,917,936 |
| Mode M0 | |||
|---|---|---|---|
| Quadrant | BADHDUFLAG | Total packets | Discarded packets |
| A | 0 | 204487 | 0 |
| B | 0 | 207774 | 0 |
| C | 0 | 196782 | 0 |
| D | 0 | 202769 | 0 |
| Mode SS | |||
|---|---|---|---|
| Quadrant | BADHDUFLAG | Total packets | Discarded packets |
| A | 0 | 1930 | 0 |
| B | 0 | 1930 | 0 |
| C | 0 | 1930 | 0 |
| D | 0 | 1930 | 0 |
| Mode M9 | |||
|---|---|---|---|
| Quadrant | BADHDUFLAG | Total packets | Discarded packets |
| A | 1 | 140287632291880 | 140286516789294 |
| B | 1 | 140287632291880 | 140286516789294 |
| C | 1 | 140287632291880 | 140286516789294 |
| D | 1 | 140287632291880 | 140286516789294 |
| Quadrant | Total seconds | Saturated seconds | Saturation percentage |
|---|---|---|---|
| A | 96334 | 1676 | 1.739780% |
| B | 96332 | 548 | 0.568866% |
| C | 96332 | 311 | 0.322842% |
| D | 96332 | 961 | 0.997592% |
Noise dominated data is calculated using 1-second bins in cleaned event files. If a bin has >2000 counts, and if more than 50% of those come from <1% of pixels, then it is considered to be noise-dominated and hence unusable.
| Quadrant | # 1 sec bins | Bins with >0 counts | Bins with >2000 counts | High rate bins dominated by noise | Noise dominated (total time) | Noise dominated (detector-on time) | Marked lightcurve |
|---|---|---|---|---|---|---|---|
| A | 110106 | 96055 | 0 | 0 | 0.00% | 0.00% |  |
| B | 110106 | 96329 | 0 | 0 | 0.00% | 0.00% |  |
| C | 110106 | 96327 | 0 | 0 | 0.00% | 0.00% |  |
| D | 110106 | 96313 | 0 | 0 | 0.00% | 0.00% | 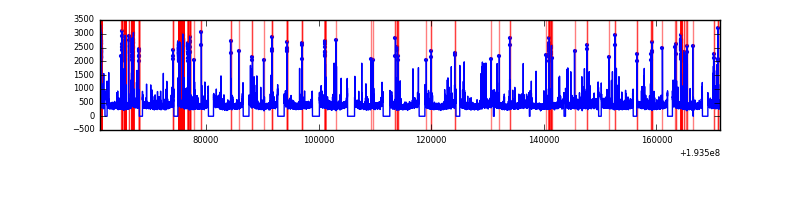 |
Top three noisy pixels from each quadrant. If the there are fewer than three noisy pixels in the level2.evt file, extra rows are filled as -1
| Pixel properties | Quadrant properties | ||||||
|---|---|---|---|---|---|---|---|
| Quadrant | DetID | PixID | Counts | Sigma | Mean | Median | Sigma |
| A | 7 | 110 | 4149 | 10.86 | 1200 | 1118 | 279.1 |
| A | 0 | 29 | 3309 | 7.85 | 1200 | 1118 | 279.1 |
| A | 0 | 30 | 3247 | 7.63 | 1200 | 1118 | 279.1 |
| B | 2 | 9 | 3701 | 11.2 | 1229 | 1162 | 226.6 |
| B | 5 | 128 | 3035 | 8.26 | 1229 | 1162 | 226.6 |
| B | 10 | 225 | 2945 | 7.87 | 1229 | 1162 | 226.6 |
| C | 12 | 241 | 3143 | 6.86 | 1220 | 1125 | 294.1 |
| C | 2 | 127 | 3015 | 6.43 | 1220 | 1125 | 294.1 |
| C | 1 | 81 | 2989 | 6.34 | 1220 | 1125 | 294.1 |
| D | 1 | 19 | 2939 | 6.98 | 1144 | 1045 | 271.4 |
| D | 11 | 82 | 2892 | 6.81 | 1144 | 1045 | 271.4 |
| D | 6 | 231 | 2850 | 6.65 | 1144 | 1045 | 271.4 |
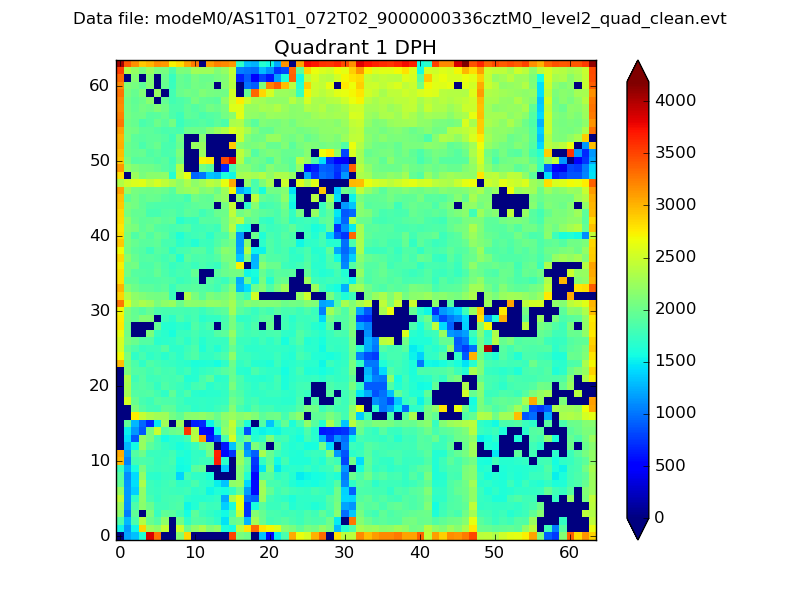
Histogram calculated using DETX and DETY for each event in the final _common_clean file
| Quadrant A |  |
 |
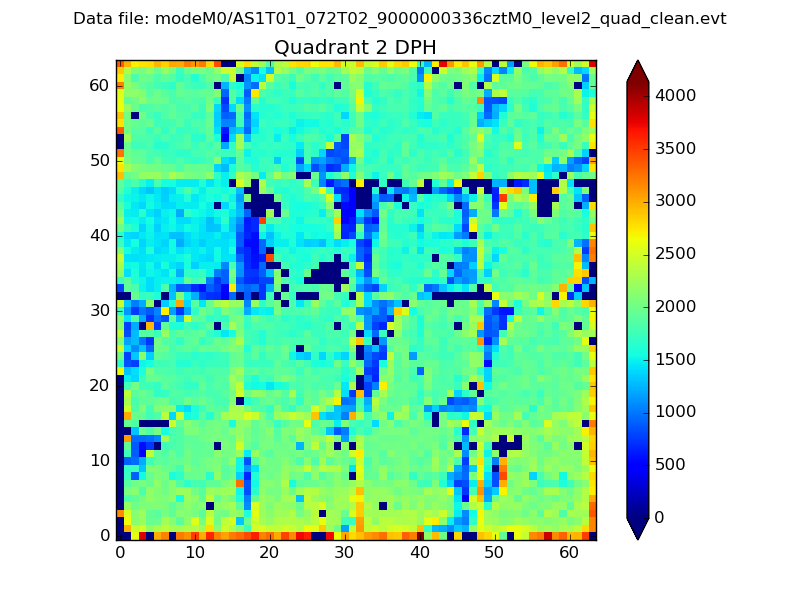
Quadrant B |
|---|---|---|---|
| Quadrant D |  |
 |
Quadrant C |
| Plot type | Count rate plots | Images |
|---|---|---|
| Comparison with Poisson distribution Blue bars denote a histogram of data divided into 1 sec bins. Red curve is a Poisson curve with rate = median count rate of data. |
 |
 |
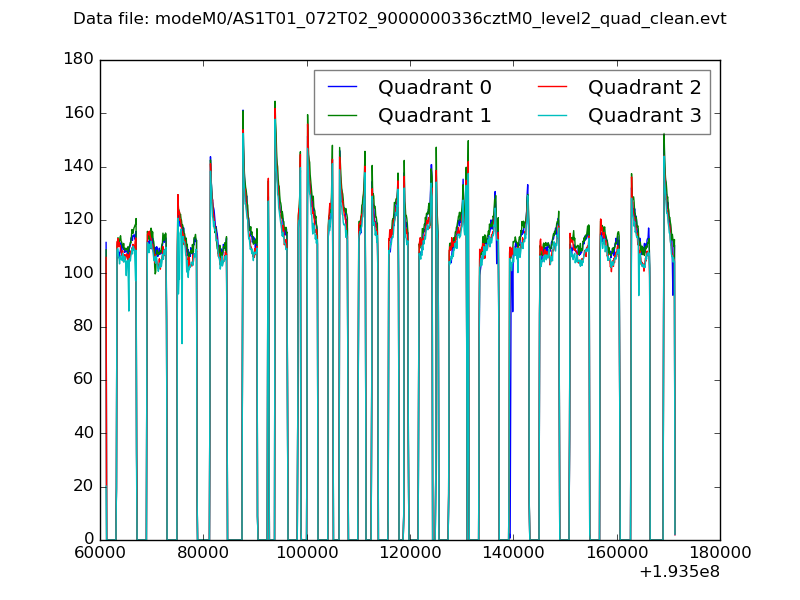
| Quadrant-wise count rates Data is divided into 100 sec bins |
 |
|
| Module-wise count rates for Quadrant A Data is divided into 100 sec bins |
 |
 |
| Module-wise count rates for Quadrant B Data is divided into 100 sec bins |
 |
 |
| Module-wise count rates for Quadrant C Data is divided into 100 sec bins |
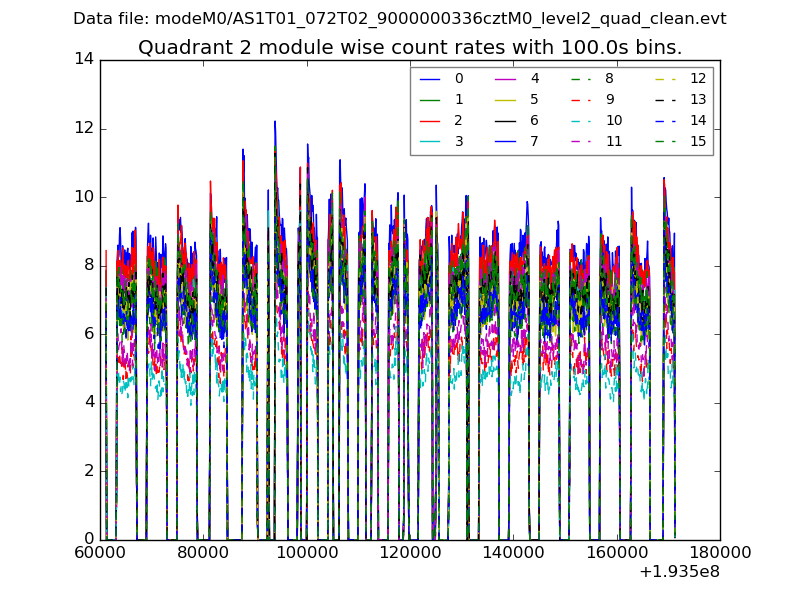 |
 |
| Module-wise count rates for Quadrant D Data is divided into 100 sec bins |
 |
 |
| Parameter | Plot |
|---|---|
| CZT HV Monitor | 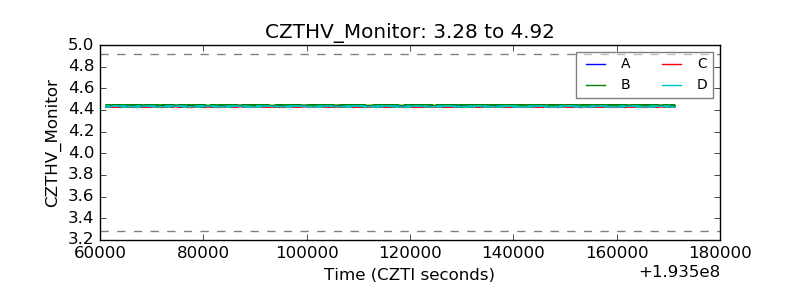 |
| D_VDD |  |
| Temperature 1 |  |
| Veto HV Monitor | 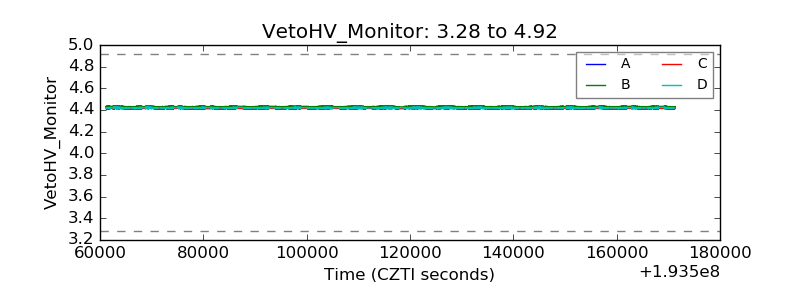 |
| Veto LLD |  |
| Alpha Counter |  |
| _CPM_Rate | 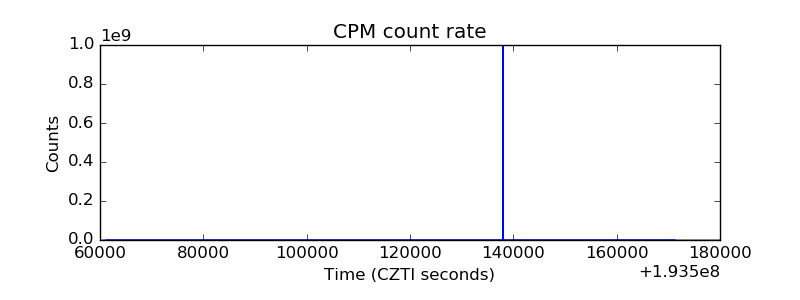 |
| CZT Counter |  |
| +2.5 Volts monitor |  |
| +5 Volts monitor | 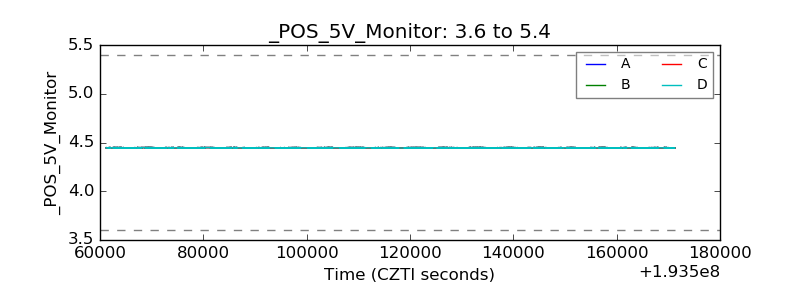 |
| _ROLL_ROT | 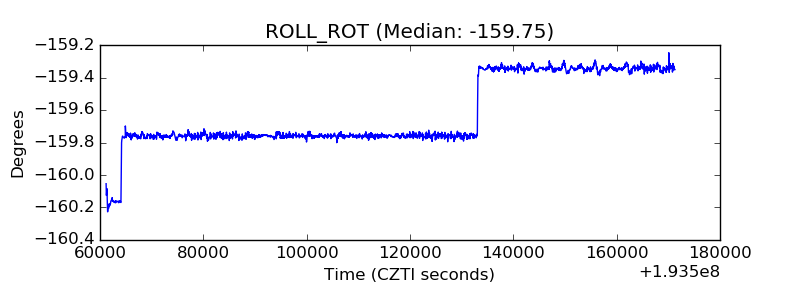 |
| _Roll_DEC | 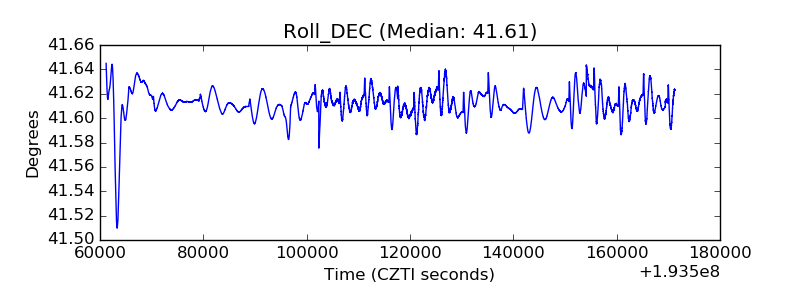 |
| _Roll_RA |  |
| Veto Counter |  |