| Param | Original file | Final file |
|---|---|---|
| Filename | modeM0/AS1T01_072T02_9000000336_02136cztM0_level2.evt | modeM0/AS1T01_072T02_9000000336_02136cztM0_level2_quad_clean.evt |
| Size (bytes) | 398,376,000 | 87,672,960 |
| Size | 379.9 MB | 83.6 MB |
| Events in quadrant A | 2,638,226 | 562,328 |
| Events in quadrant B | 3,230,688 | 567,081 |
| Events in quadrant C | 2,545,414 | 552,346 |
| Events in quadrant D | 3,222,099 | 534,201 |
| Mode M0 | |||
|---|---|---|---|
| Quadrant | BADHDUFLAG | Total packets | Discarded packets |
| A | 0 | 12831 | 1 |
| B | 0 | 14073 | 1 |
| C | 0 | 12712 | 1 |
| D | 0 | 14835 | 1 |
| Mode SS | |||
|---|---|---|---|
| Quadrant | BADHDUFLAG | Total packets | Discarded packets |
| A | 0 | 126 | 0 |
| B | 0 | 126 | 0 |
| C | 0 | 126 | 0 |
| D | 0 | 126 | 0 |
| Mode M9 | |||
|---|---|---|---|
| Quadrant | BADHDUFLAG | Total packets | Discarded packets |
| A | 0 | 1 | 0 |
| B | 1 | 1 | 0 |
| C | 1 | -1 | -1 |
| D | 1 | -1 | -1 |
| Quadrant | Total seconds | Saturated seconds | Saturation percentage |
|---|---|---|---|
| A | 6289 | 31 | 0.492924% |
| B | 6289 | 25 | 0.397519% |
| C | 6289 | 12 | 0.190809% |
| D | 6289 | 284 | 4.515821% |
Noise dominated data is calculated using 1-second bins in cleaned event files. If a bin has >2000 counts, and if more than 50% of those come from <1% of pixels, then it is considered to be noise-dominated and hence unusable.
| Quadrant | # 1 sec bins | Bins with >0 counts | Bins with >2000 counts | High rate bins dominated by noise | Noise dominated (total time) | Noise dominated (detector-on time) | Marked lightcurve |
|---|---|---|---|---|---|---|---|
| A | 7019 | 6290 | 0 | 0 | 0.00% | 0.00% | 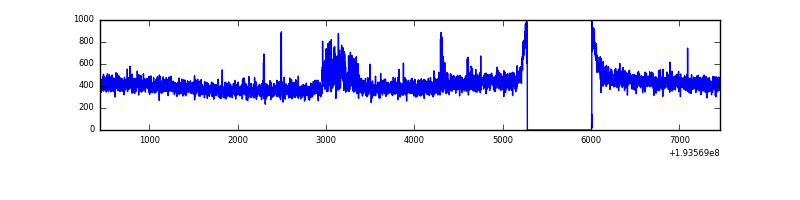 |
| B | 7019 | 6290 | 21 | 21 | 0.30% | 0.33% | 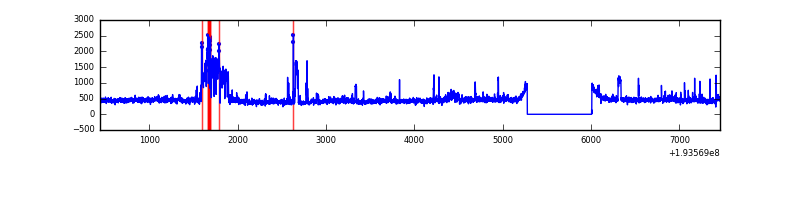 |
| C | 7019 | 6290 | 0 | 0 | 0.00% | 0.00% | 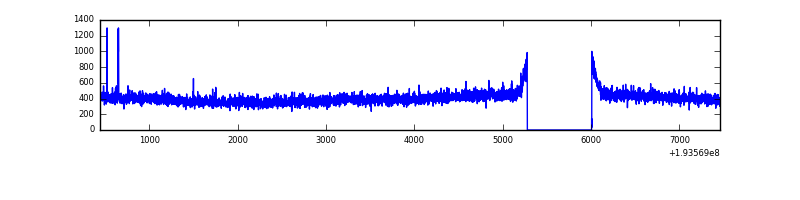 |
| D | 7019 | 6290 | 302 | 302 | 4.30% | 4.80% | 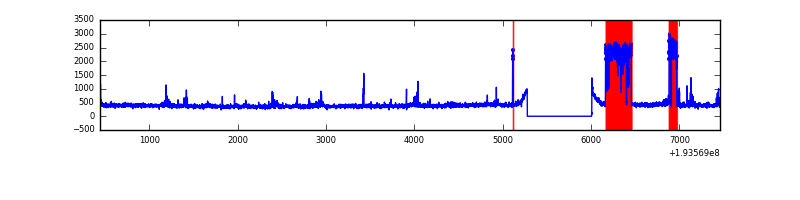 |
Top three noisy pixels from each quadrant. If the there are fewer than three noisy pixels in the level2.evt file, extra rows are filled as -1
| Pixel properties | Quadrant properties | ||||||
|---|---|---|---|---|---|---|---|
| Quadrant | DetID | PixID | Counts | Sigma | Mean | Median | Sigma |
| A | 0 | 231 | 62959 | 472.17 | 665 | 654 | 132.0 |
| A | 15 | 171 | 18418 | 134.62 | 665 | 654 | 132.0 |
| A | 0 | 1 | 3465 | 21.3 | 665 | 654 | 132.0 |
| B | 5 | 68 | 413345 | 3314.27 | 680 | 668 | 124.5 |
| B | 4 | 48 | 130511 | 1042.79 | 680 | 668 | 124.5 |
| B | 0 | 234 | 35972 | 283.53 | 680 | 668 | 124.5 |
| C | 1 | 3 | 9343 | 61.1 | 645 | 647 | 142.3 |
| C | 9 | 236 | 4498 | 27.06 | 645 | 647 | 142.3 |
| C | 10 | 82 | 4417 | 26.49 | 645 | 647 | 142.3 |
| D | 2 | 31 | 752225 | 5185.64 | 637 | 623 | 144.9 |
| D | 9 | 64 | 18386 | 122.55 | 637 | 623 | 144.9 |
| D | 10 | 199 | 11335 | 73.91 | 637 | 623 | 144.9 |
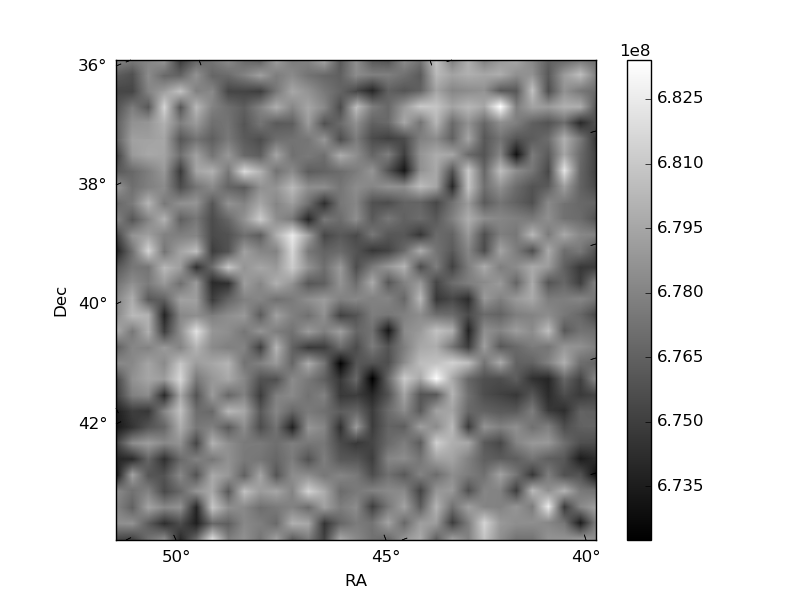
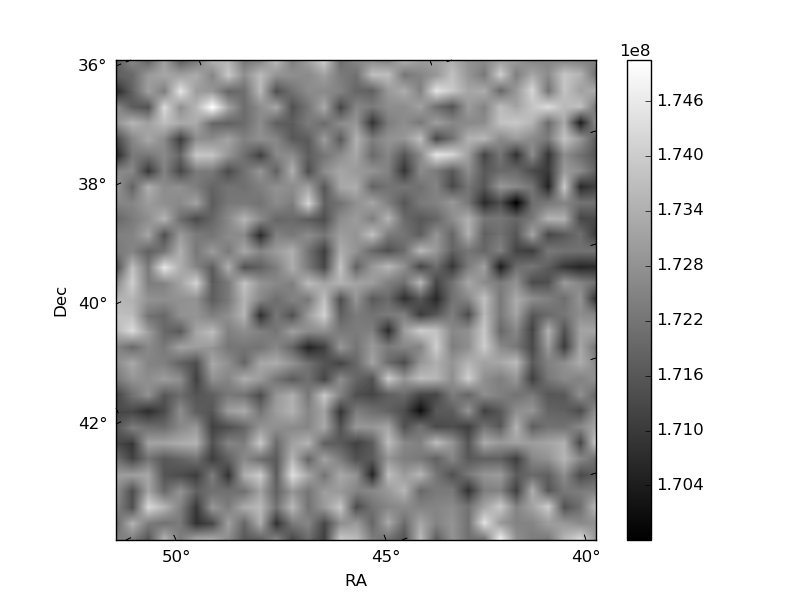
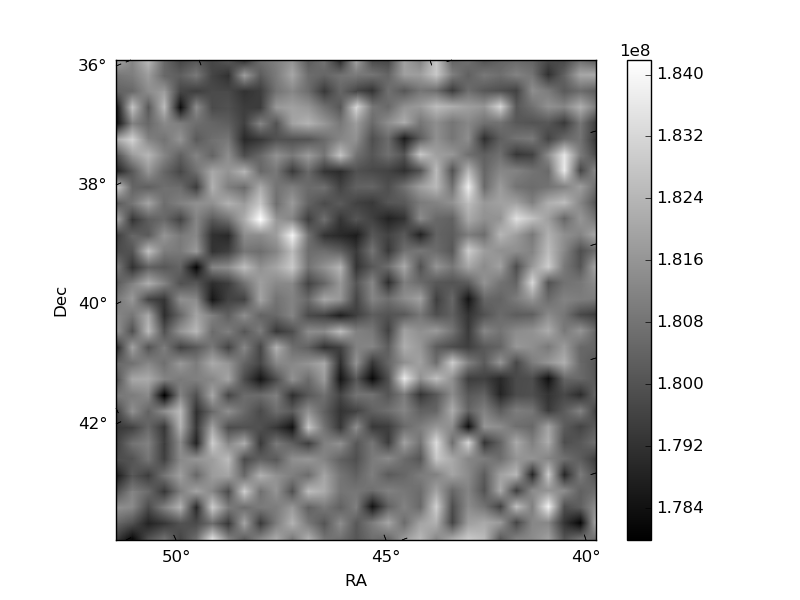
Histogram calculated using DETX and DETY for each event in the final _common_clean file
| Quadrant A | 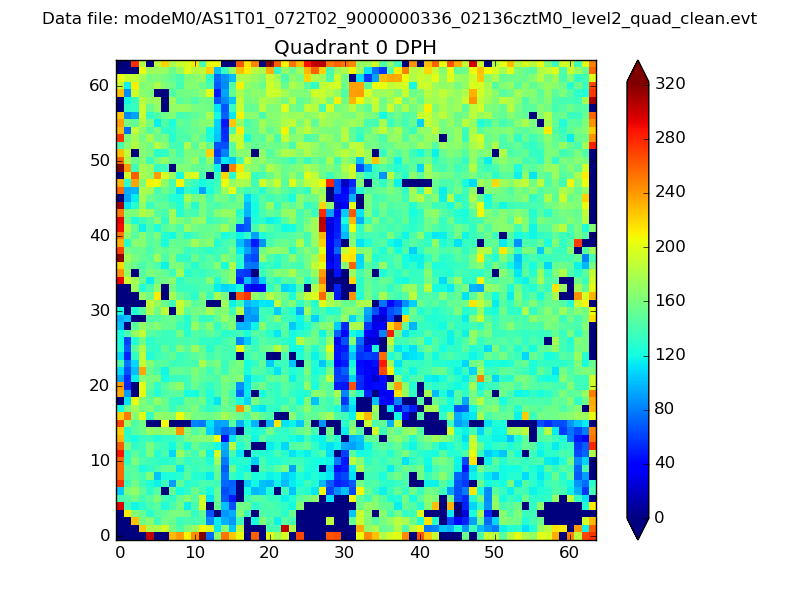 |
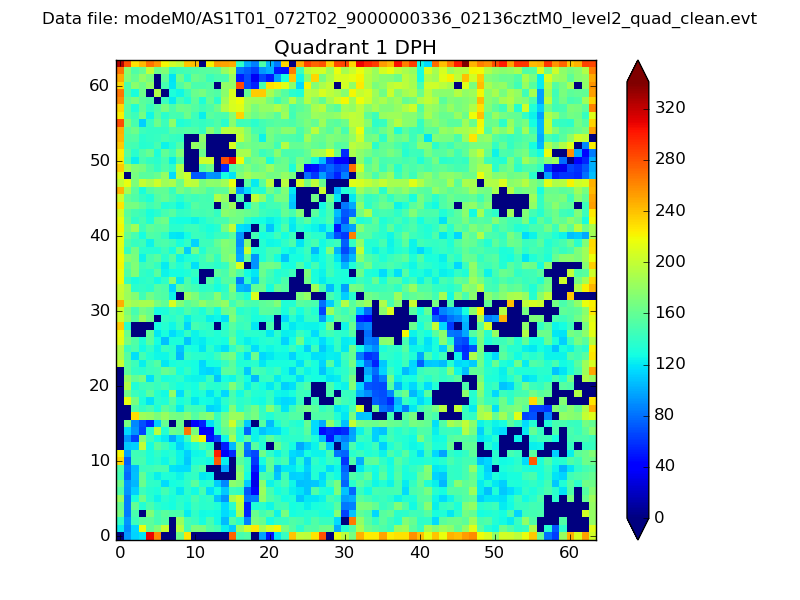 |
Quadrant B |
|---|---|---|---|
| Quadrant D |  |
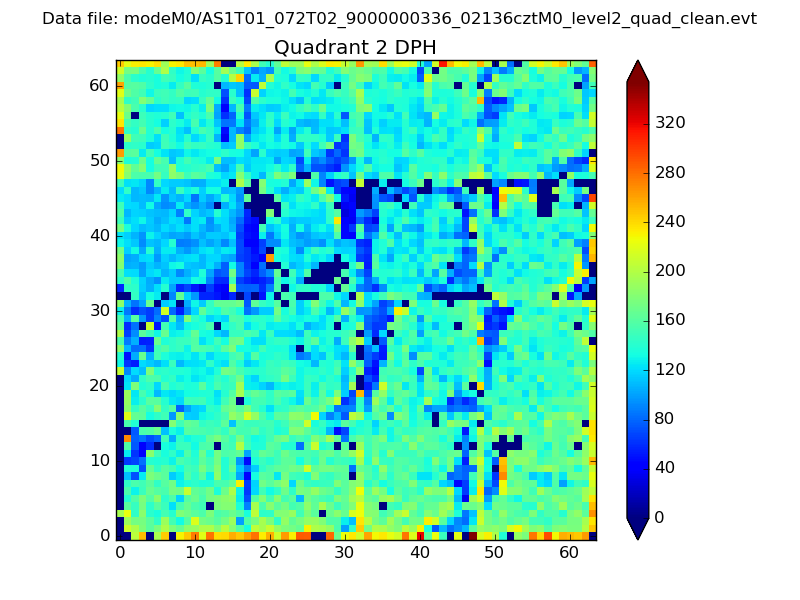 |
Quadrant C |
| Plot type | Count rate plots | Images |
|---|---|---|
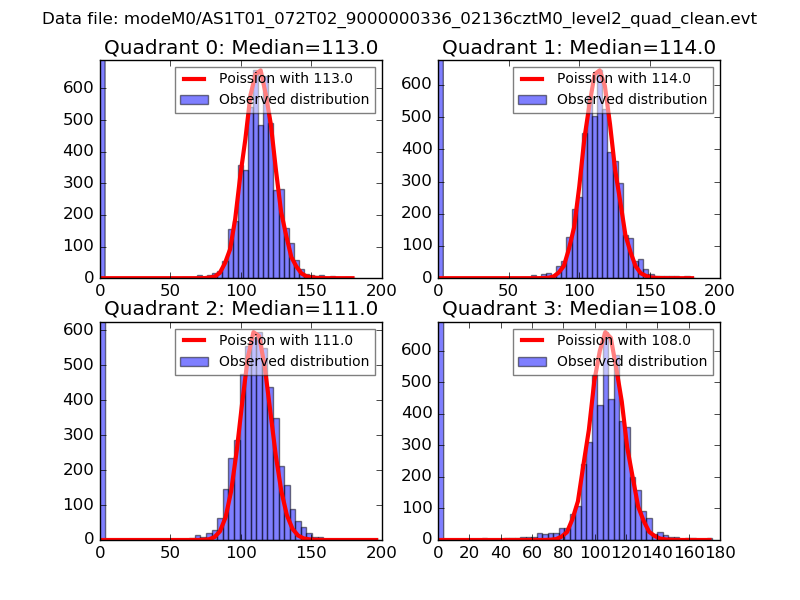
| Comparison with Poisson distribution Blue bars denote a histogram of data divided into 1 sec bins. Red curve is a Poisson curve with rate = median count rate of data. |
 |
 |
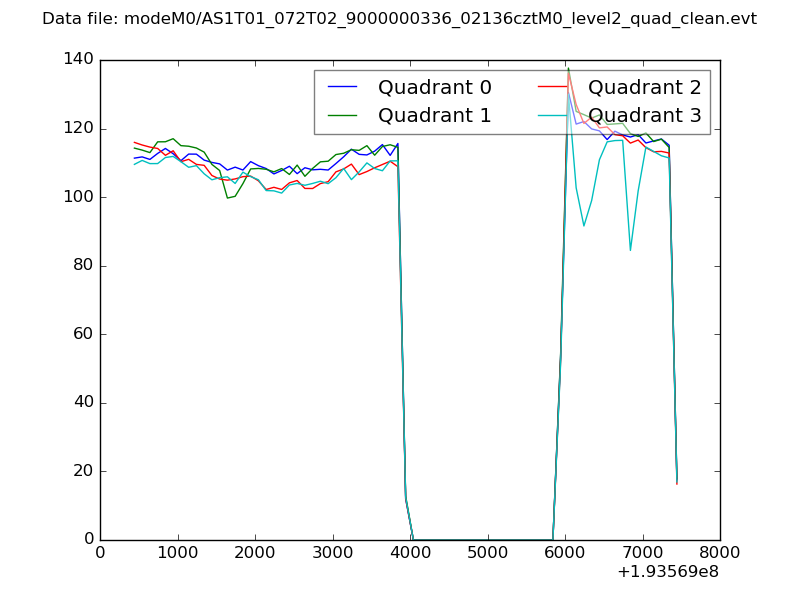
| Quadrant-wise count rates Data is divided into 100 sec bins |
 |
|
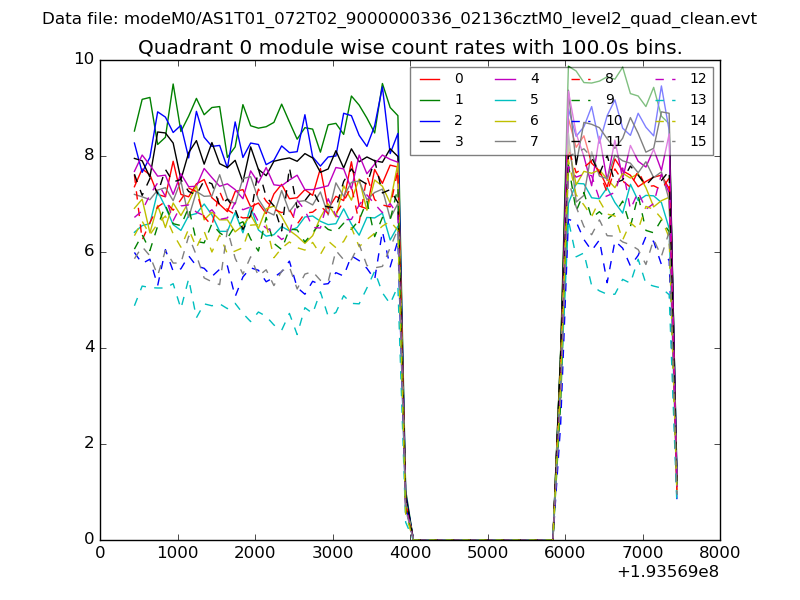
| Module-wise count rates for Quadrant A Data is divided into 100 sec bins |
 |
 |
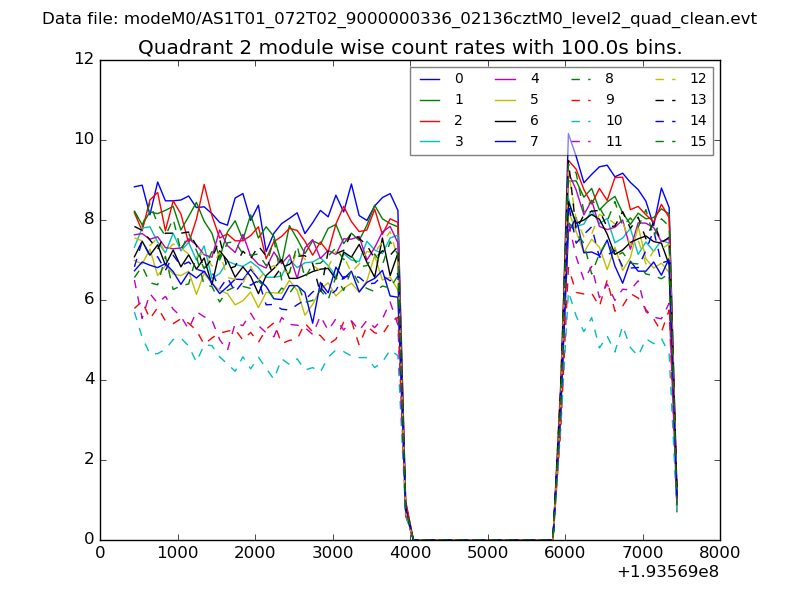
| Module-wise count rates for Quadrant B Data is divided into 100 sec bins |
 |
 |
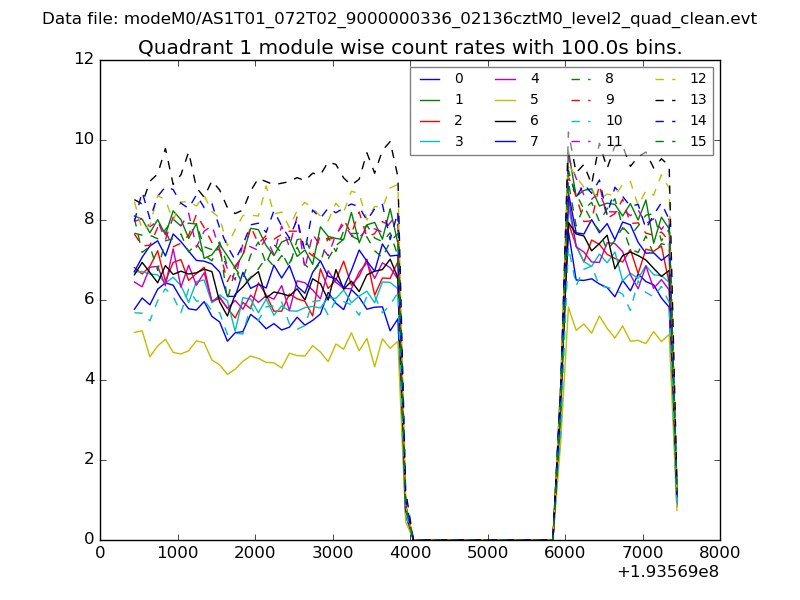
| Module-wise count rates for Quadrant C Data is divided into 100 sec bins |
 |
 |
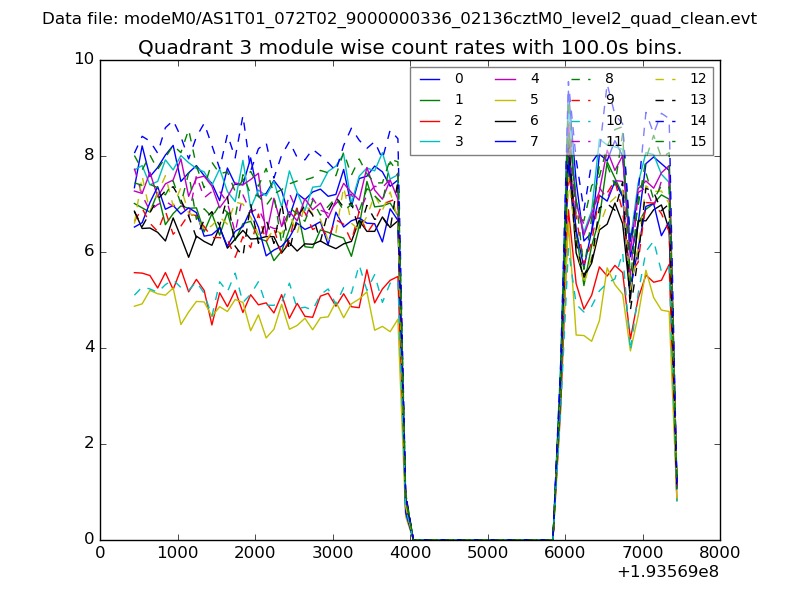
| Module-wise count rates for Quadrant D Data is divided into 100 sec bins |
 |
 |
| Parameter | Plot |
|---|---|
| CZT HV Monitor | 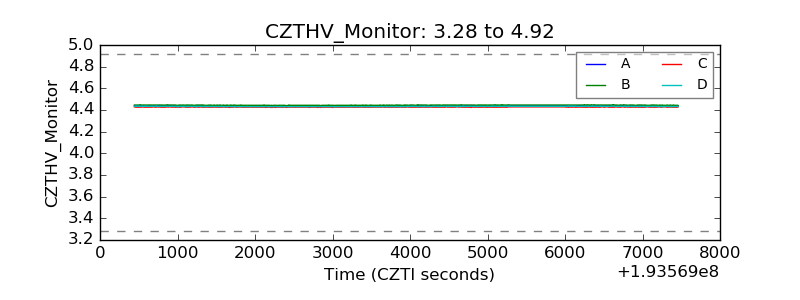 |
| D_VDD | 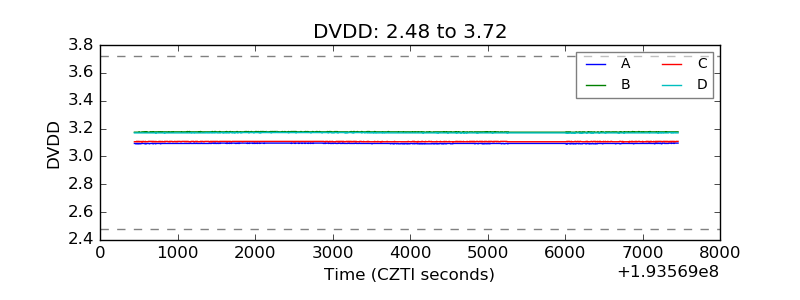 |
| Temperature 1 | 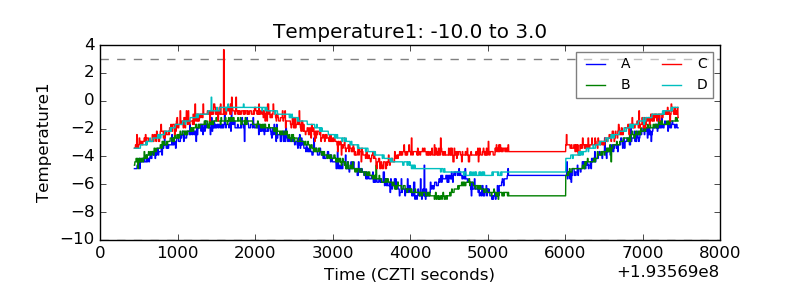 |
| Veto HV Monitor | 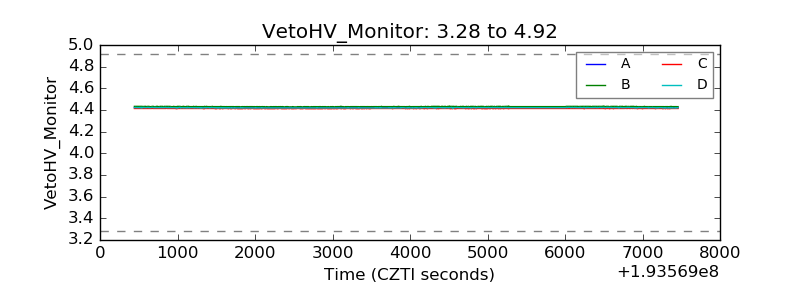 |
| Veto LLD | 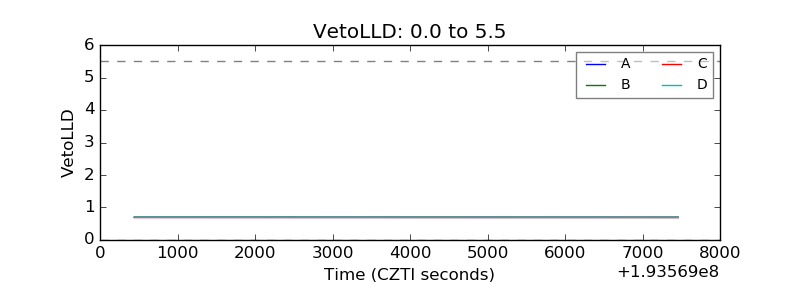 |
| Alpha Counter |  |
| _CPM_Rate | 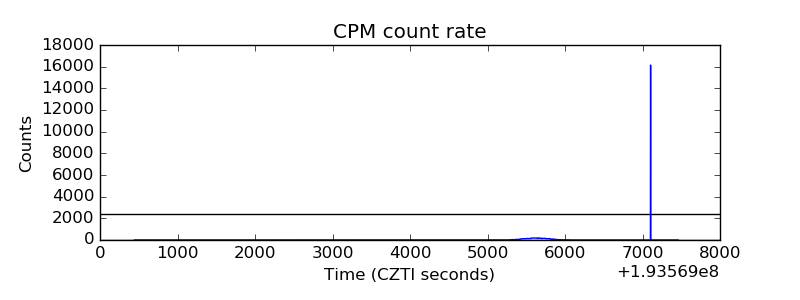 |
| CZT Counter | 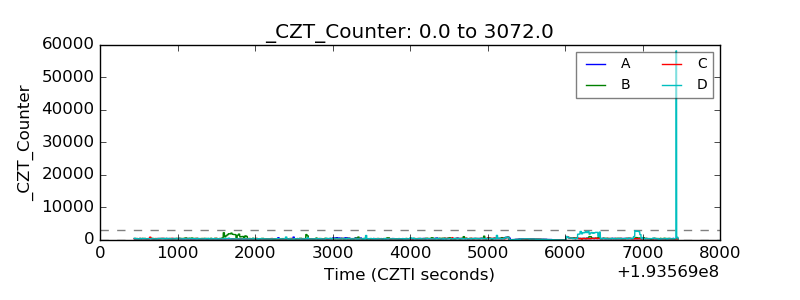 |
| +2.5 Volts monitor |  |
| +5 Volts monitor |  |
| _ROLL_ROT | 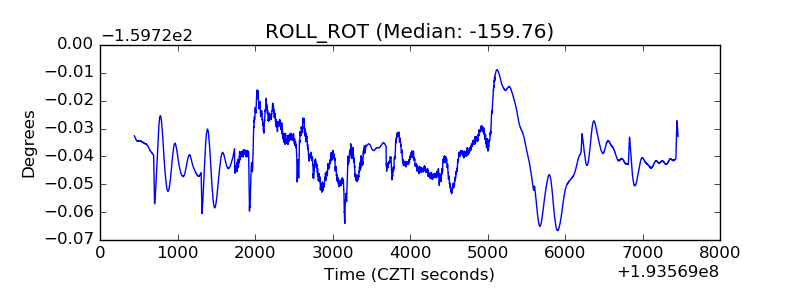 |
| _Roll_DEC | 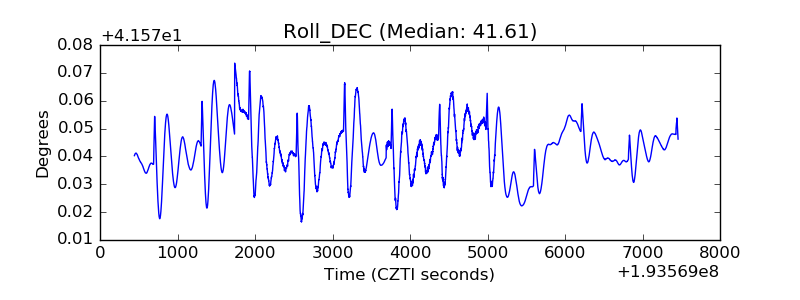 |
| _Roll_RA | 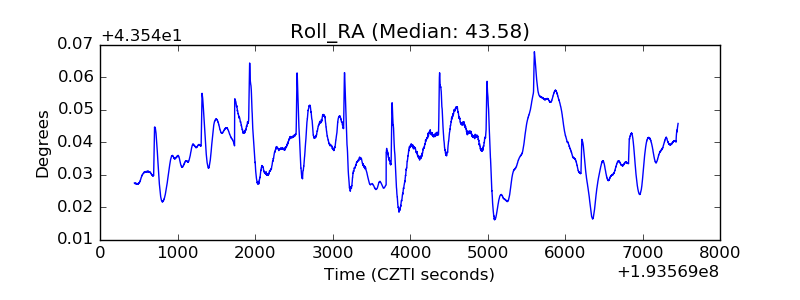 |
| Veto Counter | 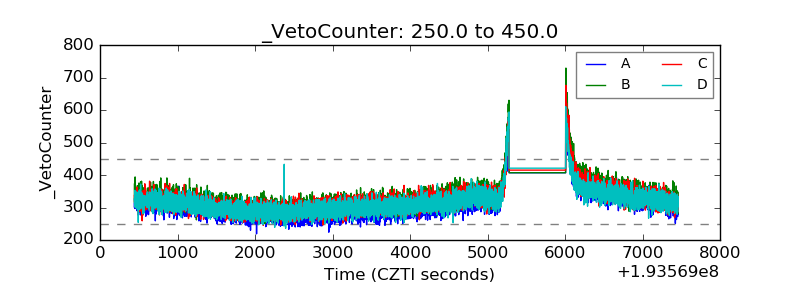 |