| Param | Original file | Final file |
|---|---|---|
| Filename | modeM0/AS1T01_072T02_9000000336_02139cztM0_level2.evt | modeM0/AS1T01_072T02_9000000336_02139cztM0_level2_quad_clean.evt |
| Size (bytes) | 400,953,600 | 79,038,720 |
| Size | 382.4 MB | 75.4 MB |
| Events in quadrant A | 2,523,108 | 501,091 |
| Events in quadrant B | 4,203,348 | 496,775 |
| Events in quadrant C | 2,527,466 | 485,693 |
| Events in quadrant D | 2,471,422 | 481,359 |
| Mode M0 | |||
|---|---|---|---|
| Quadrant | BADHDUFLAG | Total packets | Discarded packets |
| A | 0 | 12496 | 1 |
| B | 0 | 16786 | 1 |
| C | 0 | 12515 | 1 |
| D | 0 | 12591 | 1 |
| Mode SS | |||
|---|---|---|---|
| Quadrant | BADHDUFLAG | Total packets | Discarded packets |
| A | 0 | 122 | 0 |
| B | 0 | 122 | 0 |
| C | 0 | 122 | 0 |
| D | 0 | 122 | 0 |
| Mode M9 | |||
|---|---|---|---|
| Quadrant | BADHDUFLAG | Total packets | Discarded packets |
| A | 0 | 1 | 0 |
| B | 1 | 1 | 0 |
| C | 1 | -1 | -1 |
| D | 1 | -1 | -1 |
| Quadrant | Total seconds | Saturated seconds | Saturation percentage |
|---|---|---|---|
| A | 6139 | 49 | 0.798176% |
| B | 6139 | 49 | 0.798176% |
| C | 6139 | 45 | 0.733018% |
| D | 6139 | 48 | 0.781886% |
Noise dominated data is calculated using 1-second bins in cleaned event files. If a bin has >2000 counts, and if more than 50% of those come from <1% of pixels, then it is considered to be noise-dominated and hence unusable.
| Quadrant | # 1 sec bins | Bins with >0 counts | Bins with >2000 counts | High rate bins dominated by noise | Noise dominated (total time) | Noise dominated (detector-on time) | Marked lightcurve |
|---|---|---|---|---|---|---|---|
| A | 7179 | 6140 | 0 | 0 | 0.00% | 0.00% | 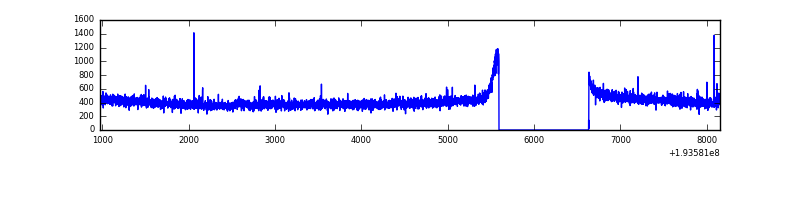 |
| B | 7179 | 6140 | 0 | 0 | 0.00% | 0.00% | 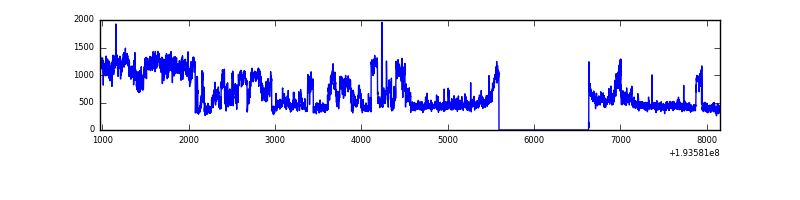 |
| C | 7179 | 6140 | 0 | 0 | 0.00% | 0.00% | 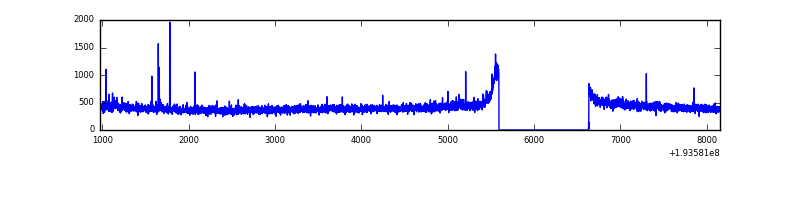 |
| D | 7179 | 6140 | 5 | 5 | 0.07% | 0.08% | 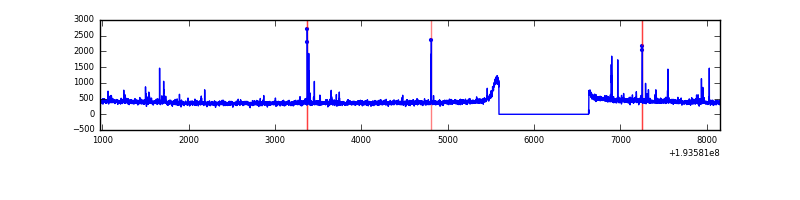 |
Top three noisy pixels from each quadrant. If the there are fewer than three noisy pixels in the level2.evt file, extra rows are filled as -1
| Pixel properties | Quadrant properties | ||||||
|---|---|---|---|---|---|---|---|
| Quadrant | DetID | PixID | Counts | Sigma | Mean | Median | Sigma |
| A | 15 | 171 | 11004 | 80.63 | 650 | 637 | 128.6 |
| A | 0 | 1 | 7844 | 56.05 | 650 | 637 | 128.6 |
| A | 14 | 238 | 7288 | 51.73 | 650 | 637 | 128.6 |
| B | 5 | 68 | 1587887 | 13169.08 | 664 | 651 | 120.5 |
| B | 0 | 234 | 41539 | 339.24 | 664 | 651 | 120.5 |
| B | 0 | 168 | 14620 | 115.9 | 664 | 651 | 120.5 |
| C | 9 | 85 | 22459 | 157.42 | 633 | 637 | 138.6 |
| C | 10 | 65 | 12219 | 83.55 | 633 | 637 | 138.6 |
| C | 10 | 82 | 6137 | 39.68 | 633 | 637 | 138.6 |
| D | 9 | 64 | 36555 | 252.03 | 631 | 617 | 142.6 |
| D | 13 | 53 | 26749 | 183.26 | 631 | 617 | 142.6 |
| D | 2 | 54 | 8283 | 53.76 | 631 | 617 | 142.6 |
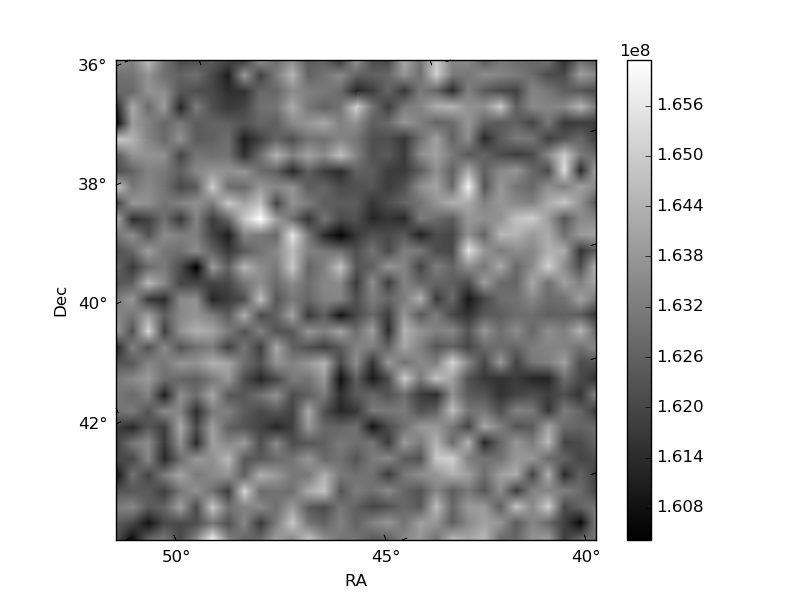
Histogram calculated using DETX and DETY for each event in the final _common_clean file
| Quadrant A | 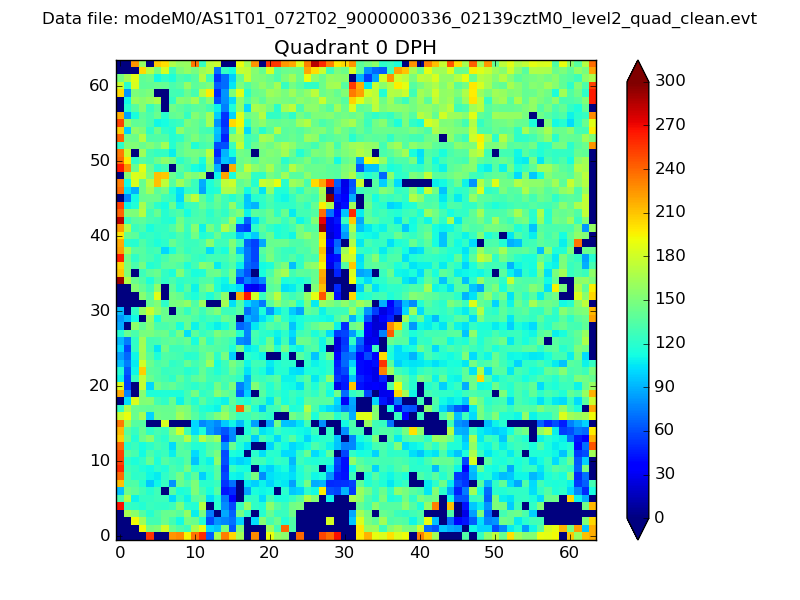 |
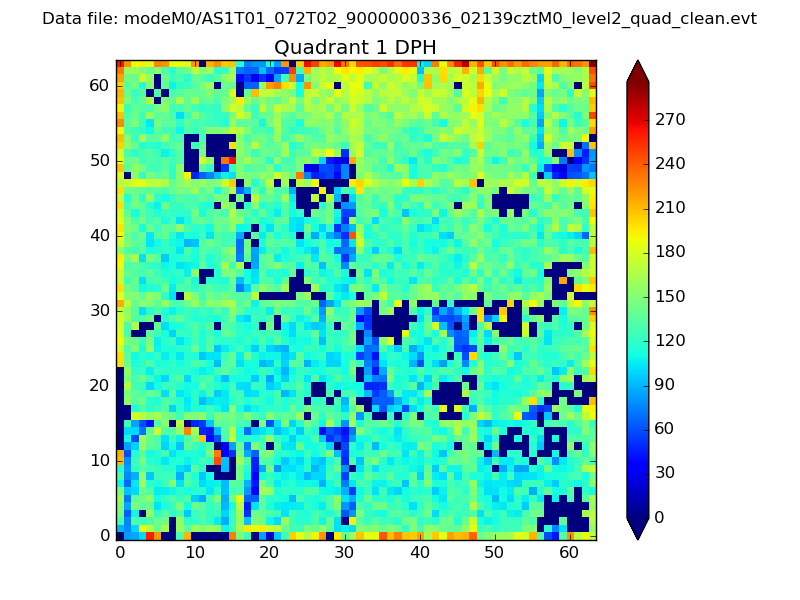 |
Quadrant B |
|---|---|---|---|
| Quadrant D | 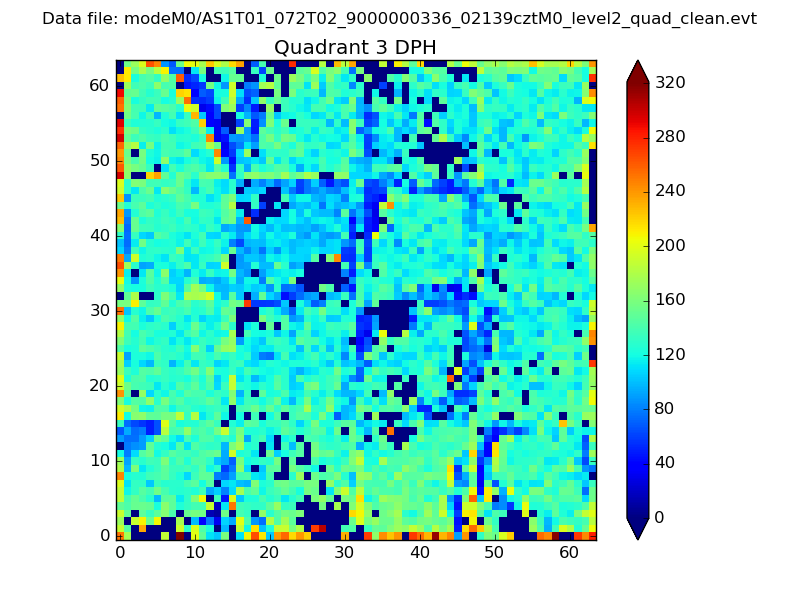 |
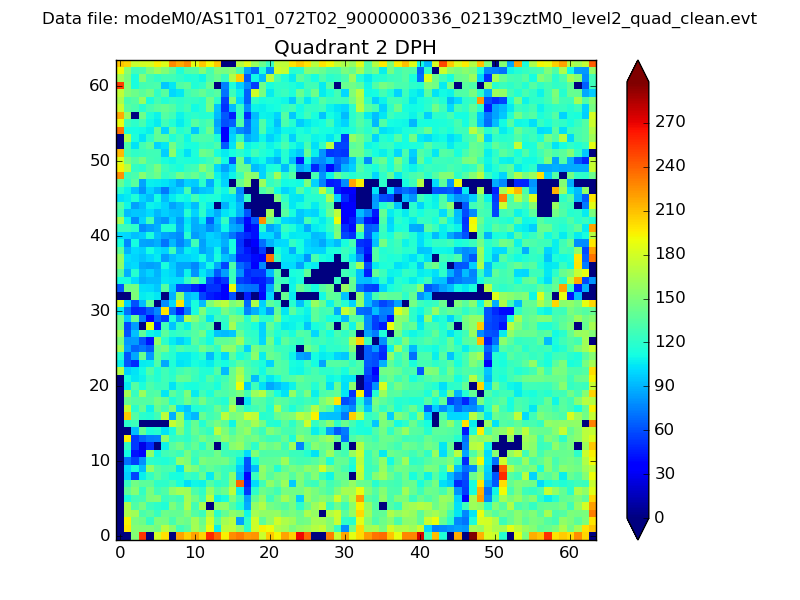 |
Quadrant C |
| Plot type | Count rate plots | Images |
|---|---|---|
| Comparison with Poisson distribution Blue bars denote a histogram of data divided into 1 sec bins. Red curve is a Poisson curve with rate = median count rate of data. |
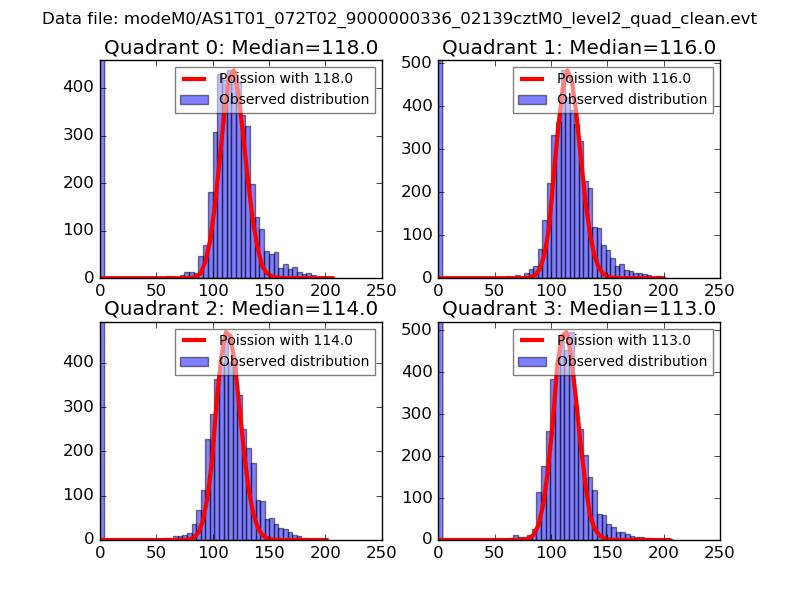 |
 |
| Quadrant-wise count rates Data is divided into 100 sec bins |
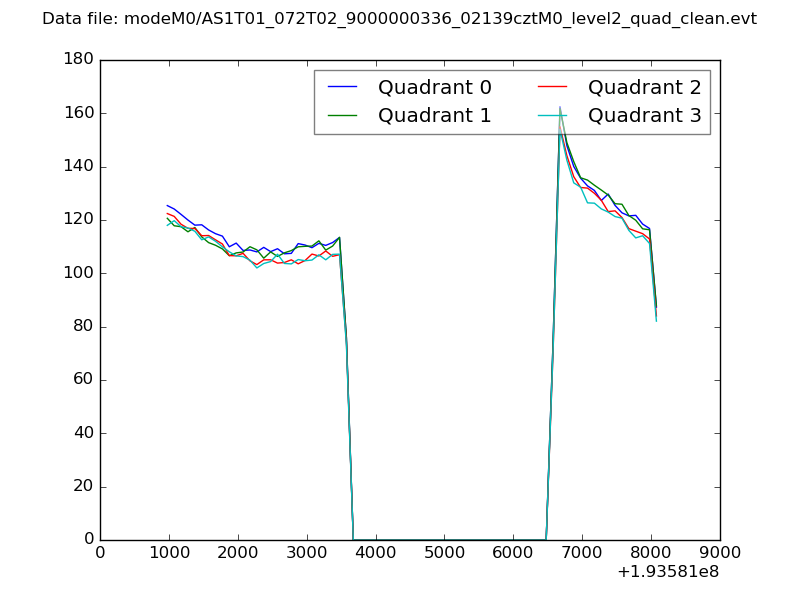 |
|
| Module-wise count rates for Quadrant A Data is divided into 100 sec bins |
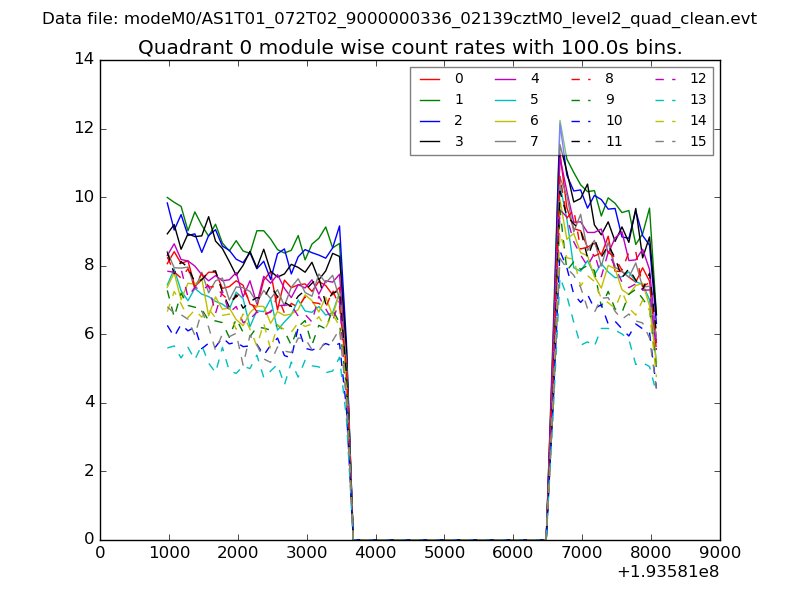 |
 |
| Module-wise count rates for Quadrant B Data is divided into 100 sec bins |
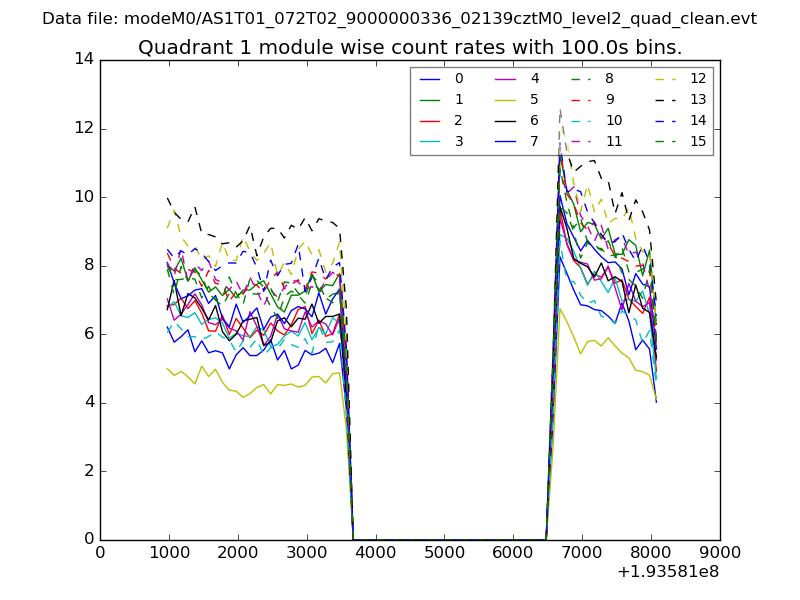 |
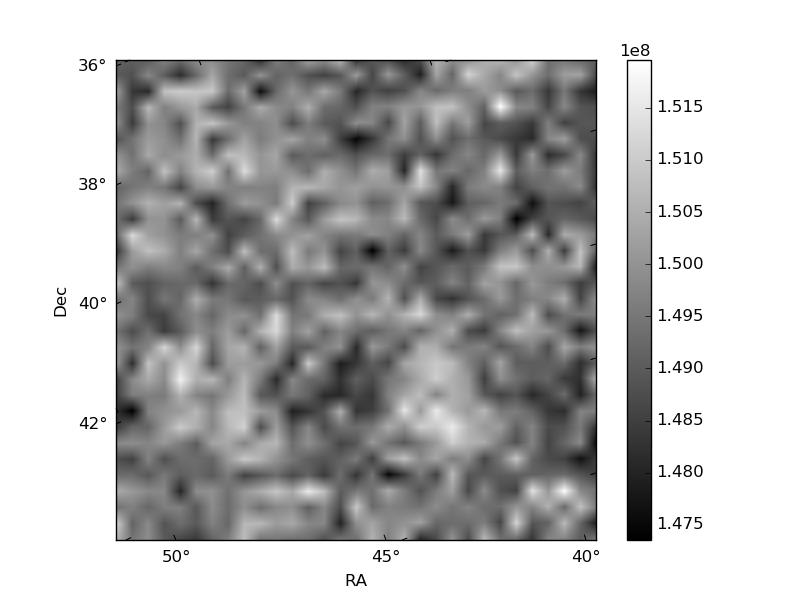 |
| Module-wise count rates for Quadrant C Data is divided into 100 sec bins |
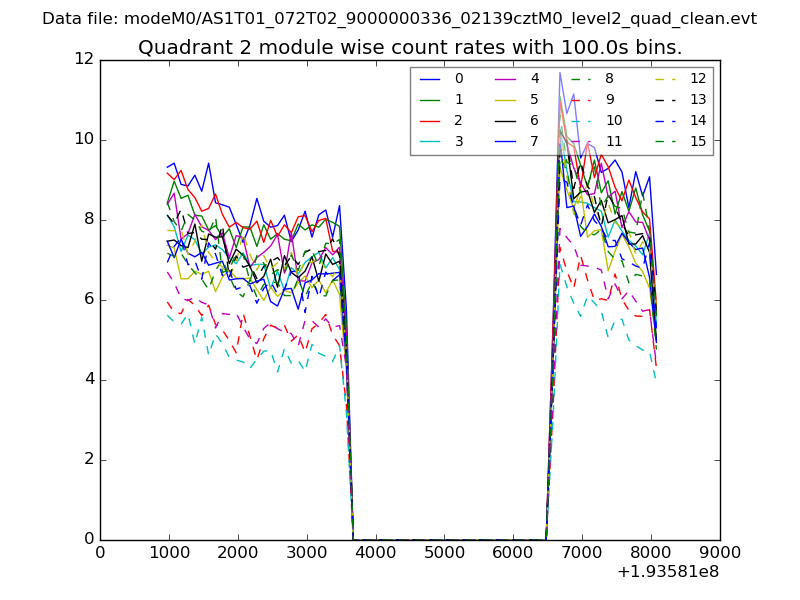 |
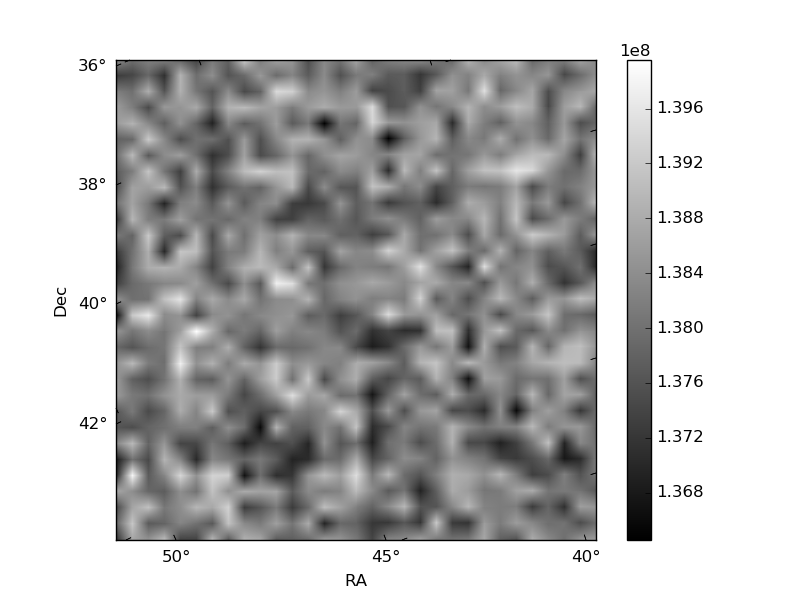 |
| Module-wise count rates for Quadrant D Data is divided into 100 sec bins |
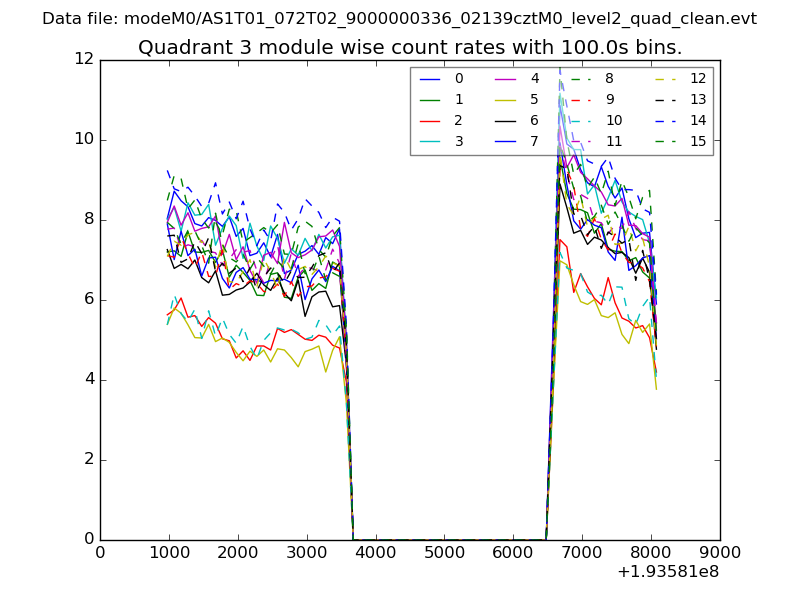 |
 |
| Parameter | Plot |
|---|---|
| CZT HV Monitor | 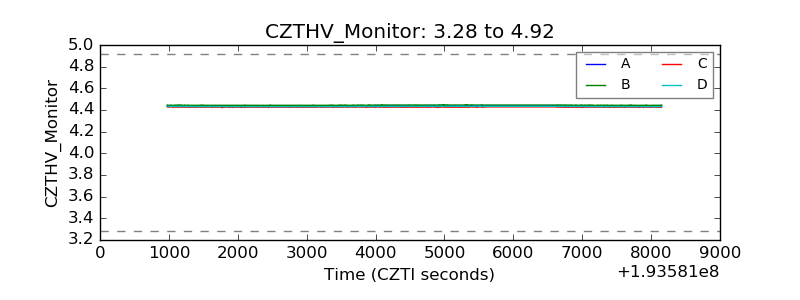 |
| D_VDD | 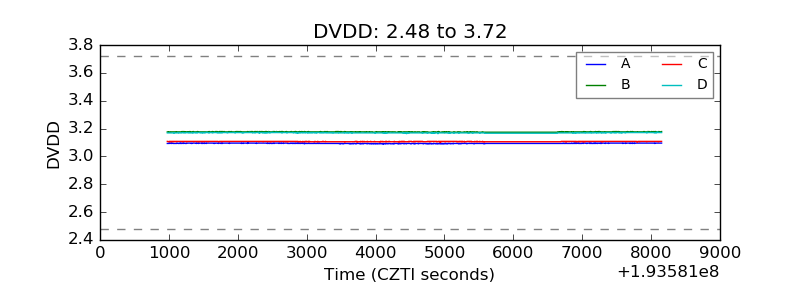 |
| Temperature 1 | 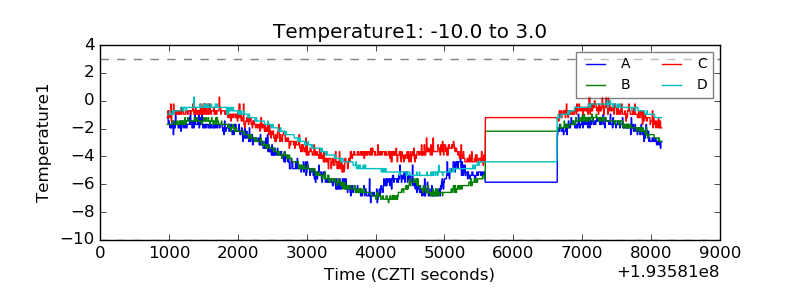 |
| Veto HV Monitor | 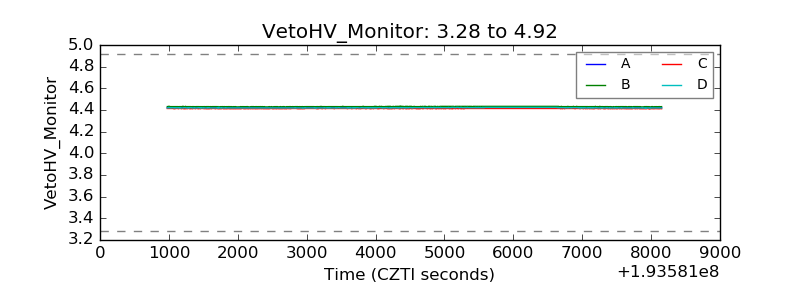 |
| Veto LLD | 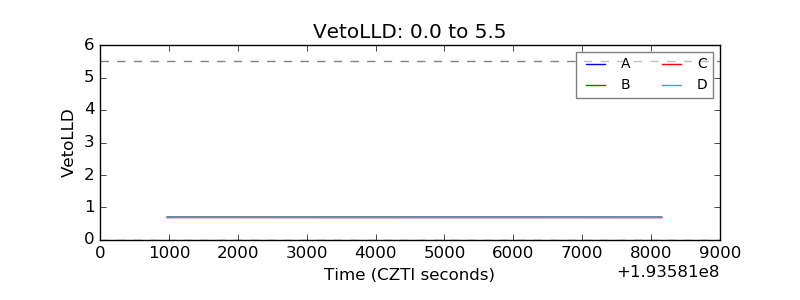 |
| Alpha Counter | 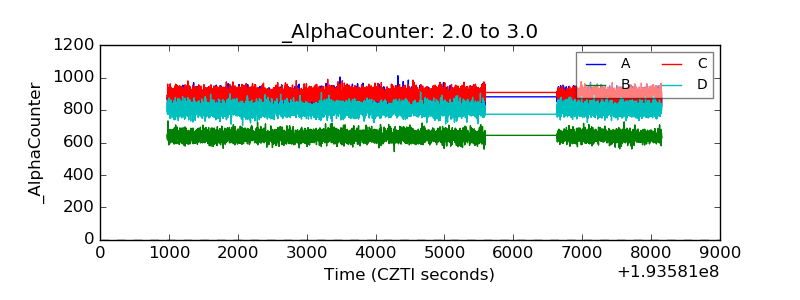 |
| _CPM_Rate | 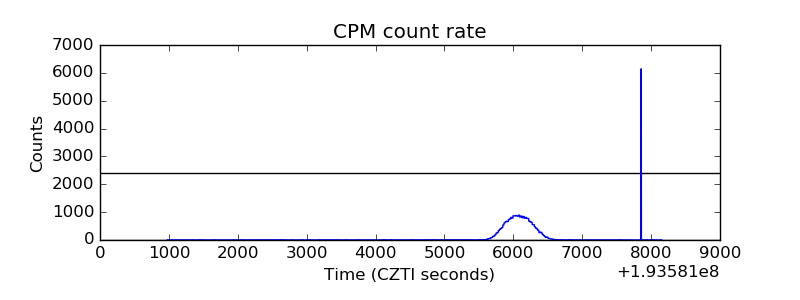 |
| CZT Counter |  |
| +2.5 Volts monitor |  |
| +5 Volts monitor |  |
| _ROLL_ROT | 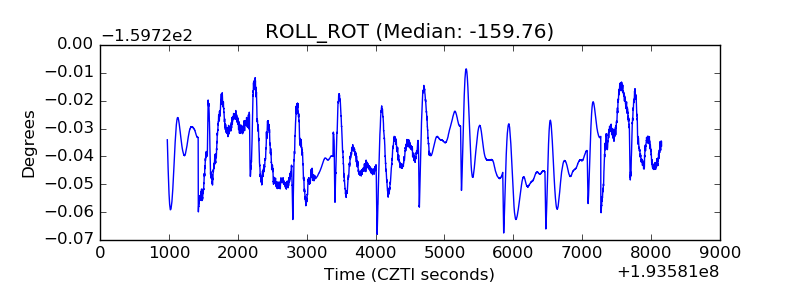 |
| _Roll_DEC | 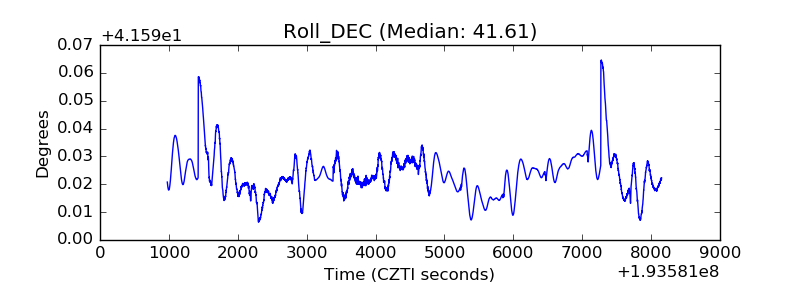 |
| _Roll_RA | 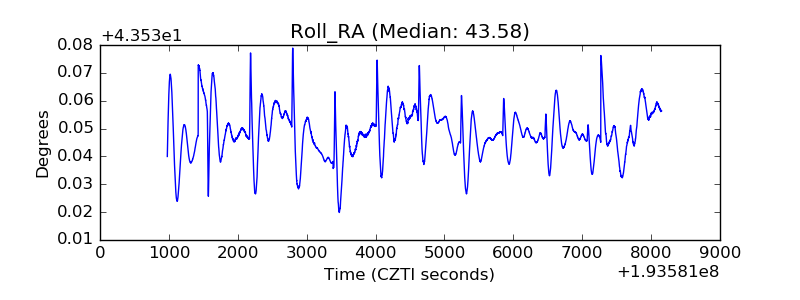 |
| Veto Counter |  |