| Param | Original file | Final file |
|---|---|---|
| Filename | modeM0/AS1T01_072T02_9000000336_02140cztM0_level2.evt | modeM0/AS1T01_072T02_9000000336_02140cztM0_level2_quad_clean.evt |
| Size (bytes) | 375,759,360 | 75,945,600 |
| Size | 358.4 MB | 72.4 MB |
| Events in quadrant A | 2,626,751 | 471,177 |
| Events in quadrant B | 3,105,653 | 476,296 |
| Events in quadrant C | 2,635,046 | 458,265 |
| Events in quadrant D | 2,582,106 | 453,225 |
| Mode M0 | |||
|---|---|---|---|
| Quadrant | BADHDUFLAG | Total packets | Discarded packets |
| A | 0 | 12815 | 1 |
| B | 0 | 13761 | 1 |
| C | 0 | 12832 | 1 |
| D | 0 | 12963 | 1 |
| Mode SS | |||
|---|---|---|---|
| Quadrant | BADHDUFLAG | Total packets | Discarded packets |
| A | 0 | 128 | 0 |
| B | 0 | 128 | 0 |
| C | 0 | 128 | 0 |
| D | 0 | 128 | 0 |
| Mode M9 | |||
|---|---|---|---|
| Quadrant | BADHDUFLAG | Total packets | Discarded packets |
| A | 0 | 1 | 0 |
| B | 1 | 1 | 0 |
| C | 1 | -1 | -1 |
| D | 1 | -1 | -1 |
| Quadrant | Total seconds | Saturated seconds | Saturation percentage |
|---|---|---|---|
| A | 6309 | 16 | 0.253606% |
| B | 6309 | 24 | 0.380409% |
| C | 6309 | 17 | 0.269456% |
| D | 6309 | 25 | 0.396259% |
Noise dominated data is calculated using 1-second bins in cleaned event files. If a bin has >2000 counts, and if more than 50% of those come from <1% of pixels, then it is considered to be noise-dominated and hence unusable.
| Quadrant | # 1 sec bins | Bins with >0 counts | Bins with >2000 counts | High rate bins dominated by noise | Noise dominated (total time) | Noise dominated (detector-on time) | Marked lightcurve |
|---|---|---|---|---|---|---|---|
| A | 7459 | 6310 | 2 | 2 | 0.03% | 0.03% | 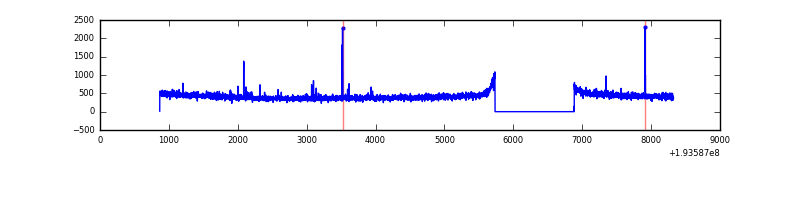 |
| B | 7459 | 6310 | 1 | 1 | 0.01% | 0.02% | 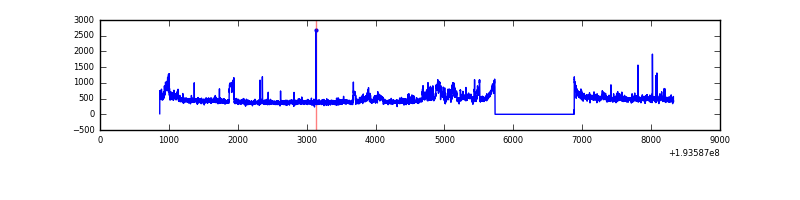 |
| C | 7459 | 6310 | 1 | 1 | 0.01% | 0.02% | 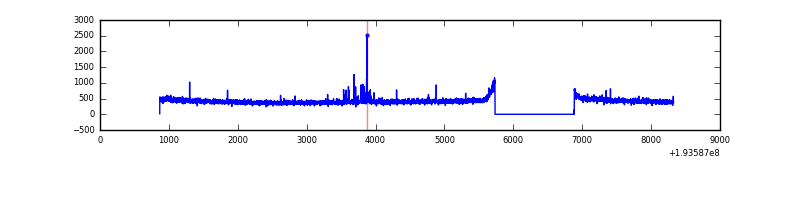 |
| D | 7459 | 6310 | 11 | 11 | 0.15% | 0.17% | 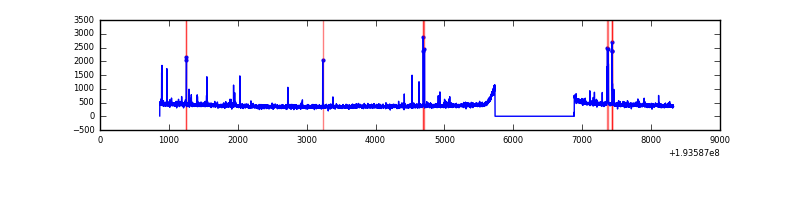 |
Top three noisy pixels from each quadrant. If the there are fewer than three noisy pixels in the level2.evt file, extra rows are filled as -1
| Pixel properties | Quadrant properties | ||||||
|---|---|---|---|---|---|---|---|
| Quadrant | DetID | PixID | Counts | Sigma | Mean | Median | Sigma |
| A | 0 | 1 | 18919 | 138.61 | 673 | 661 | 131.7 |
| A | 14 | 238 | 10990 | 78.42 | 673 | 661 | 131.7 |
| A | 15 | 171 | 9829 | 69.6 | 673 | 661 | 131.7 |
| B | 5 | 68 | 349737 | 2810.45 | 695 | 683 | 124.2 |
| B | 0 | 234 | 45728 | 362.68 | 695 | 683 | 124.2 |
| B | 0 | 198 | 31426 | 247.53 | 695 | 683 | 124.2 |
| C | 14 | 223 | 28433 | 190.99 | 663 | 666 | 145.4 |
| C | 10 | 82 | 4427 | 25.87 | 663 | 666 | 145.4 |
| C | 9 | 85 | 3723 | 21.02 | 663 | 666 | 145.4 |
| D | 9 | 64 | 33954 | 228.32 | 656 | 642 | 145.9 |
| D | 10 | 199 | 32496 | 218.32 | 656 | 642 | 145.9 |
| D | 13 | 53 | 27284 | 182.6 | 656 | 642 | 145.9 |
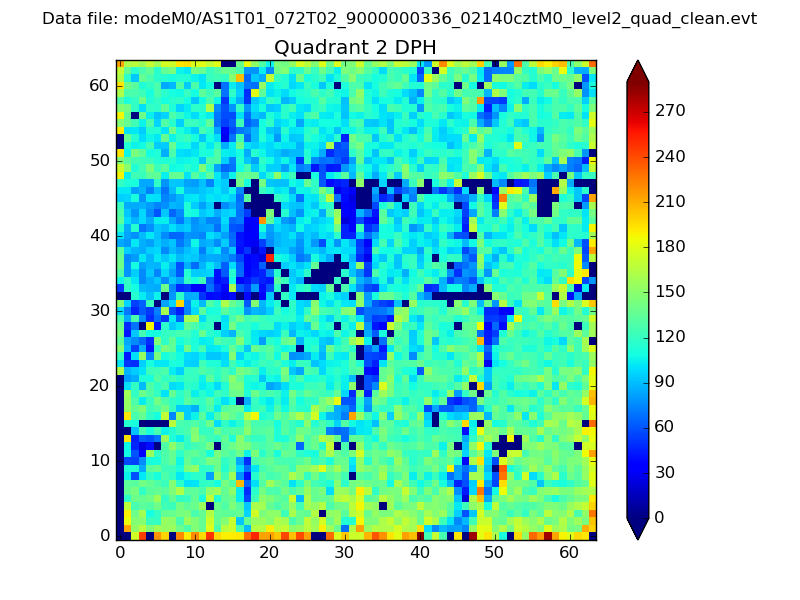
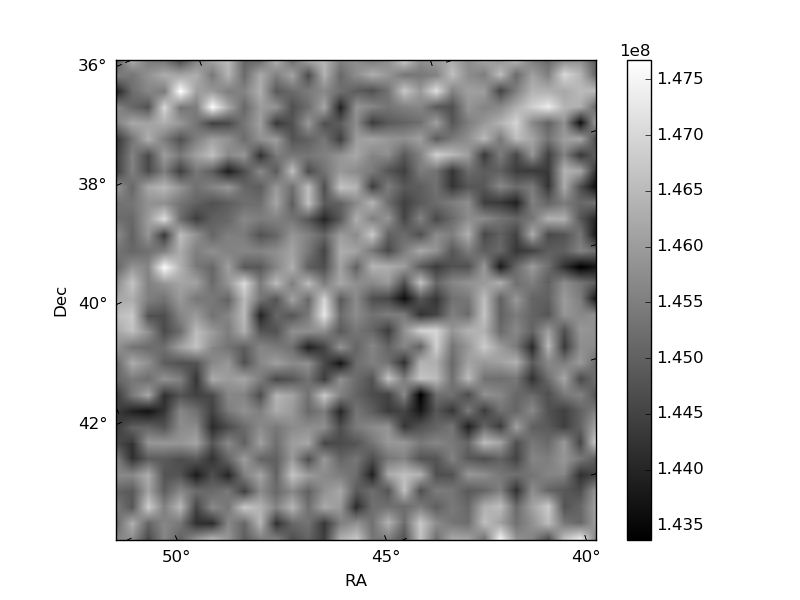
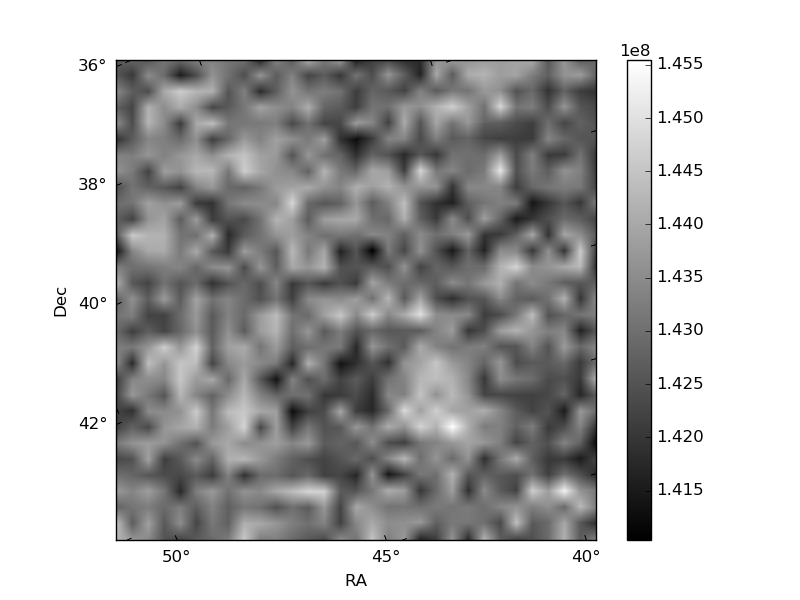
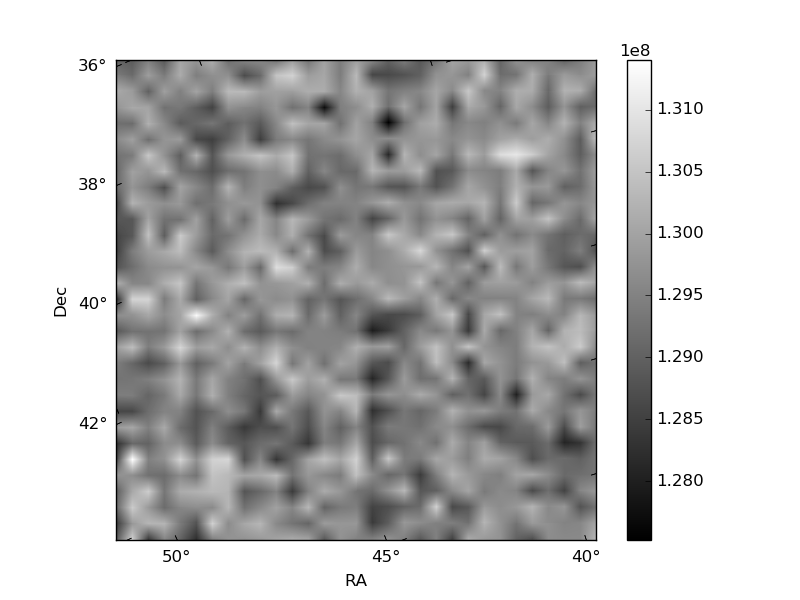
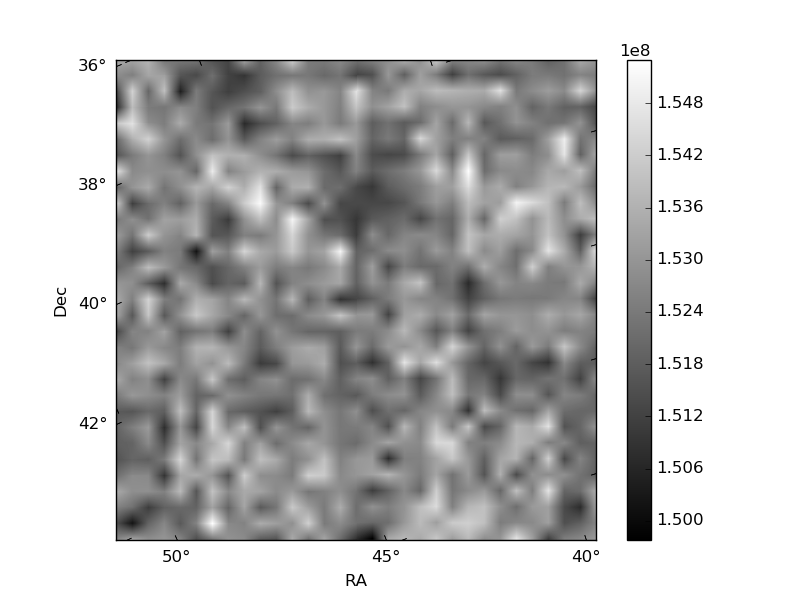
Histogram calculated using DETX and DETY for each event in the final _common_clean file
| Quadrant A | 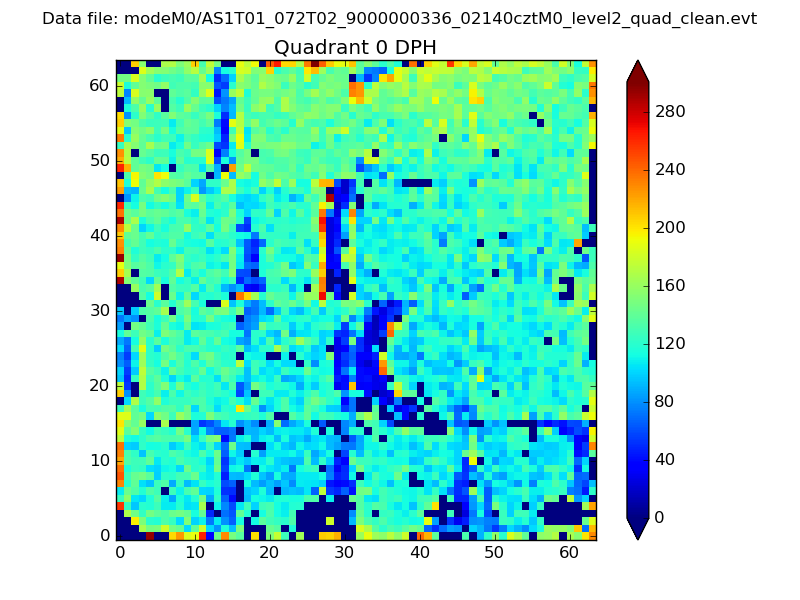 |
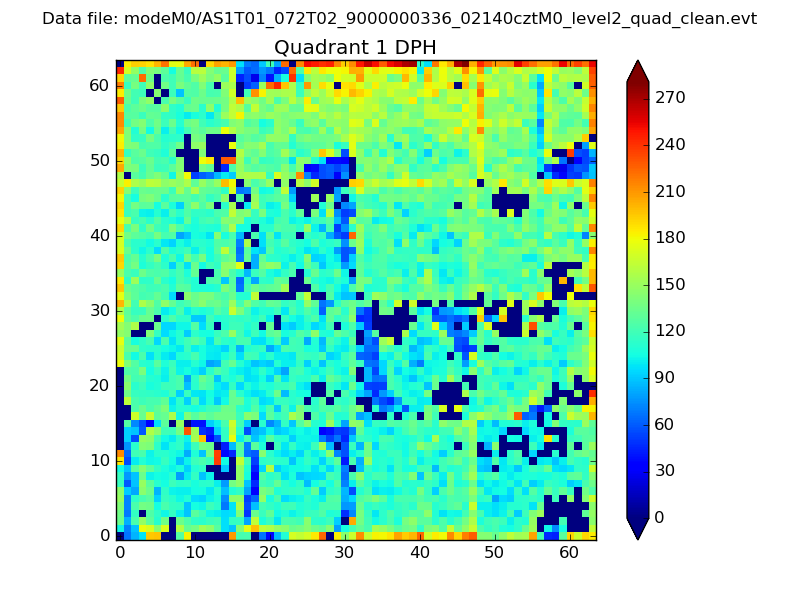 |
Quadrant B |
|---|---|---|---|
| Quadrant D | 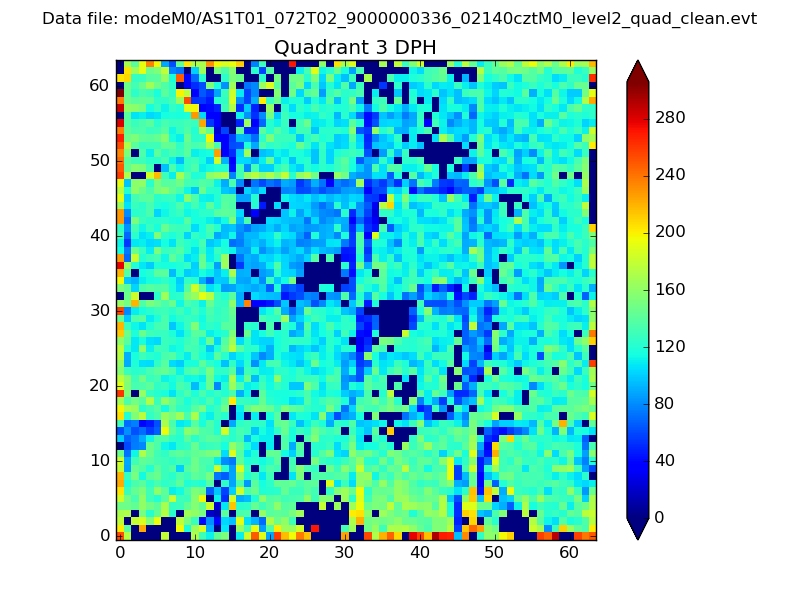 |
 |
Quadrant C |
| Plot type | Count rate plots | Images |
|---|---|---|
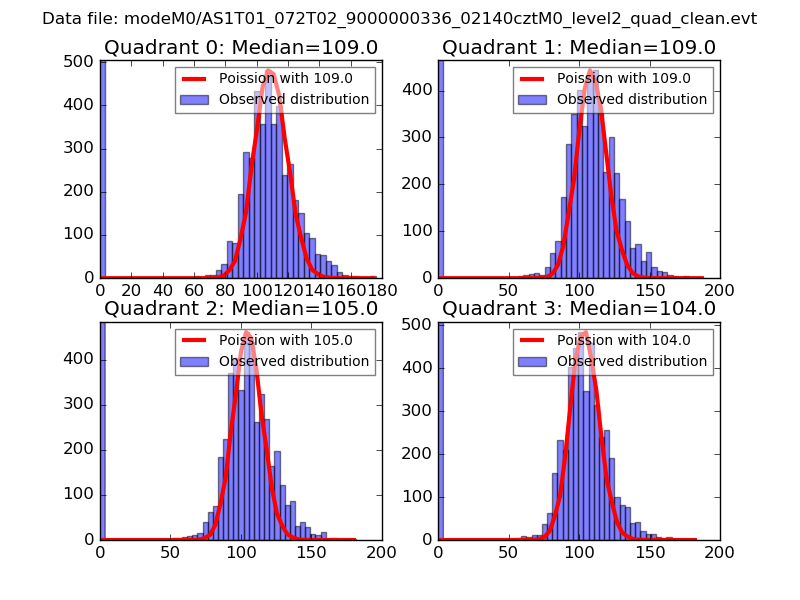
| Comparison with Poisson distribution Blue bars denote a histogram of data divided into 1 sec bins. Red curve is a Poisson curve with rate = median count rate of data. |
 |
 |
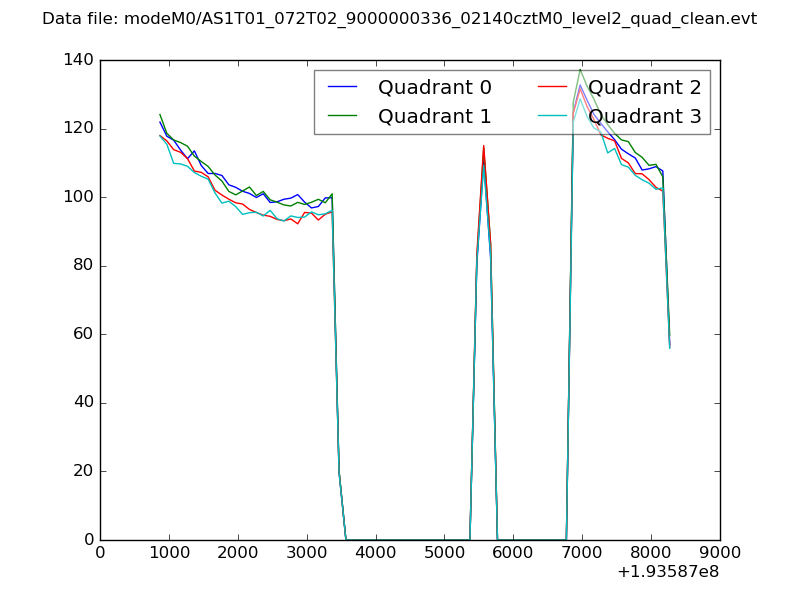
| Quadrant-wise count rates Data is divided into 100 sec bins |
 |
|
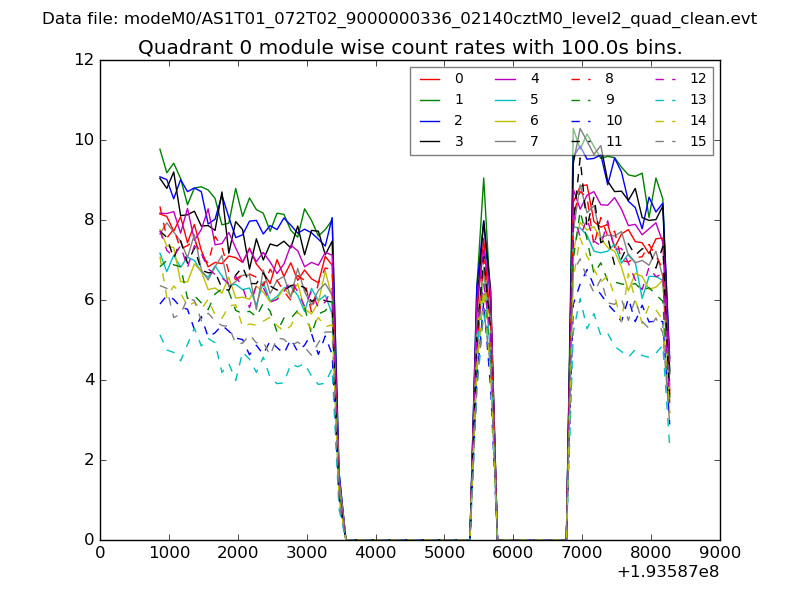
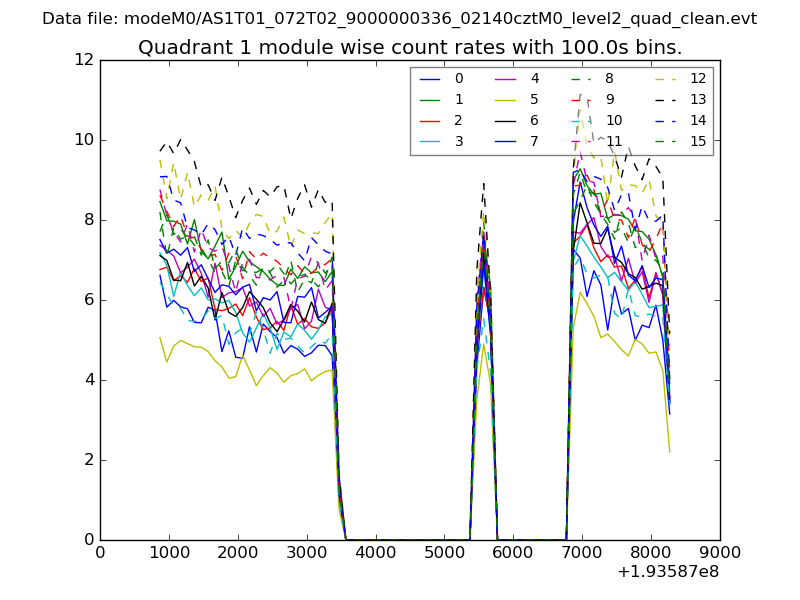
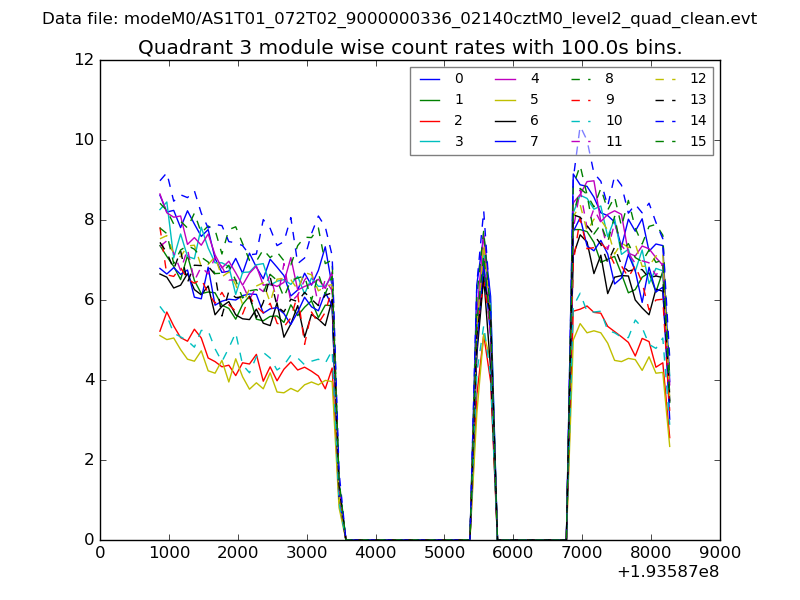
| Module-wise count rates for Quadrant A Data is divided into 100 sec bins |
 |
 |
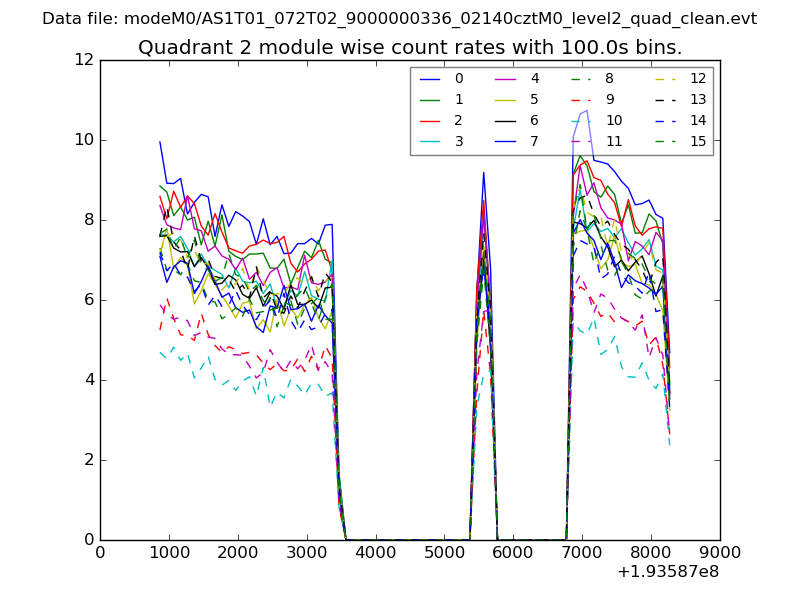
| Module-wise count rates for Quadrant B Data is divided into 100 sec bins |
 |
 |
| Module-wise count rates for Quadrant C Data is divided into 100 sec bins |
 |
 |
| Module-wise count rates for Quadrant D Data is divided into 100 sec bins |
 |
 |
| Parameter | Plot |
|---|---|
| CZT HV Monitor | 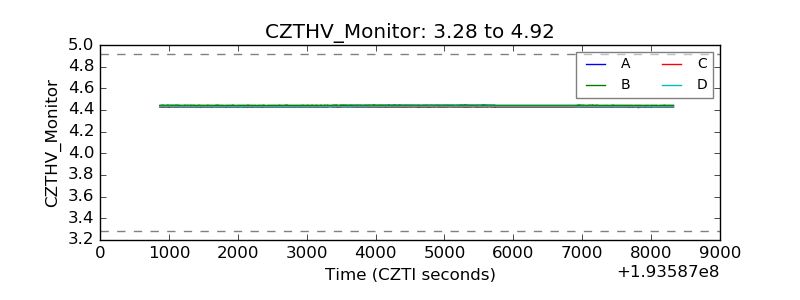 |
| D_VDD | 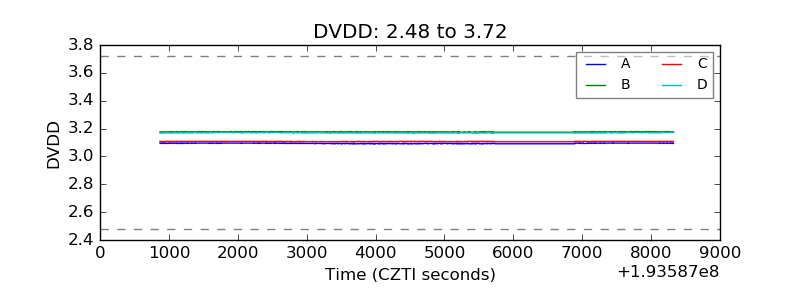 |
| Temperature 1 | 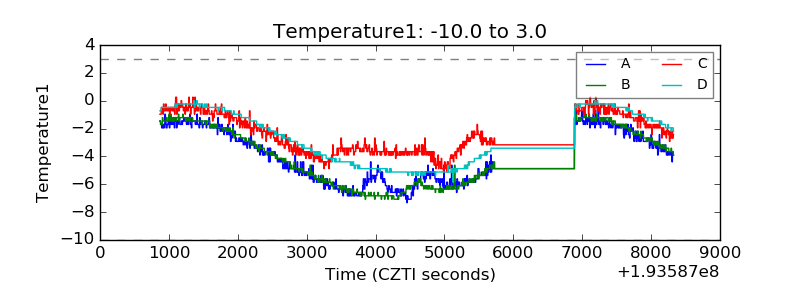 |
| Veto HV Monitor | 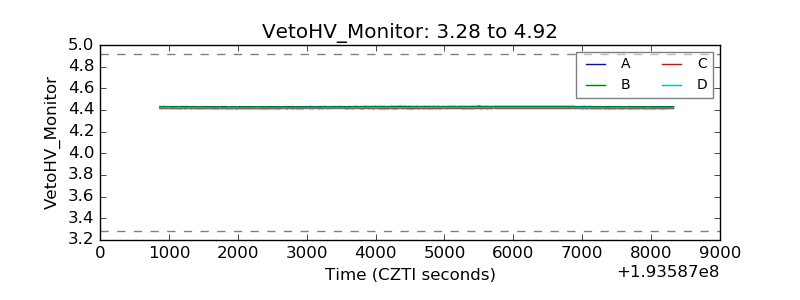 |
| Veto LLD | 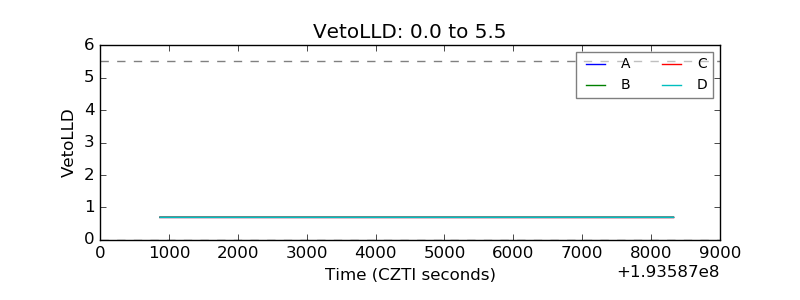 |
| Alpha Counter | 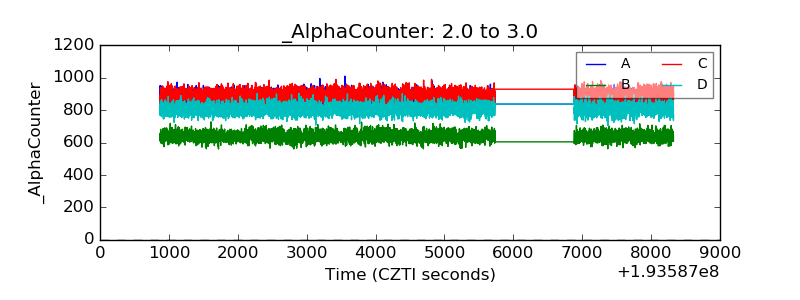 |
| _CPM_Rate | 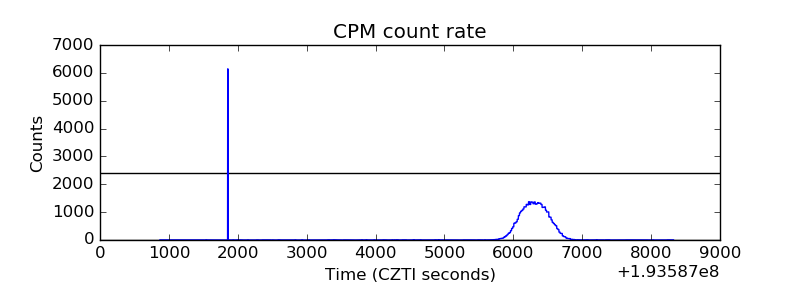 |
| CZT Counter | 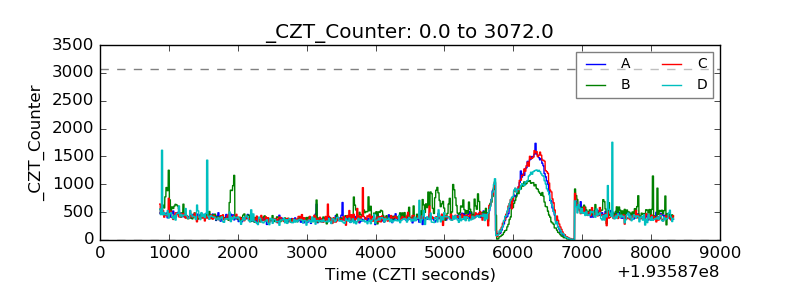 |
| +2.5 Volts monitor |  |
| +5 Volts monitor | 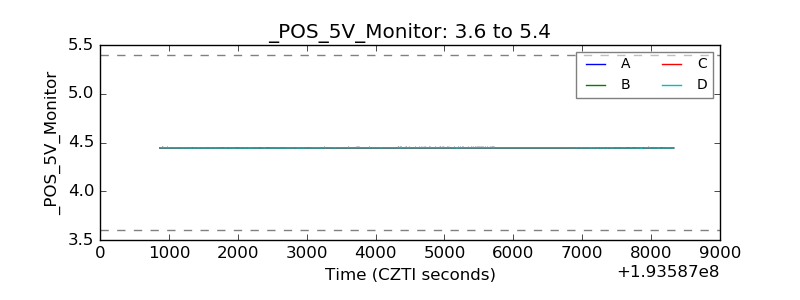 |
| _ROLL_ROT | 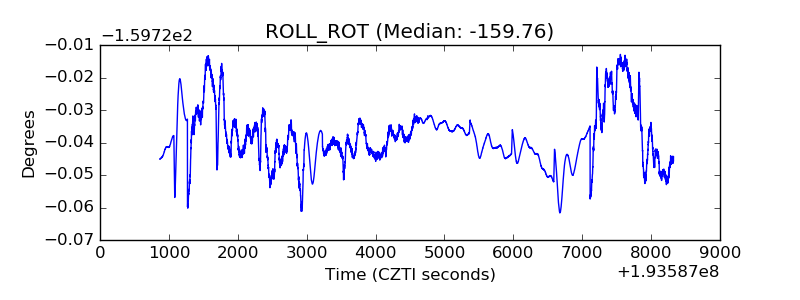 |
| _Roll_DEC | 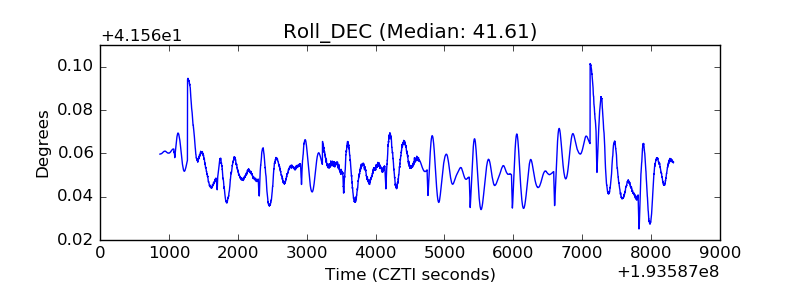 |
| _Roll_RA | 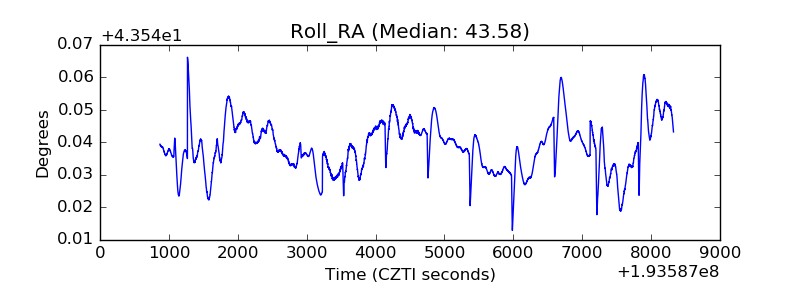 |
| Veto Counter | 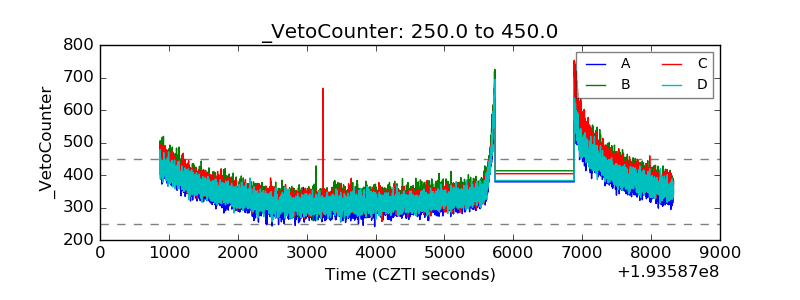 |