| Param | Original file | Final file |
|---|---|---|
| Filename | modeM0/AS1T01_072T02_9000000336_02141cztM0_level2.evt | modeM0/AS1T01_072T02_9000000336_02141cztM0_level2_quad_clean.evt |
| Size (bytes) | 373,078,080 | 85,988,160 |
| Size | 355.8 MB | 82.0 MB |
| Events in quadrant A | 2,623,808 | 545,741 |
| Events in quadrant B | 2,969,743 | 558,131 |
| Events in quadrant C | 2,652,348 | 539,377 |
| Events in quadrant D | 2,628,954 | 526,497 |
| Mode M0 | |||
|---|---|---|---|
| Quadrant | BADHDUFLAG | Total packets | Discarded packets |
| A | 0 | 12611 | 2 |
| B | 0 | 12995 | 2 |
| C | 0 | 12645 | 6 |
| D | 0 | 12872 | 2 |
| Mode SS | |||
|---|---|---|---|
| Quadrant | BADHDUFLAG | Total packets | Discarded packets |
| A | 0 | 124 | 0 |
| B | 0 | 124 | 0 |
| C | 0 | 124 | 0 |
| D | 0 | 124 | 0 |
| Mode M9 | |||
|---|---|---|---|
| Quadrant | BADHDUFLAG | Total packets | Discarded packets |
| A | 0 | 1 | 0 |
| B | 1 | 1 | 0 |
| C | 1 | -1 | -1 |
| D | 1 | -1 | -1 |
| Quadrant | Total seconds | Saturated seconds | Saturation percentage |
|---|---|---|---|
| A | 6222 | 6 | 0.096432% |
| B | 6222 | 3 | 0.048216% |
| C | 6220 | 3 | 0.048232% |
| D | 6223 | 19 | 0.305319% |
Noise dominated data is calculated using 1-second bins in cleaned event files. If a bin has >2000 counts, and if more than 50% of those come from <1% of pixels, then it is considered to be noise-dominated and hence unusable.
| Quadrant | # 1 sec bins | Bins with >0 counts | Bins with >2000 counts | High rate bins dominated by noise | Noise dominated (total time) | Noise dominated (detector-on time) | Marked lightcurve |
|---|---|---|---|---|---|---|---|
| A | 7477 | 6223 | 1 | 1 | 0.01% | 0.02% | 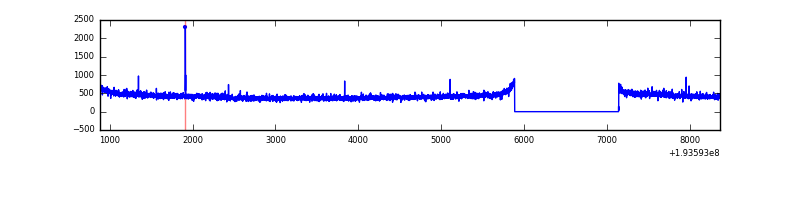 |
| B | 7477 | 6223 | 2 | 2 | 0.03% | 0.03% | 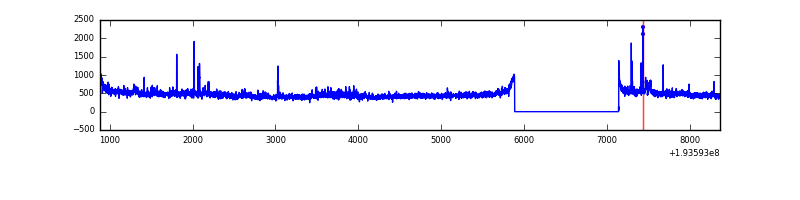 |
| C | 7477 | 6222 | 0 | 0 | 0.00% | 0.00% | 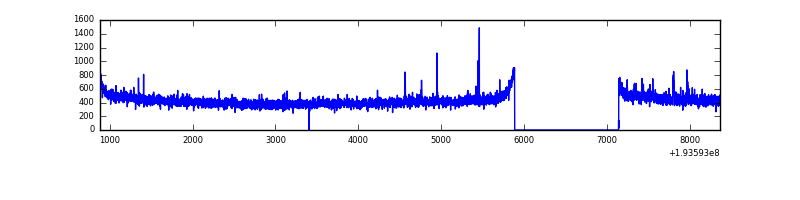 |
| D | 7478 | 6224 | 17 | 17 | 0.23% | 0.27% | 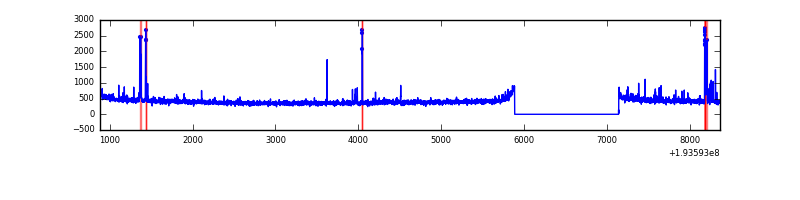 |
Top three noisy pixels from each quadrant. If the there are fewer than three noisy pixels in the level2.evt file, extra rows are filled as -1
| Pixel properties | Quadrant properties | ||||||
|---|---|---|---|---|---|---|---|
| Quadrant | DetID | PixID | Counts | Sigma | Mean | Median | Sigma |
| A | 15 | 191 | 10776 | 76.91 | 674 | 662 | 131.5 |
| A | 0 | 1 | 8990 | 63.33 | 674 | 662 | 131.5 |
| A | 14 | 5 | 8889 | 62.56 | 674 | 662 | 131.5 |
| B | 5 | 68 | 191170 | 1530.12 | 698 | 685 | 124.5 |
| B | 0 | 234 | 33784 | 265.88 | 698 | 685 | 124.5 |
| B | 0 | 168 | 24861 | 194.2 | 698 | 685 | 124.5 |
| C | 9 | 85 | 26438 | 178.11 | 667 | 671 | 144.7 |
| C | 10 | 82 | 6244 | 38.52 | 667 | 671 | 144.7 |
| C | 10 | 65 | 4690 | 27.78 | 667 | 671 | 144.7 |
| D | 10 | 199 | 106634 | 722.38 | 659 | 647 | 146.7 |
| D | 2 | 31 | 12876 | 83.35 | 659 | 647 | 146.7 |
| D | 2 | 14 | 10142 | 64.72 | 659 | 647 | 146.7 |
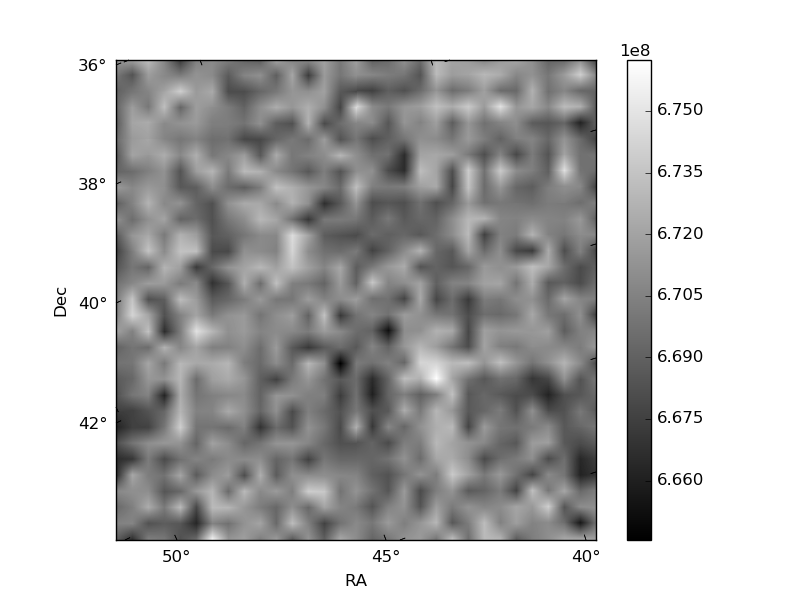
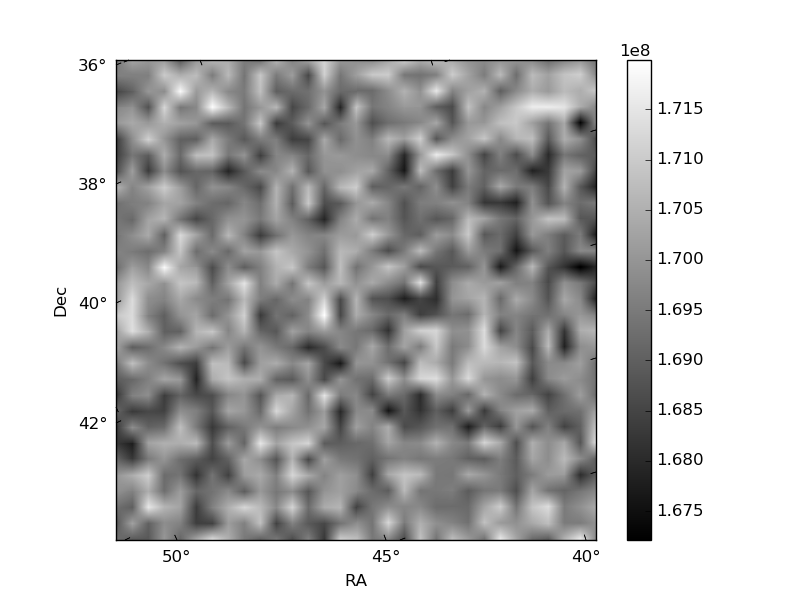
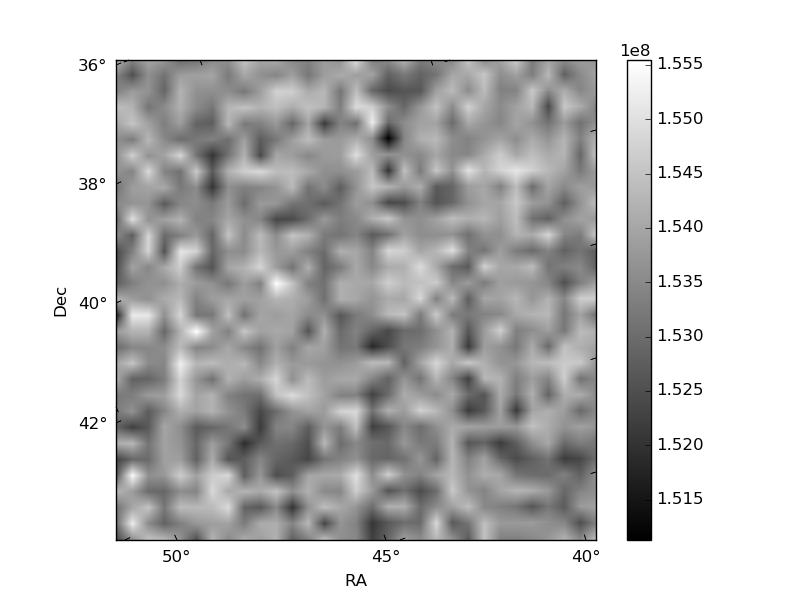
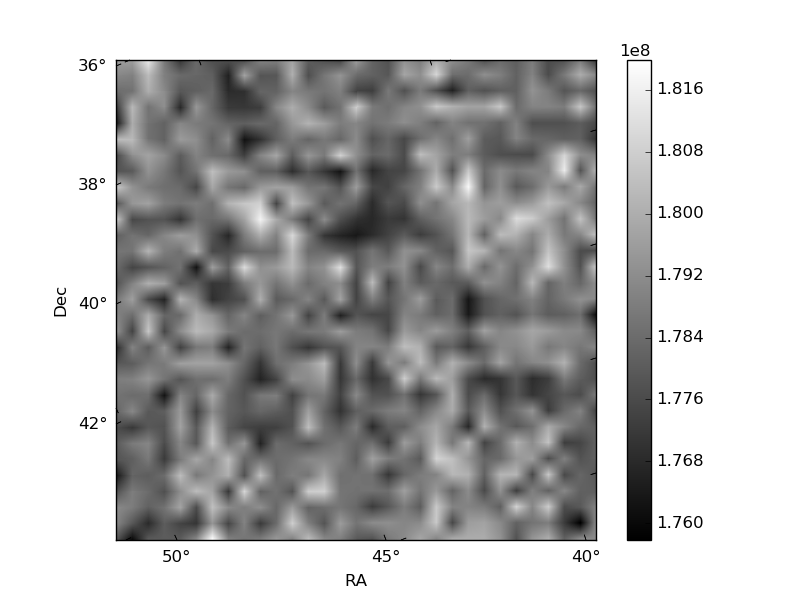
Histogram calculated using DETX and DETY for each event in the final _common_clean file
| Quadrant A | 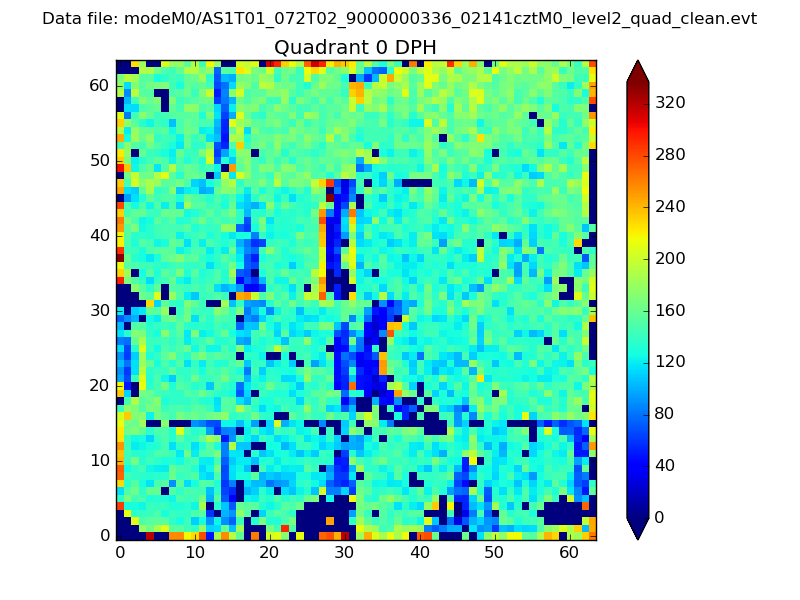 |
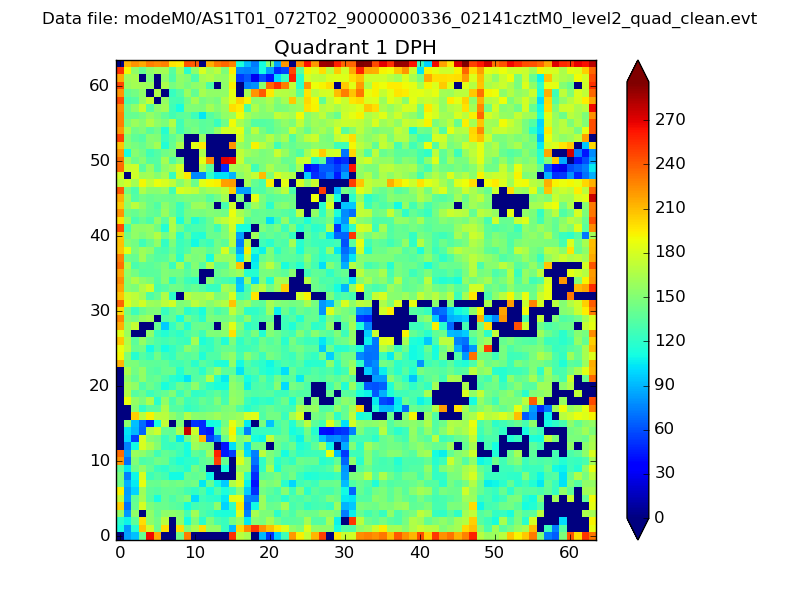 |
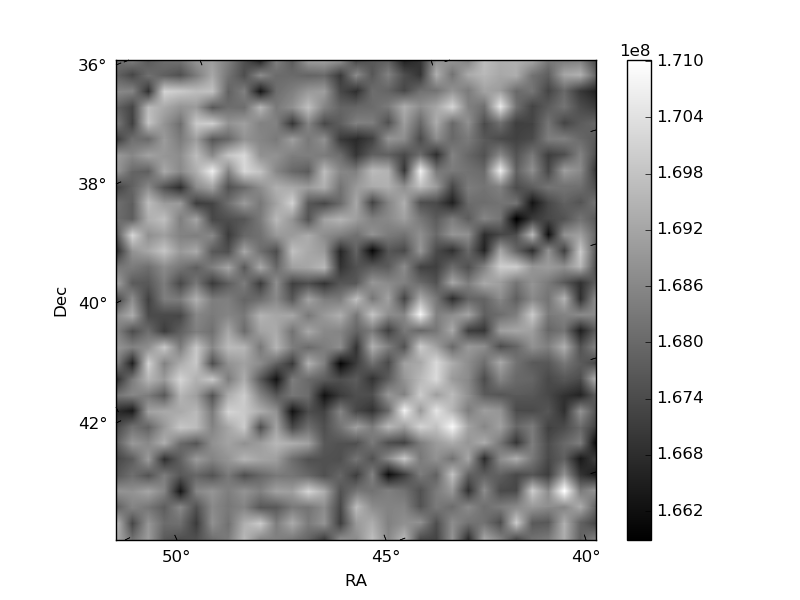
Quadrant B |
|---|---|---|---|
| Quadrant D | 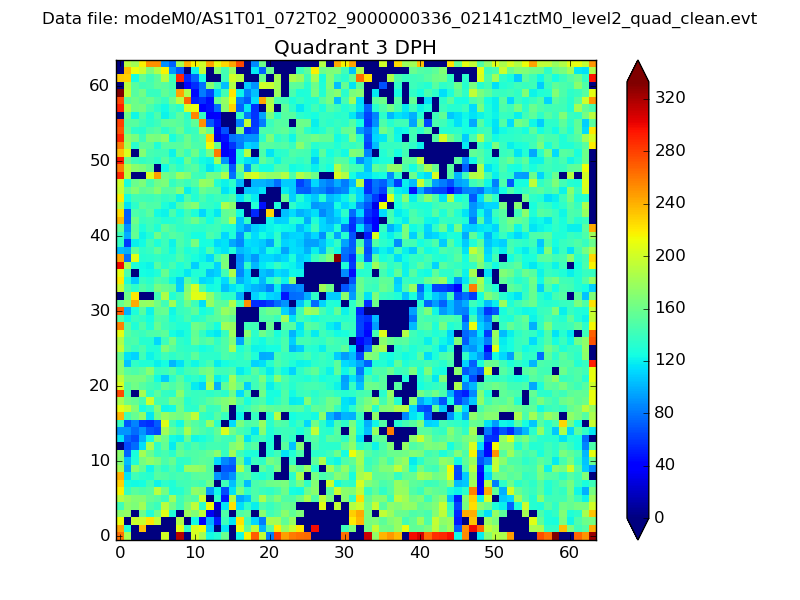 |
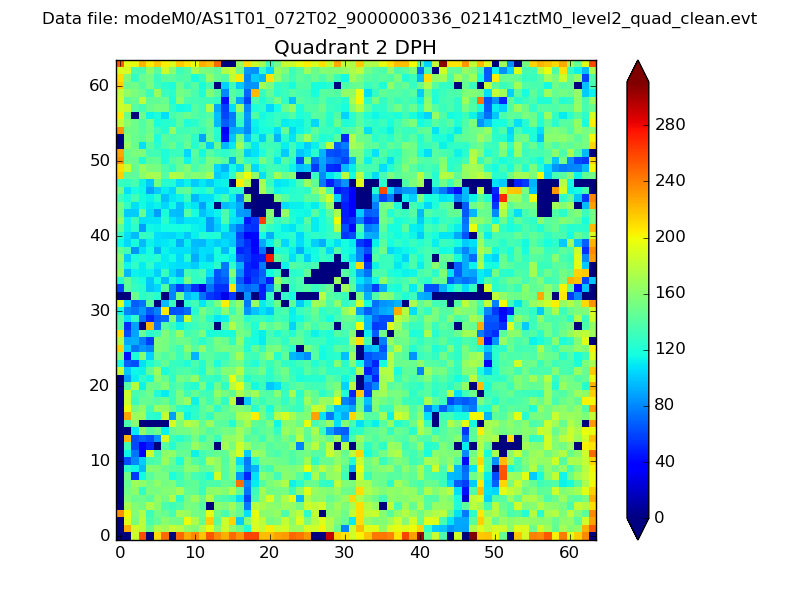 |
Quadrant C |
| Plot type | Count rate plots | Images |
|---|---|---|
| Comparison with Poisson distribution Blue bars denote a histogram of data divided into 1 sec bins. Red curve is a Poisson curve with rate = median count rate of data. |
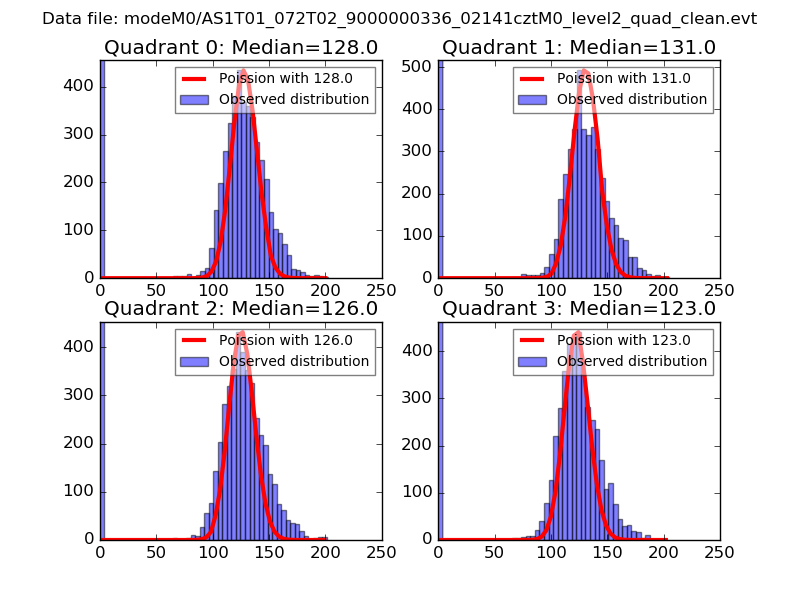 |
 |
| Quadrant-wise count rates Data is divided into 100 sec bins |
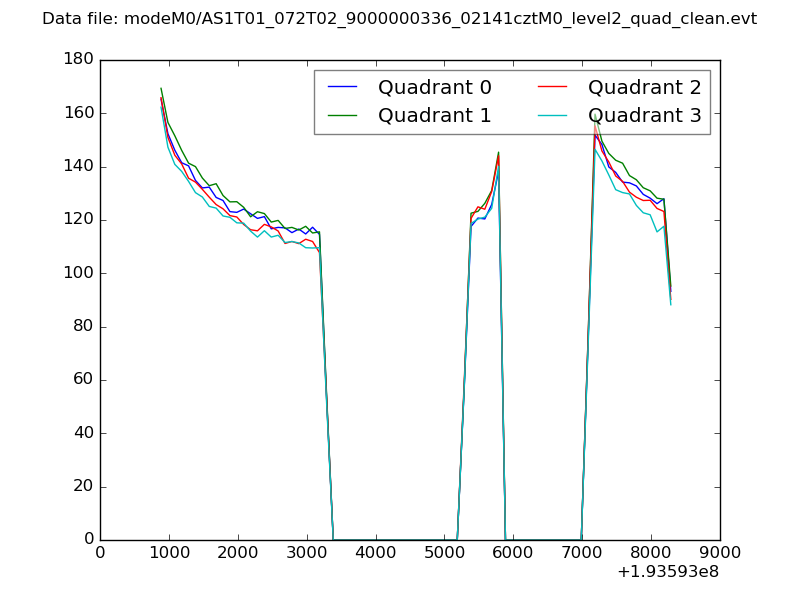 |
|
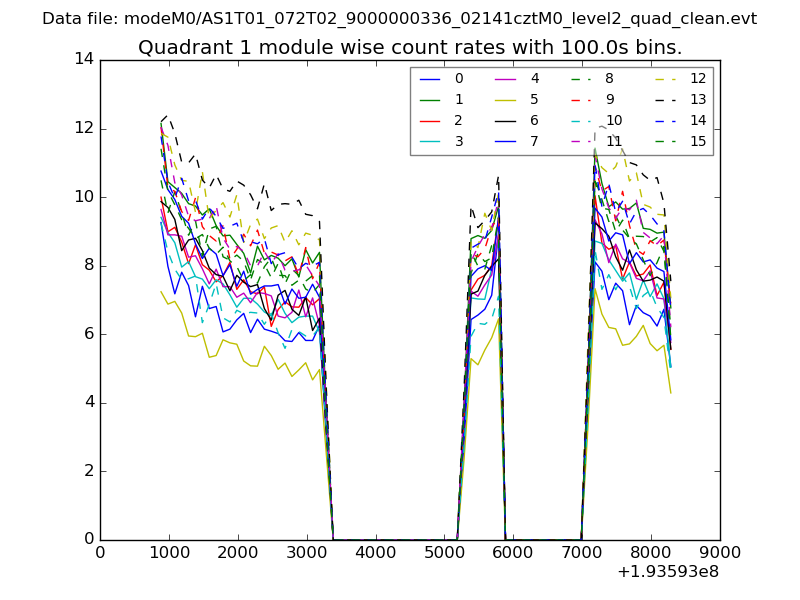
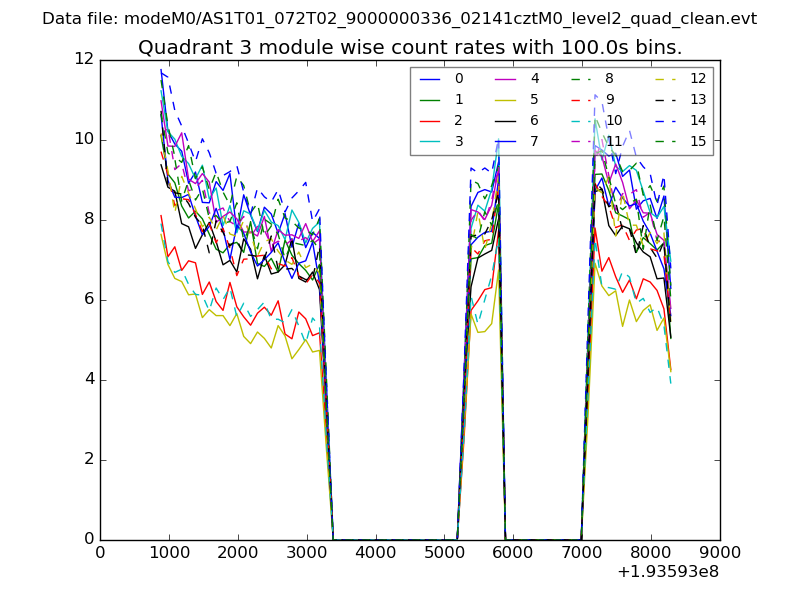
| Module-wise count rates for Quadrant A Data is divided into 100 sec bins |
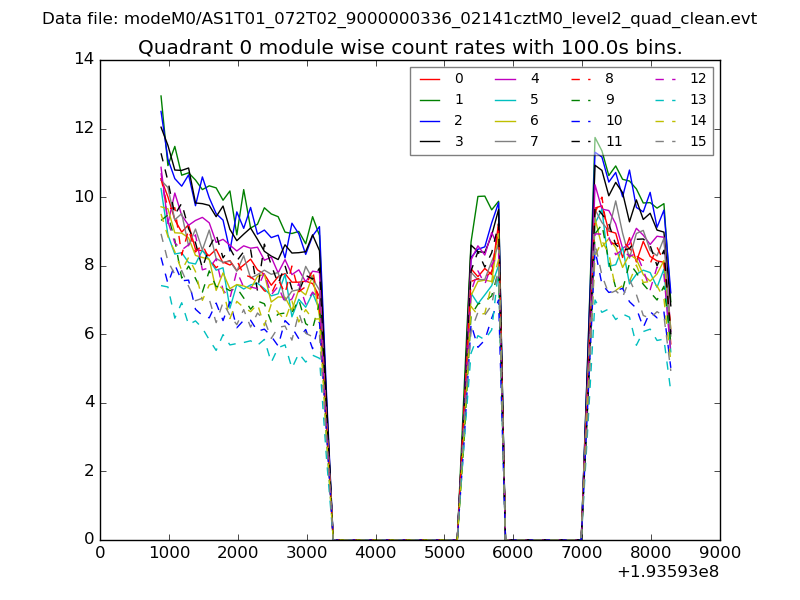 |
 |
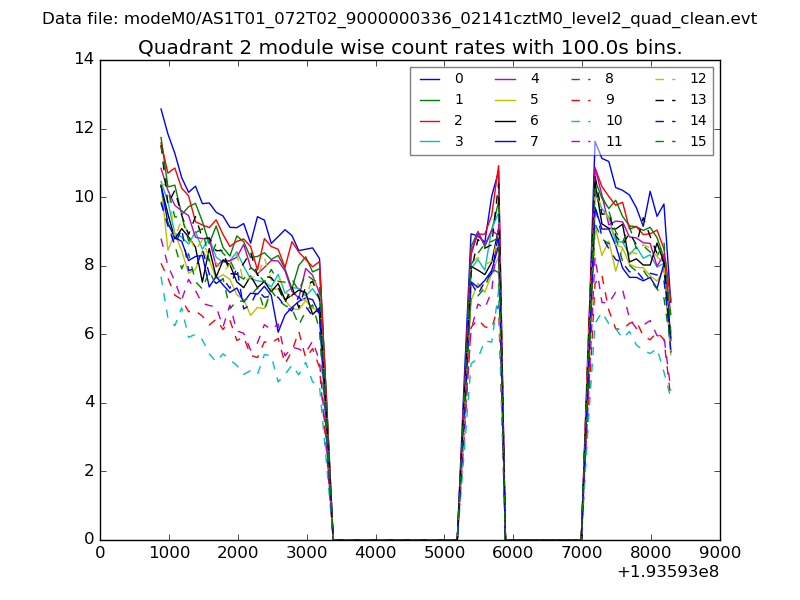
| Module-wise count rates for Quadrant B Data is divided into 100 sec bins |
 |
 |
| Module-wise count rates for Quadrant C Data is divided into 100 sec bins |
 |
 |
| Module-wise count rates for Quadrant D Data is divided into 100 sec bins |
 |
 |
| Parameter | Plot |
|---|---|
| CZT HV Monitor | 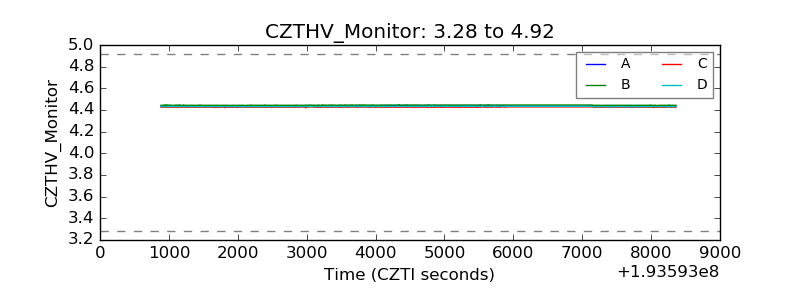 |
| D_VDD | 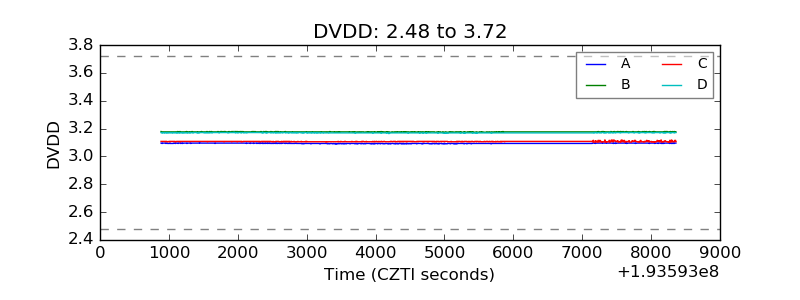 |
| Temperature 1 | 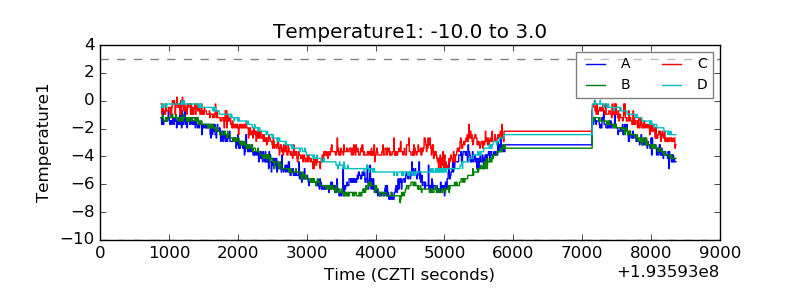 |
| Veto HV Monitor | 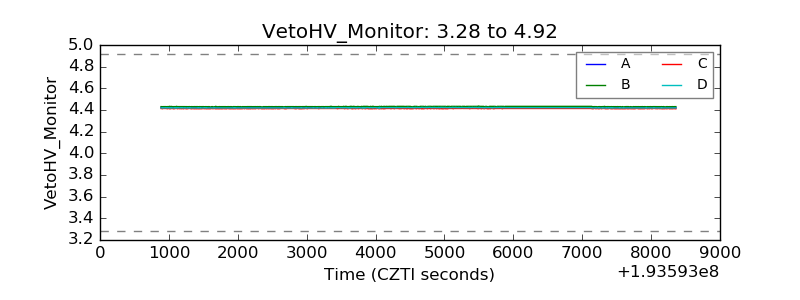 |
| Veto LLD | 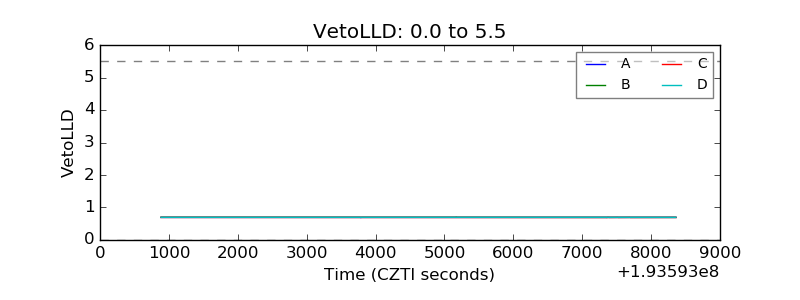 |
| Alpha Counter | 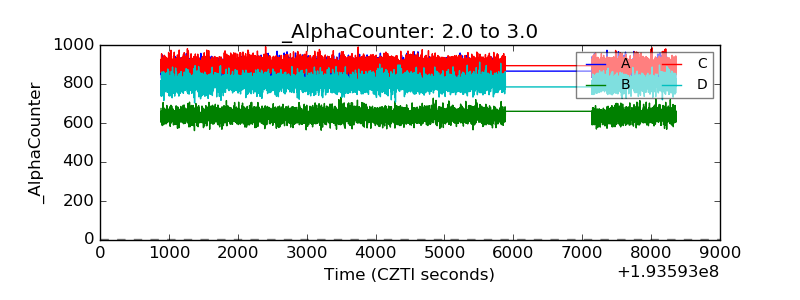 |
| _CPM_Rate | 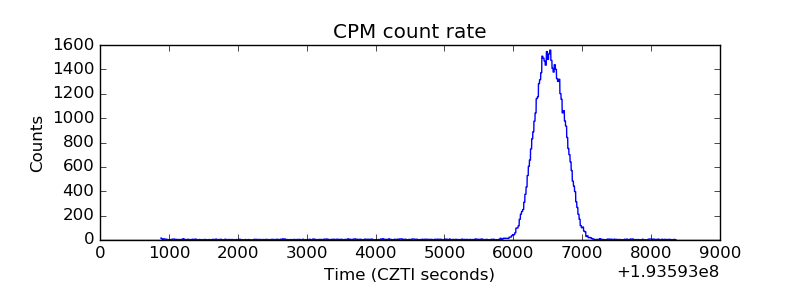 |
| CZT Counter | 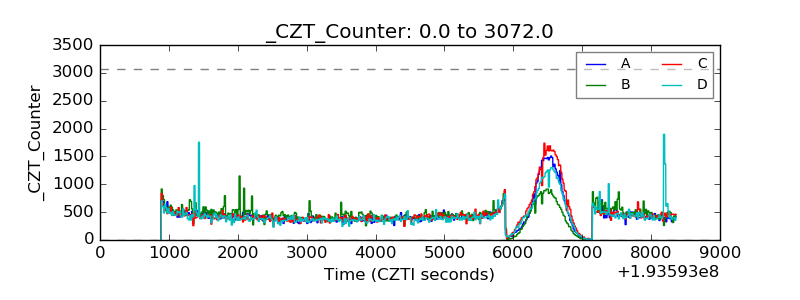 |
| +2.5 Volts monitor |  |
| +5 Volts monitor | 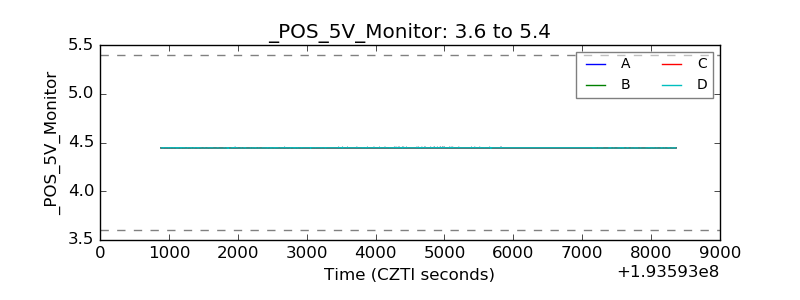 |
| _ROLL_ROT | 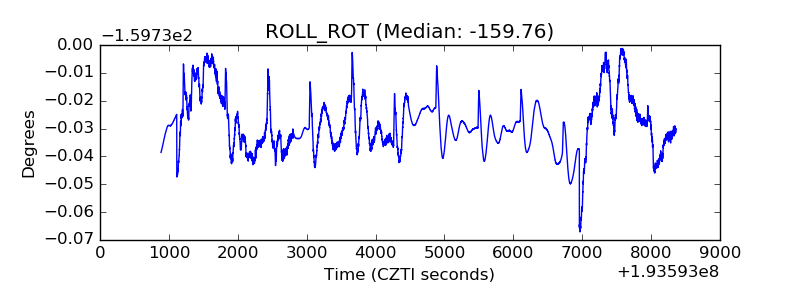 |
| _Roll_DEC | 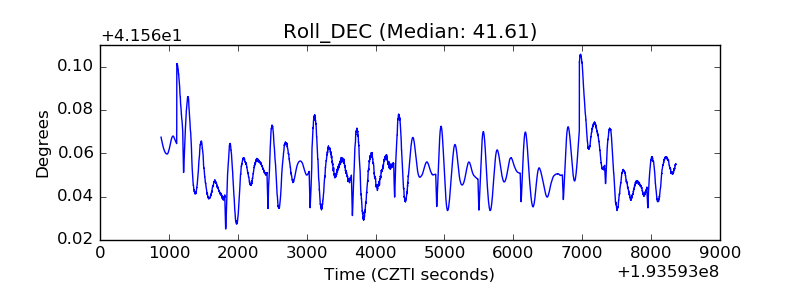 |
| _Roll_RA | 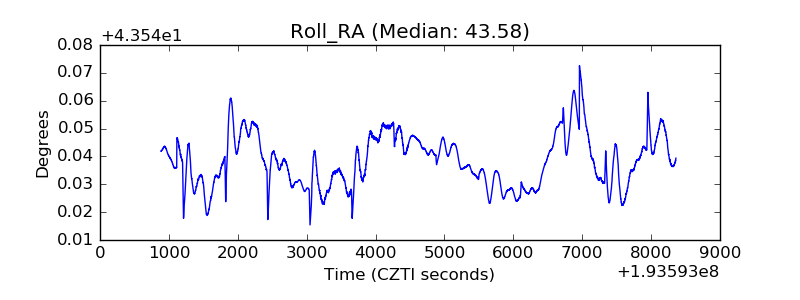 |
| Veto Counter | 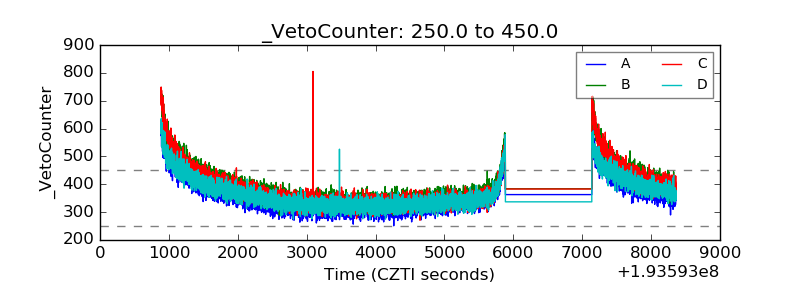 |