| Param | Original file | Final file |
|---|---|---|
| Filename | modeM0/AS1T01_072T02_9000000336_02144cztM0_level2.evt | modeM0/AS1T01_072T02_9000000336_02144cztM0_level2_quad_clean.evt |
| Size (bytes) | 377,622,720 | 79,202,880 |
| Size | 360.1 MB | 75.5 MB |
| Events in quadrant A | 2,623,815 | 488,111 |
| Events in quadrant B | 3,096,369 | 501,686 |
| Events in quadrant C | 2,713,652 | 483,811 |
| Events in quadrant D | 2,563,381 | 475,280 |
| Mode M0 | |||
|---|---|---|---|
| Quadrant | BADHDUFLAG | Total packets | Discarded packets |
| A | 0 | 13020 | 2 |
| B | 0 | 13625 | 2 |
| C | 0 | 13153 | 2 |
| D | 0 | 13130 | 2 |
| Mode SS | |||
|---|---|---|---|
| Quadrant | BADHDUFLAG | Total packets | Discarded packets |
| A | 0 | 130 | 0 |
| B | 0 | 130 | 0 |
| C | 0 | 130 | 0 |
| D | 0 | 130 | 0 |
| Mode M9 | |||
|---|---|---|---|
| Quadrant | BADHDUFLAG | Total packets | Discarded packets |
| A | 0 | 1 | 0 |
| B | 1 | 1 | 0 |
| C | 1 | -1 | -1 |
| D | 1 | -1 | -1 |
| Quadrant | Total seconds | Saturated seconds | Saturation percentage |
|---|---|---|---|
| A | 6440 | 3 | 0.046584% |
| B | 6440 | 12 | 0.186335% |
| C | 6440 | 6 | 0.093168% |
| D | 6440 | 15 | 0.232919% |
Noise dominated data is calculated using 1-second bins in cleaned event files. If a bin has >2000 counts, and if more than 50% of those come from <1% of pixels, then it is considered to be noise-dominated and hence unusable.
| Quadrant | # 1 sec bins | Bins with >0 counts | Bins with >2000 counts | High rate bins dominated by noise | Noise dominated (total time) | Noise dominated (detector-on time) | Marked lightcurve |
|---|---|---|---|---|---|---|---|
| A | 7470 | 6441 | 0 | 0 | 0.00% | 0.00% | 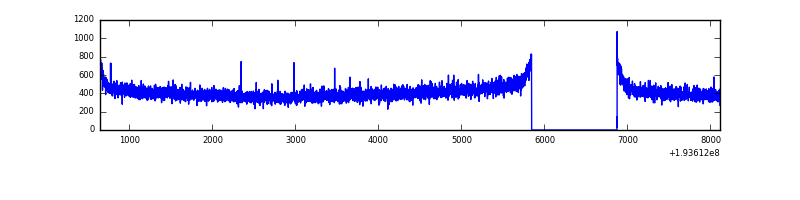 |
| B | 7470 | 6441 | 12 | 12 | 0.16% | 0.19% | 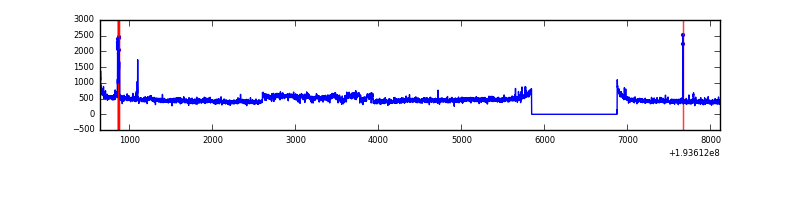 |
| C | 7470 | 6441 | 3 | 3 | 0.04% | 0.05% | 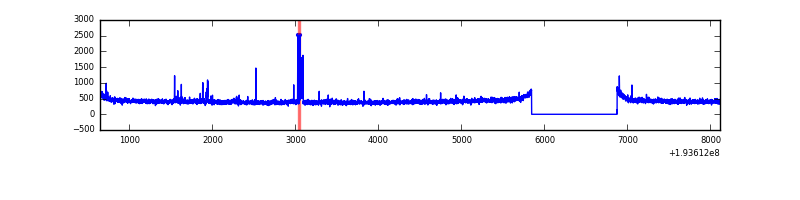 |
| D | 7470 | 6441 | 10 | 10 | 0.13% | 0.16% |  |
Top three noisy pixels from each quadrant. If the there are fewer than three noisy pixels in the level2.evt file, extra rows are filled as -1
| Pixel properties | Quadrant properties | ||||||
|---|---|---|---|---|---|---|---|
| Quadrant | DetID | PixID | Counts | Sigma | Mean | Median | Sigma |
| A | 15 | 191 | 19333 | 141.14 | 674 | 662 | 132.3 |
| A | 15 | 190 | 4215 | 26.86 | 674 | 662 | 132.3 |
| A | 0 | 1 | 3412 | 20.79 | 674 | 662 | 132.3 |
| B | 5 | 68 | 332284 | 2613.72 | 701 | 689 | 126.9 |
| B | 0 | 234 | 40478 | 313.63 | 701 | 689 | 126.9 |
| B | 4 | 216 | 39908 | 309.13 | 701 | 689 | 126.9 |
| C | 9 | 85 | 41009 | 276.46 | 667 | 670 | 145.9 |
| C | 10 | 82 | 38118 | 256.65 | 667 | 670 | 145.9 |
| C | 1 | 192 | 18627 | 123.07 | 667 | 670 | 145.9 |
| D | 9 | 64 | 25152 | 164.8 | 656 | 641 | 148.7 |
| D | 15 | 47 | 21784 | 142.15 | 656 | 641 | 148.7 |
| D | 10 | 199 | 13954 | 89.51 | 656 | 641 | 148.7 |
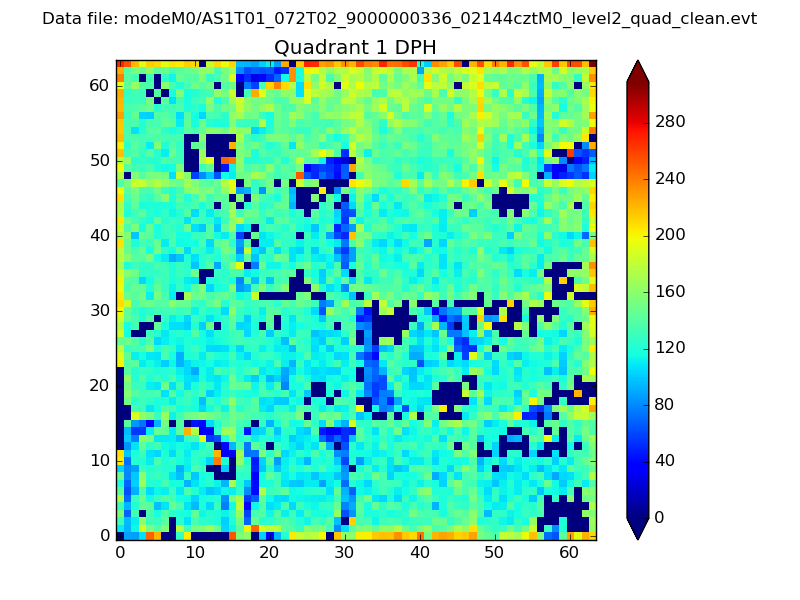
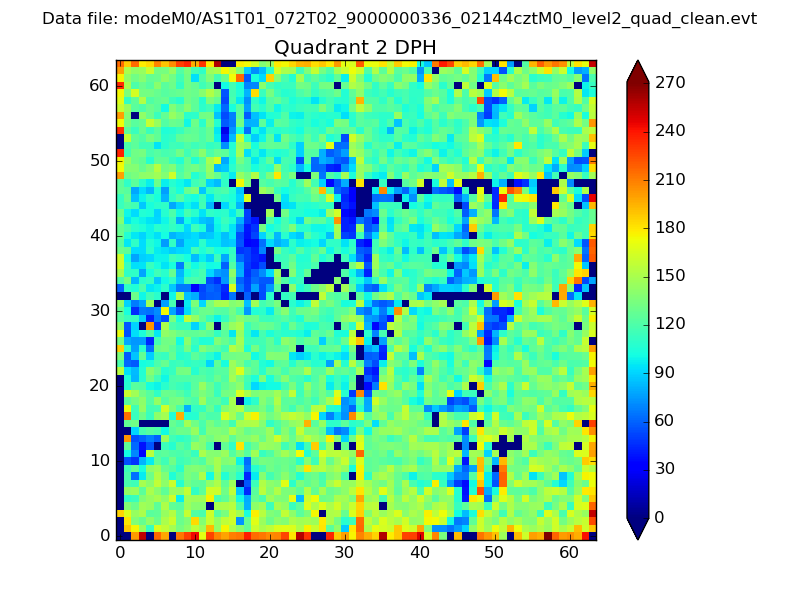
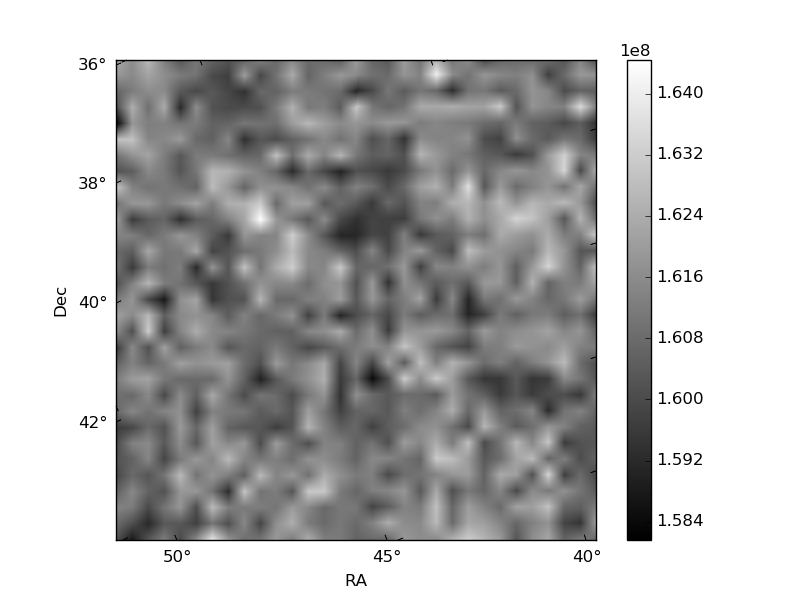
Histogram calculated using DETX and DETY for each event in the final _common_clean file
| Quadrant A | 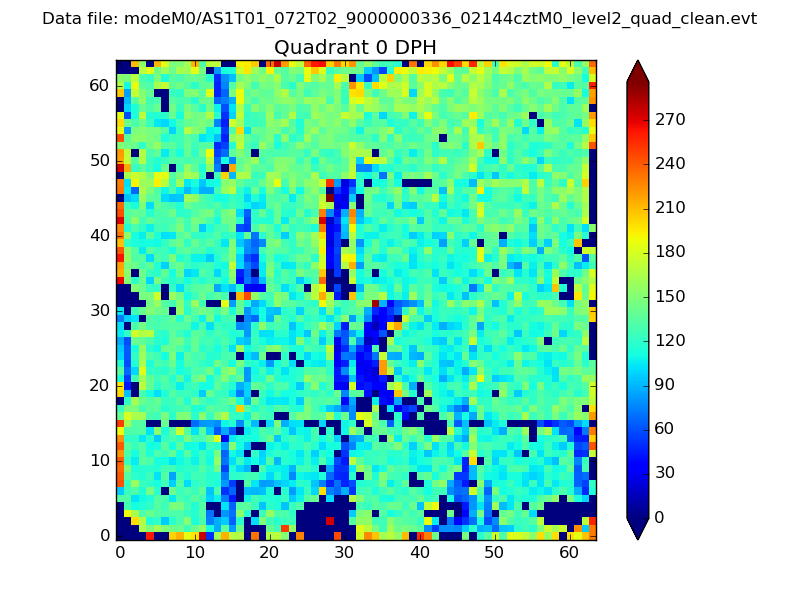 |
 |
Quadrant B |
|---|---|---|---|
| Quadrant D | 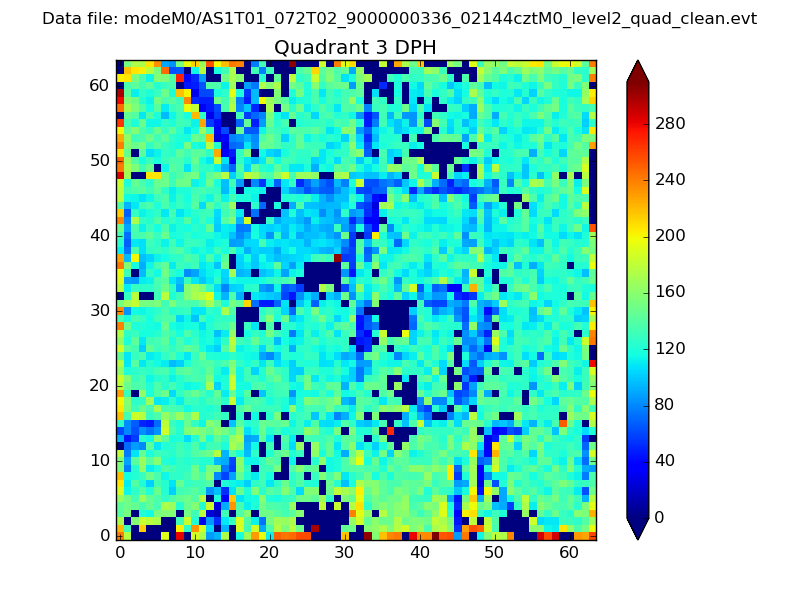 |
 |
Quadrant C |
| Plot type | Count rate plots | Images |
|---|---|---|
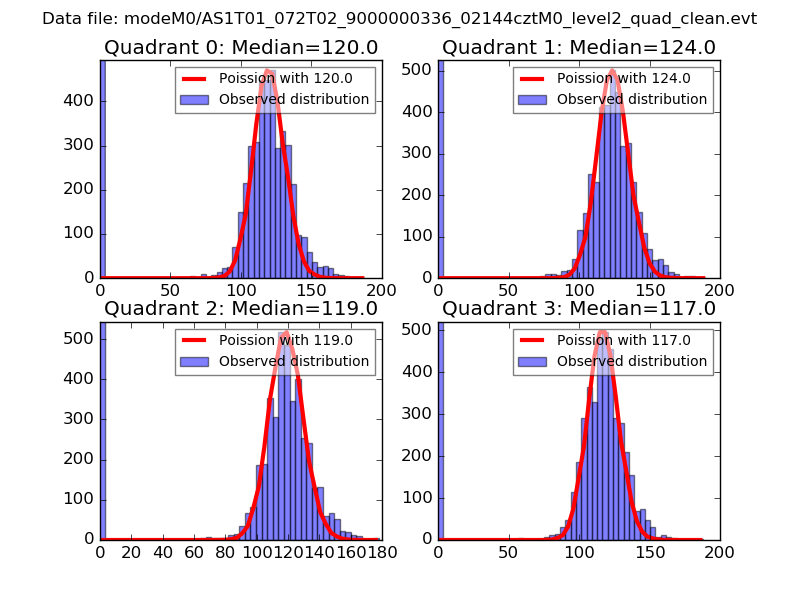
| Comparison with Poisson distribution Blue bars denote a histogram of data divided into 1 sec bins. Red curve is a Poisson curve with rate = median count rate of data. |
 |
 |
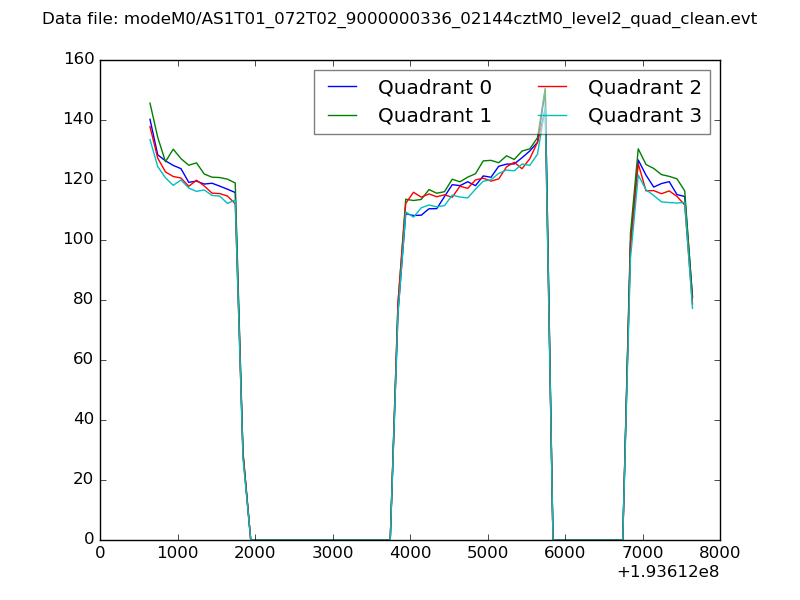
| Quadrant-wise count rates Data is divided into 100 sec bins |
 |
|
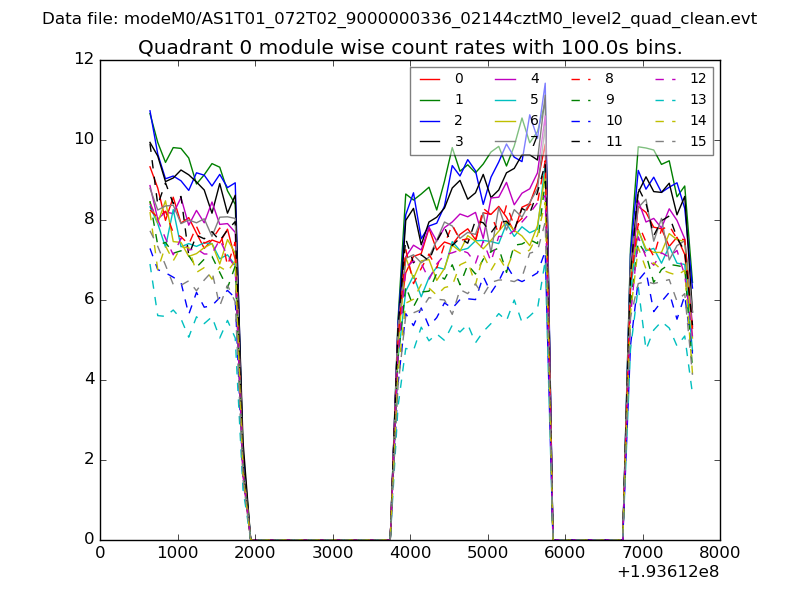
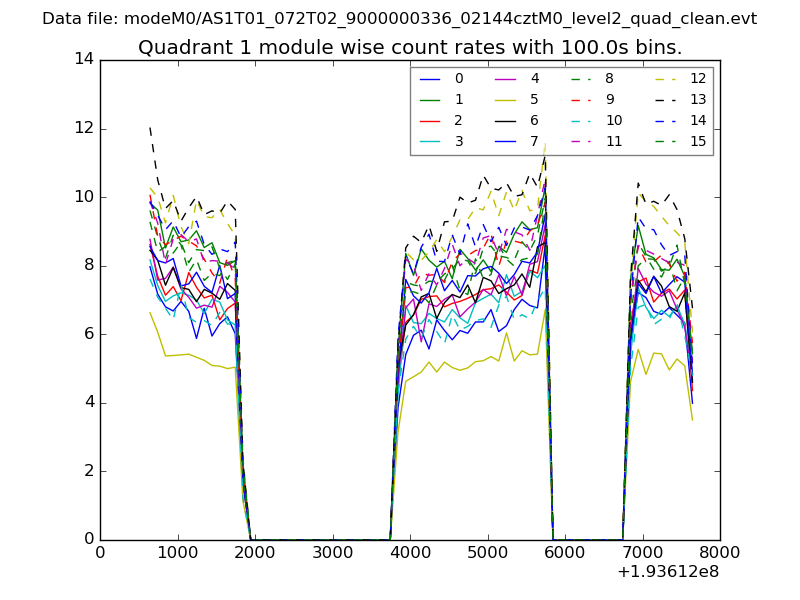
| Module-wise count rates for Quadrant A Data is divided into 100 sec bins |
 |
 |
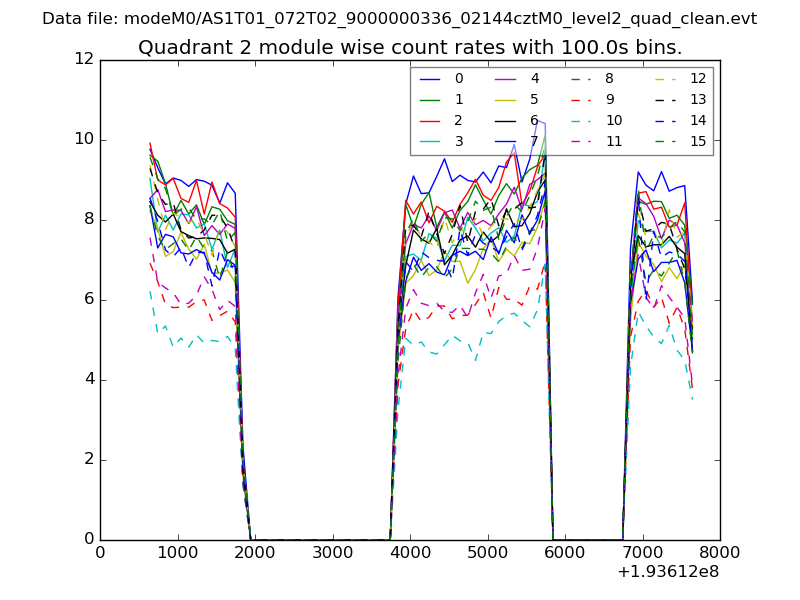
| Module-wise count rates for Quadrant B Data is divided into 100 sec bins |
 |
 |
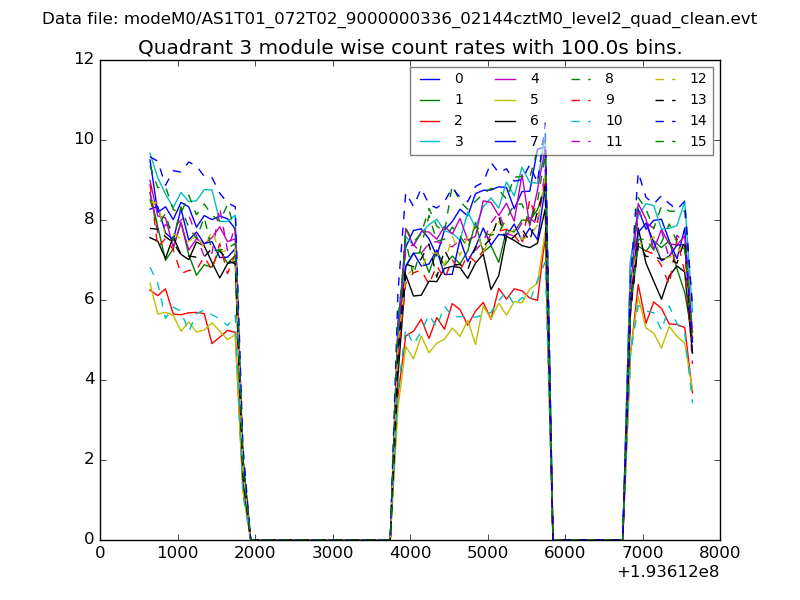
| Module-wise count rates for Quadrant C Data is divided into 100 sec bins |
 |
 |
| Module-wise count rates for Quadrant D Data is divided into 100 sec bins |
 |
 |
| Parameter | Plot |
|---|---|
| CZT HV Monitor | 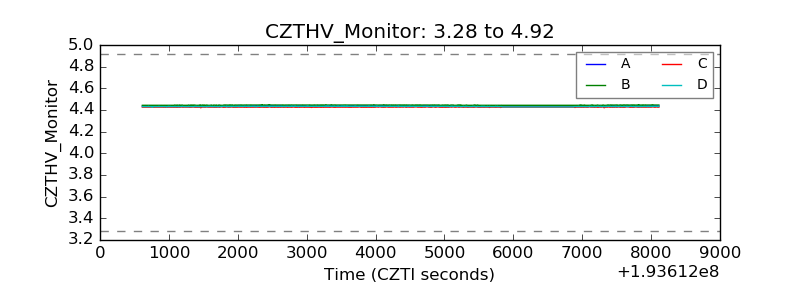 |
| D_VDD | 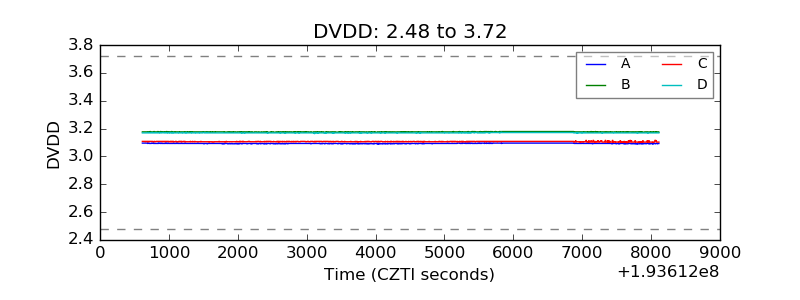 |
| Temperature 1 | 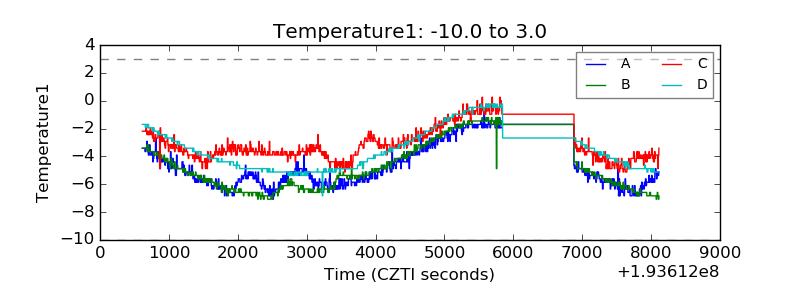 |
| Veto HV Monitor | 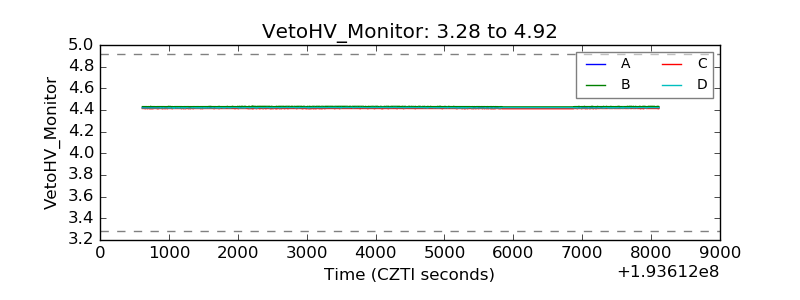 |
| Veto LLD | 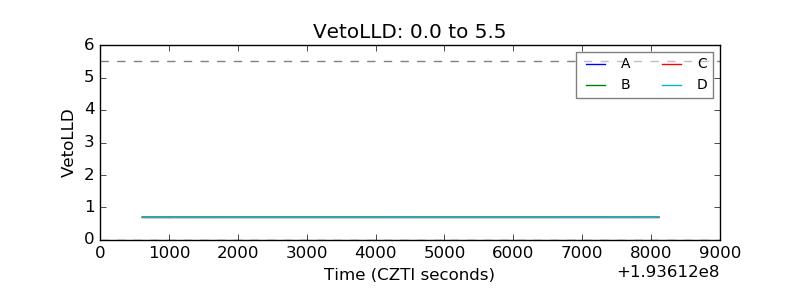 |
| Alpha Counter | 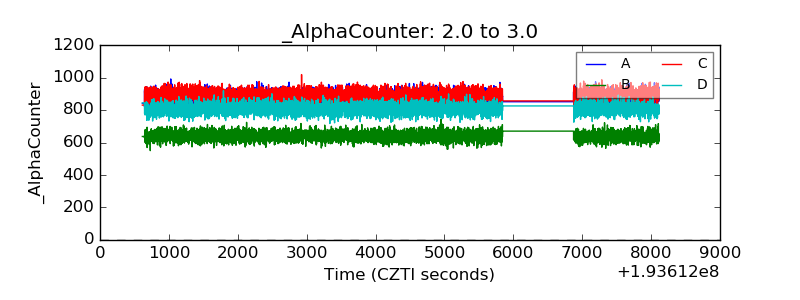 |
| _CPM_Rate | 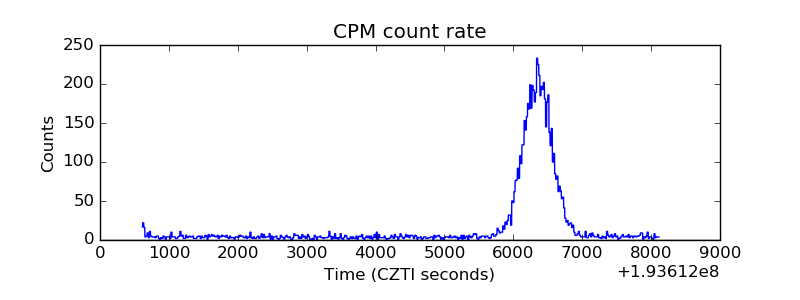 |
| CZT Counter | 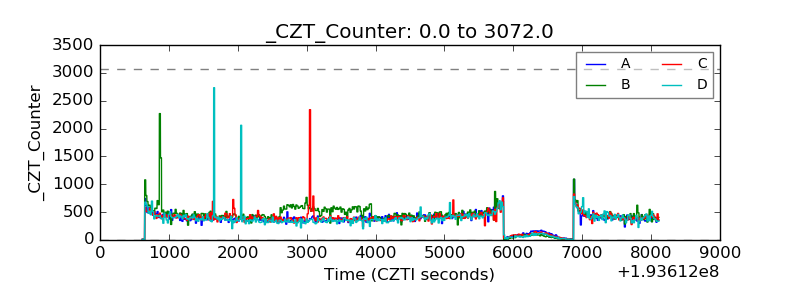 |
| +2.5 Volts monitor |  |
| +5 Volts monitor | 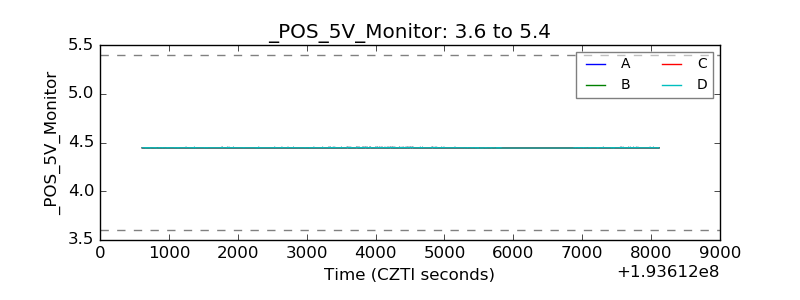 |
| _ROLL_ROT | 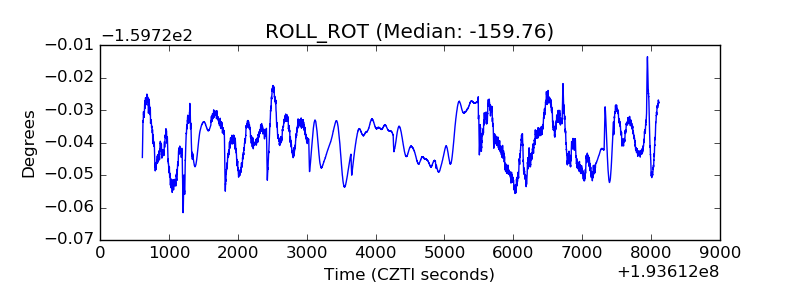 |
| _Roll_DEC | 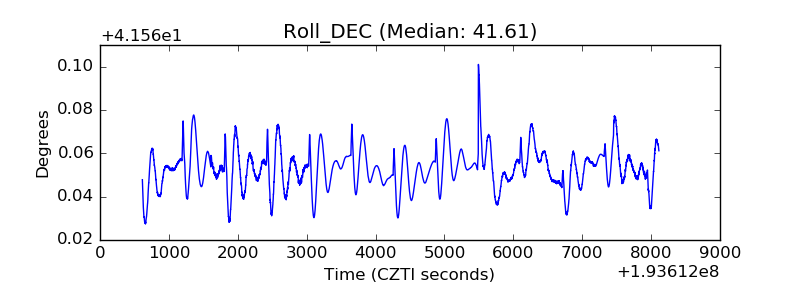 |
| _Roll_RA | 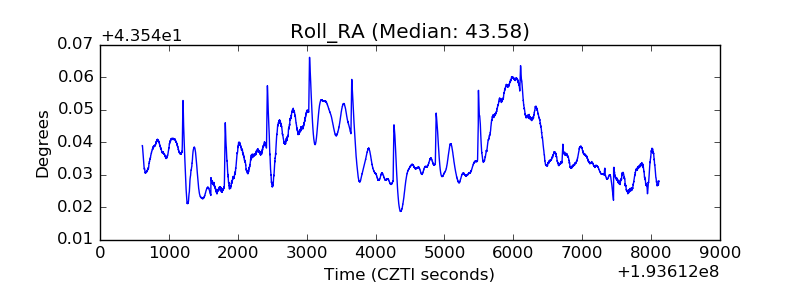 |
| Veto Counter | 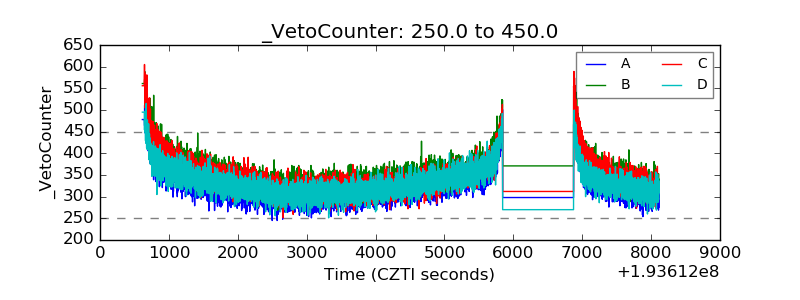 |