| Param | Original file | Final file |
|---|---|---|
| Filename | modeM0/AS1T01_072T02_9000000336_02145cztM0_level2.evt | modeM0/AS1T01_072T02_9000000336_02145cztM0_level2_quad_clean.evt |
| Size (bytes) | 408,528,000 | 79,519,680 |
| Size | 389.6 MB | 75.8 MB |
| Events in quadrant A | 2,926,698 | 479,204 |
| Events in quadrant B | 3,111,201 | 488,774 |
| Events in quadrant C | 2,985,469 | 471,693 |
| Events in quadrant D | 2,855,857 | 464,350 |
| Mode M0 | |||
|---|---|---|---|
| Quadrant | BADHDUFLAG | Total packets | Discarded packets |
| A | 0 | 14690 | 2 |
| B | 0 | 14892 | 2 |
| C | 0 | 14698 | 2 |
| D | 0 | 14769 | 2 |
| Mode SS | |||
|---|---|---|---|
| Quadrant | BADHDUFLAG | Total packets | Discarded packets |
| A | 0 | 144 | 0 |
| B | 0 | 144 | 0 |
| C | 0 | 144 | 0 |
| D | 0 | 144 | 0 |
| Mode M9 | |||
|---|---|---|---|
| Quadrant | BADHDUFLAG | Total packets | Discarded packets |
| A | 0 | 1 | 0 |
| B | 1 | 1 | 0 |
| C | 1 | -1 | -1 |
| D | 1 | -1 | -1 |
| Quadrant | Total seconds | Saturated seconds | Saturation percentage |
|---|---|---|---|
| A | 7240 | 5 | 0.069061% |
| B | 7240 | 17 | 0.234807% |
| C | 7240 | 5 | 0.069061% |
| D | 7240 | 8 | 0.110497% |
Noise dominated data is calculated using 1-second bins in cleaned event files. If a bin has >2000 counts, and if more than 50% of those come from <1% of pixels, then it is considered to be noise-dominated and hence unusable.
| Quadrant | # 1 sec bins | Bins with >0 counts | Bins with >2000 counts | High rate bins dominated by noise | Noise dominated (total time) | Noise dominated (detector-on time) | Marked lightcurve |
|---|---|---|---|---|---|---|---|
| A | 7925 | 7241 | 0 | 0 | 0.00% | 0.00% | 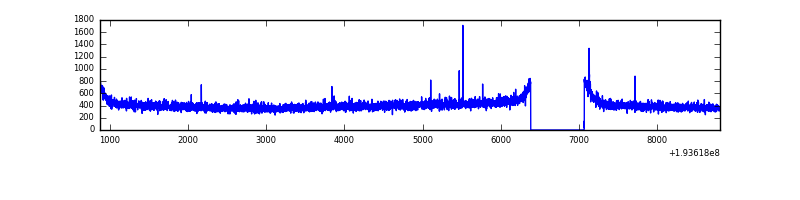 |
| B | 7925 | 7241 | 10 | 10 | 0.13% | 0.14% |  |
| C | 7925 | 7241 | 0 | 0 | 0.00% | 0.00% | 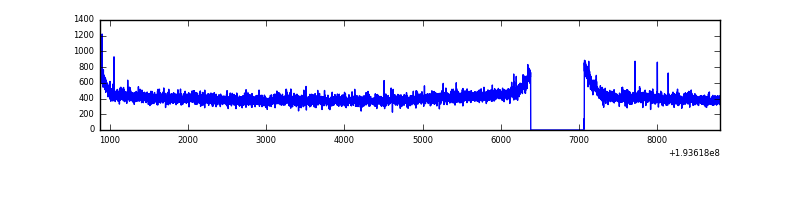 |
| D | 7925 | 7241 | 5 | 5 | 0.06% | 0.07% | 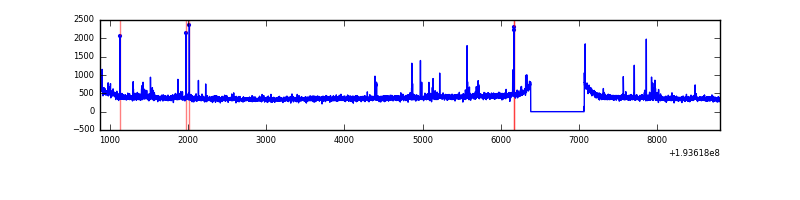 |
Top three noisy pixels from each quadrant. If the there are fewer than three noisy pixels in the level2.evt file, extra rows are filled as -1
| Pixel properties | Quadrant properties | ||||||
|---|---|---|---|---|---|---|---|
| Quadrant | DetID | PixID | Counts | Sigma | Mean | Median | Sigma |
| A | 15 | 171 | 6943 | 41.4 | 757 | 742 | 149.8 |
| A | 15 | 191 | 6086 | 35.68 | 757 | 742 | 149.8 |
| A | 0 | 1 | 3700 | 19.75 | 757 | 742 | 149.8 |
| B | 5 | 68 | 60691 | 413.79 | 787 | 771 | 144.8 |
| B | 0 | 228 | 16601 | 109.32 | 787 | 771 | 144.8 |
| B | 5 | 189 | 11123 | 71.49 | 787 | 771 | 144.8 |
| C | 9 | 85 | 47113 | 280.09 | 747 | 750 | 165.5 |
| C | 10 | 82 | 4995 | 25.65 | 747 | 750 | 165.5 |
| C | 10 | 65 | 3778 | 18.29 | 747 | 750 | 165.5 |
| D | 9 | 64 | 25669 | 150.94 | 733 | 716 | 165.3 |
| D | 13 | 53 | 18427 | 107.13 | 733 | 716 | 165.3 |
| D | 15 | 47 | 14272 | 82.0 | 733 | 716 | 165.3 |
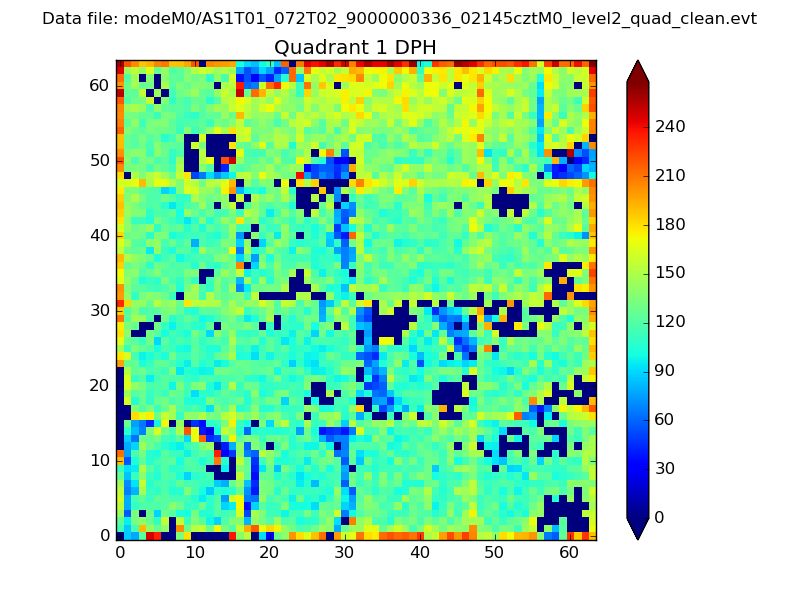
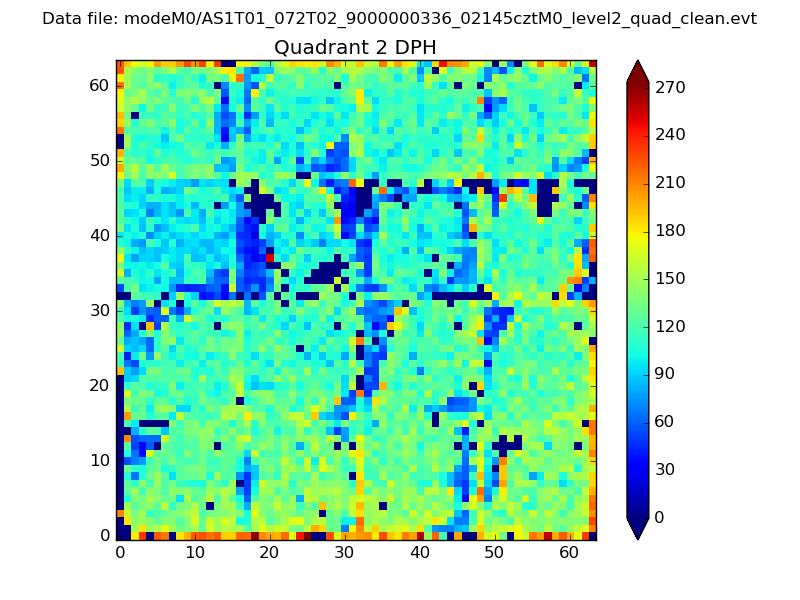
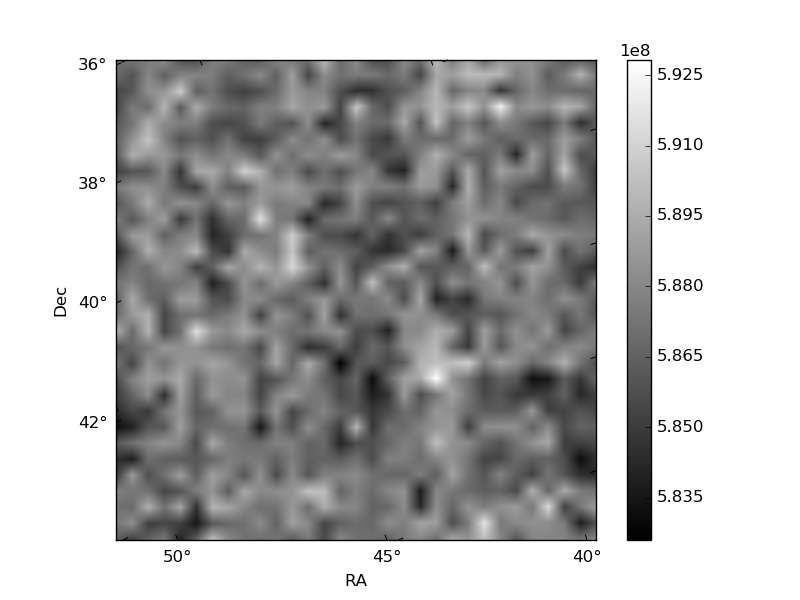
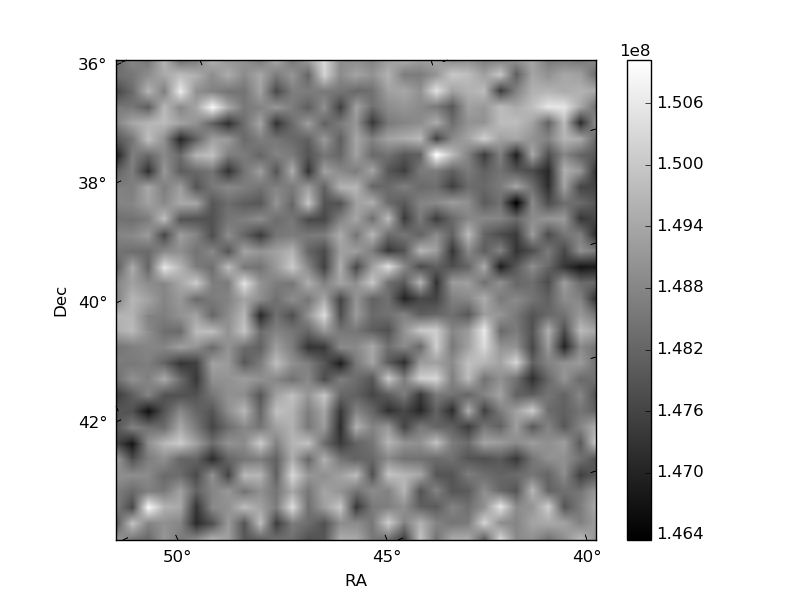
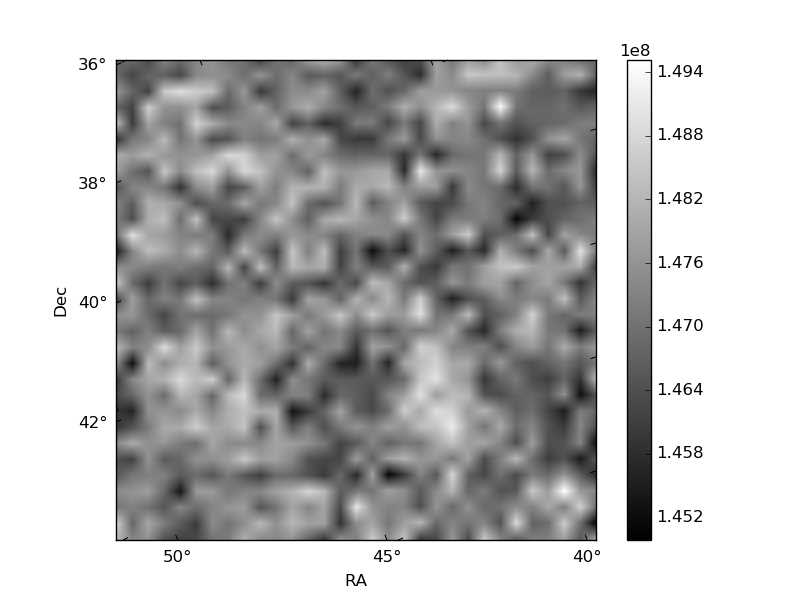
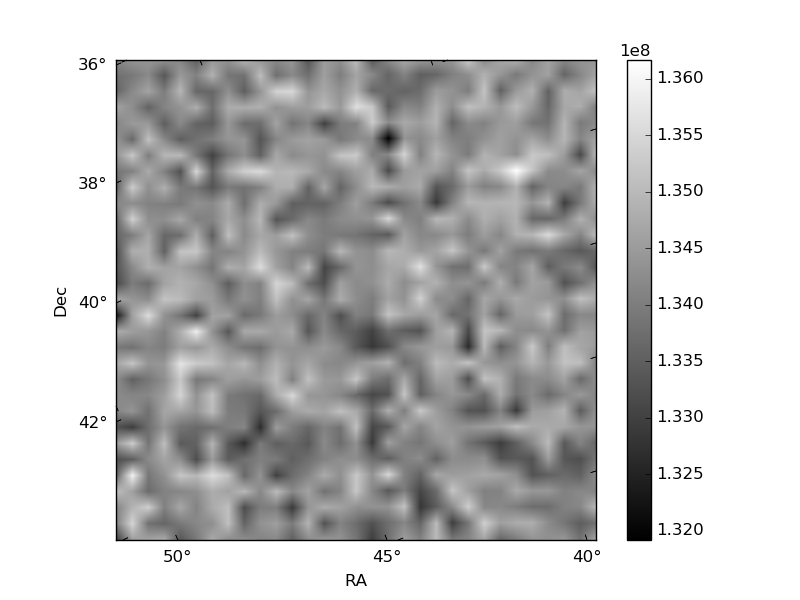
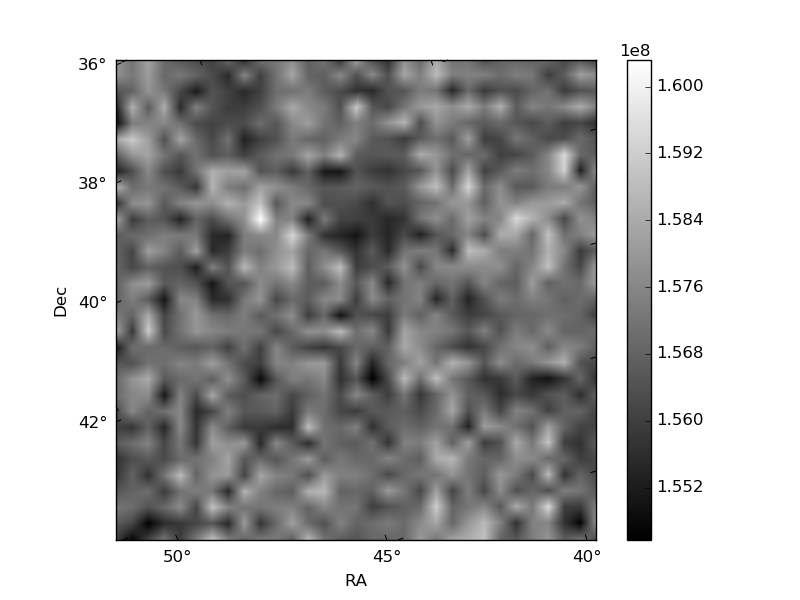
Histogram calculated using DETX and DETY for each event in the final _common_clean file
| Quadrant A | 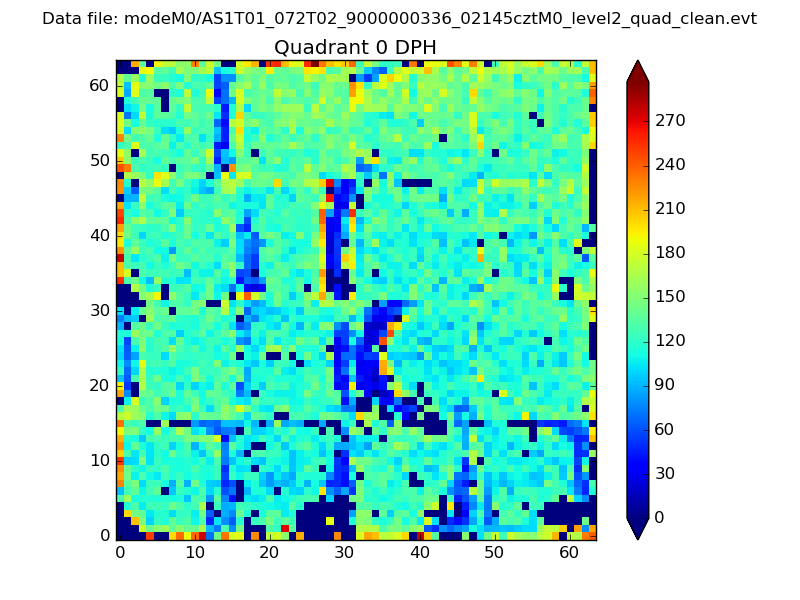 |
 |
Quadrant B |
|---|---|---|---|
| Quadrant D | 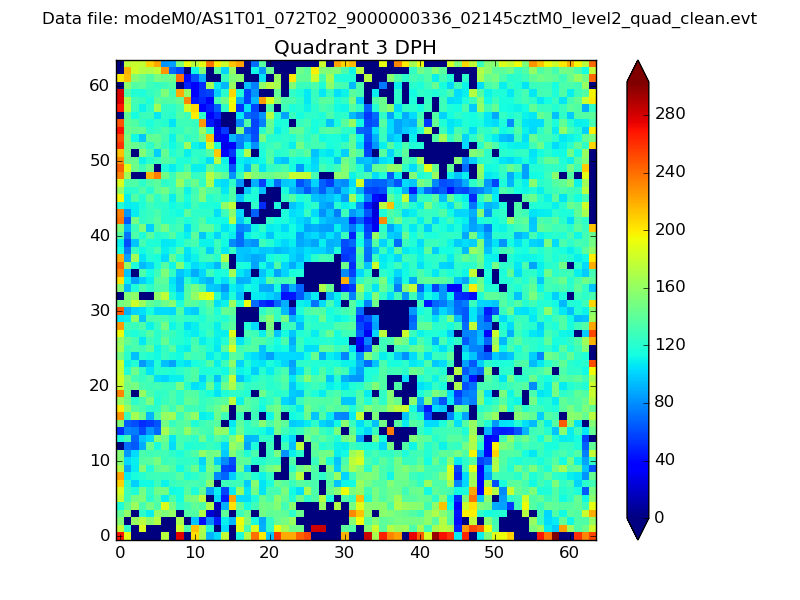 |
 |
Quadrant C |
| Plot type | Count rate plots | Images |
|---|---|---|
| Comparison with Poisson distribution Blue bars denote a histogram of data divided into 1 sec bins. Red curve is a Poisson curve with rate = median count rate of data. |
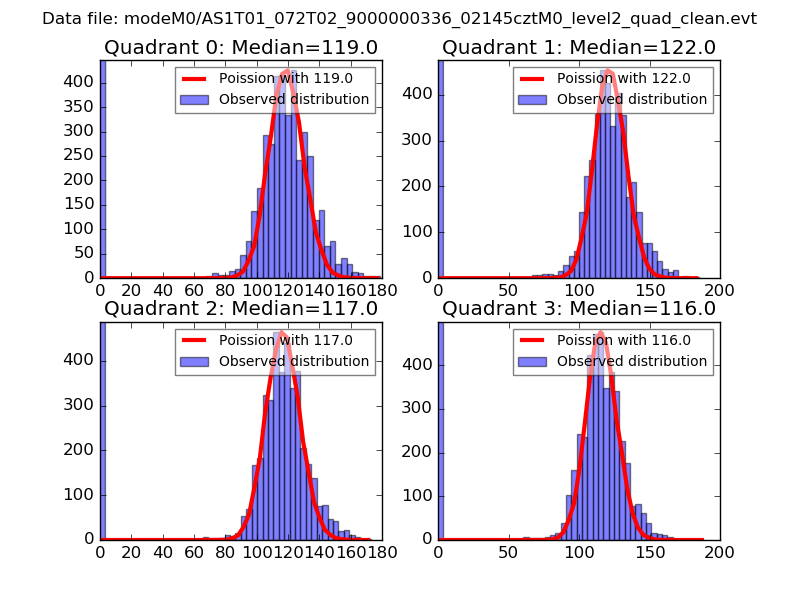 |
 |
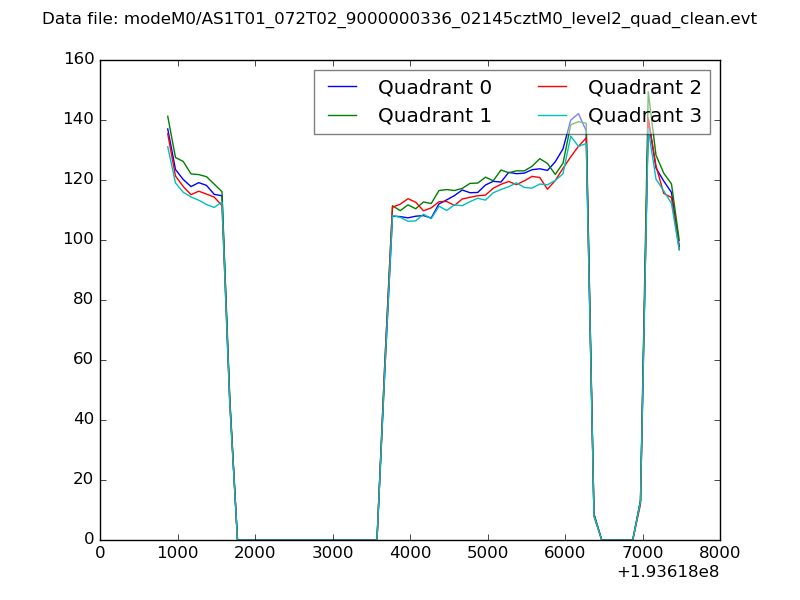
| Quadrant-wise count rates Data is divided into 100 sec bins |
 |
|
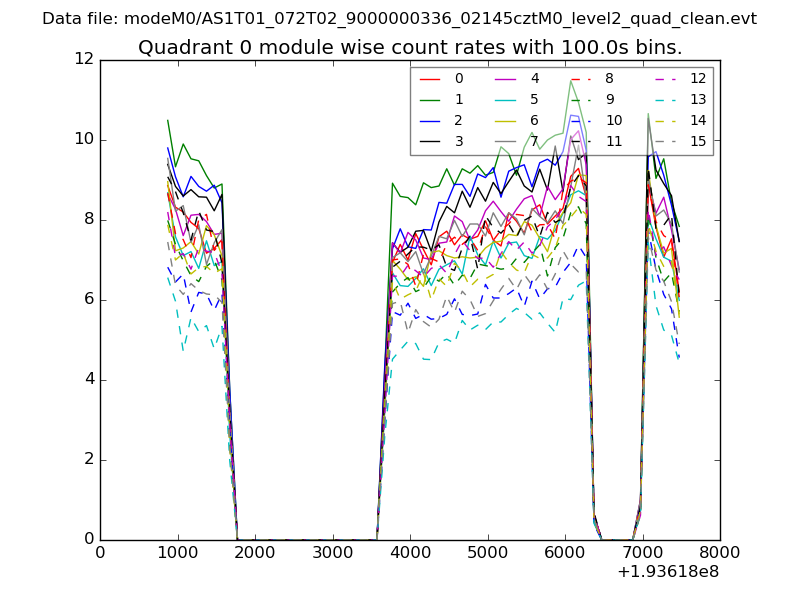
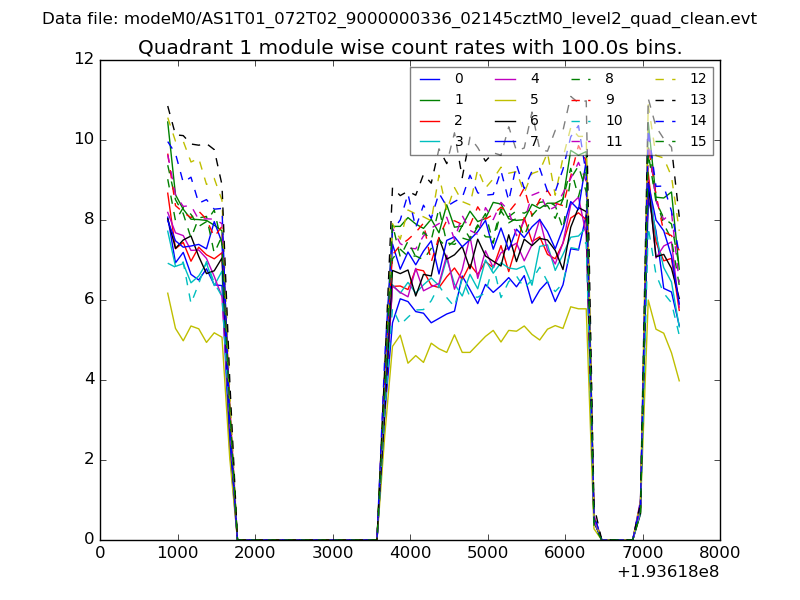
| Module-wise count rates for Quadrant A Data is divided into 100 sec bins |
 |
 |
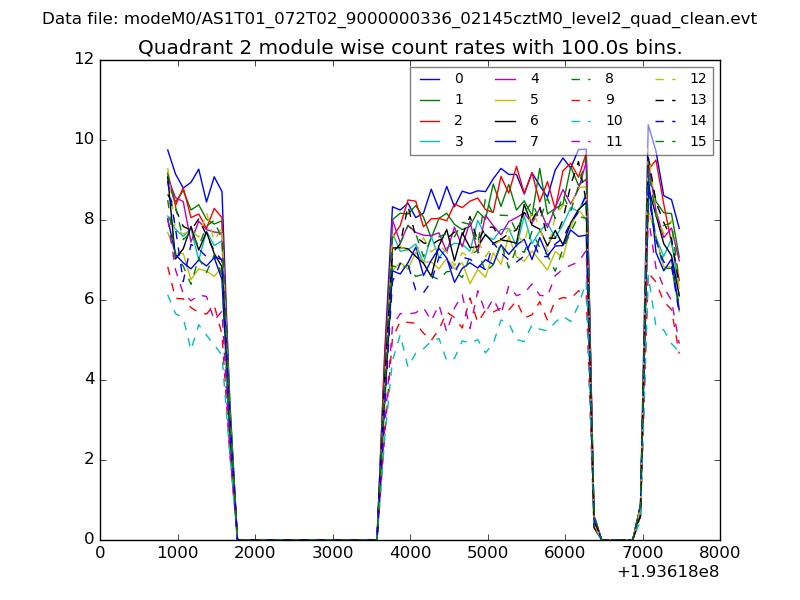
| Module-wise count rates for Quadrant B Data is divided into 100 sec bins |
 |
 |
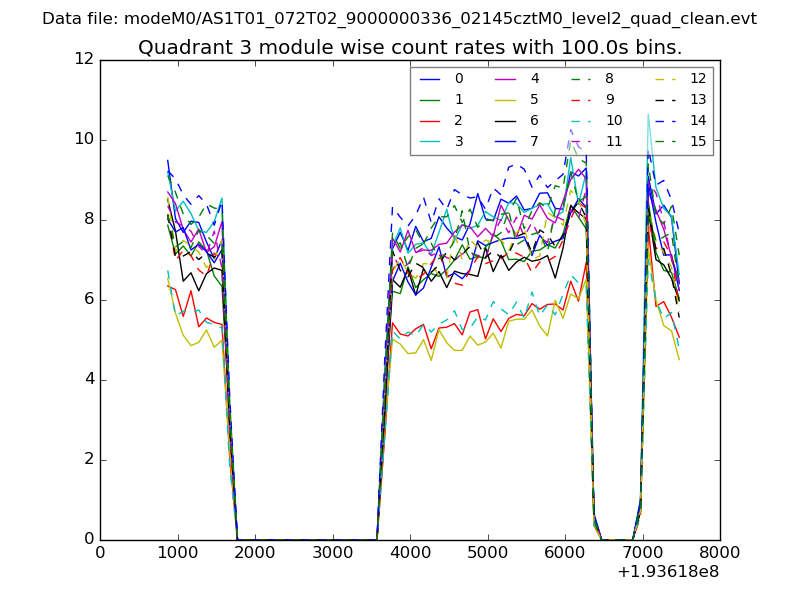
| Module-wise count rates for Quadrant C Data is divided into 100 sec bins |
 |
 |
| Module-wise count rates for Quadrant D Data is divided into 100 sec bins |
 |
 |
| Parameter | Plot |
|---|---|
| CZT HV Monitor | 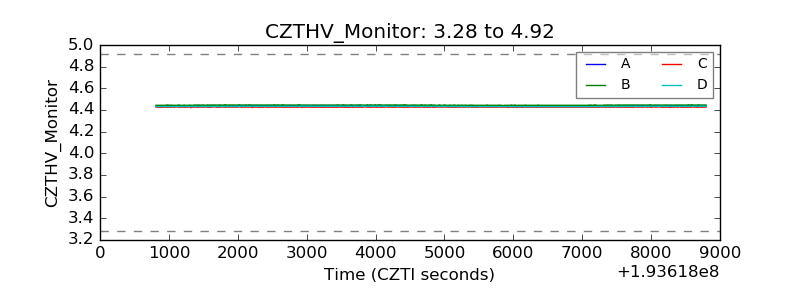 |
| D_VDD | 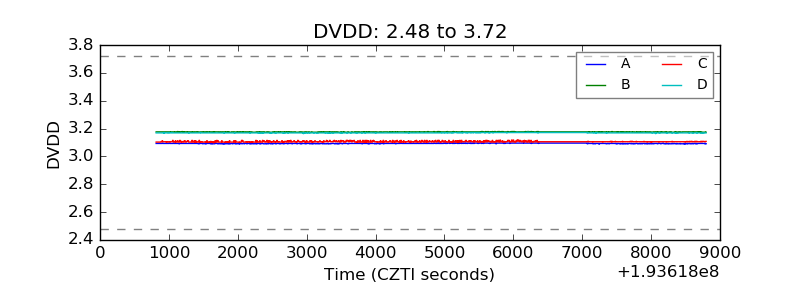 |
| Temperature 1 | 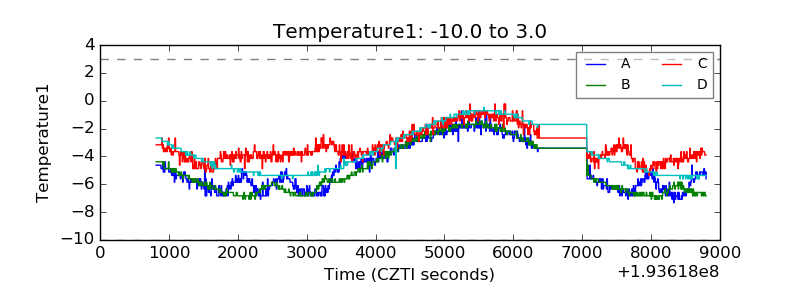 |
| Veto HV Monitor | 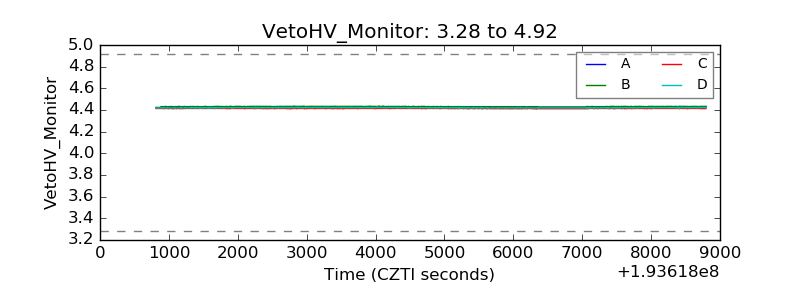 |
| Veto LLD | 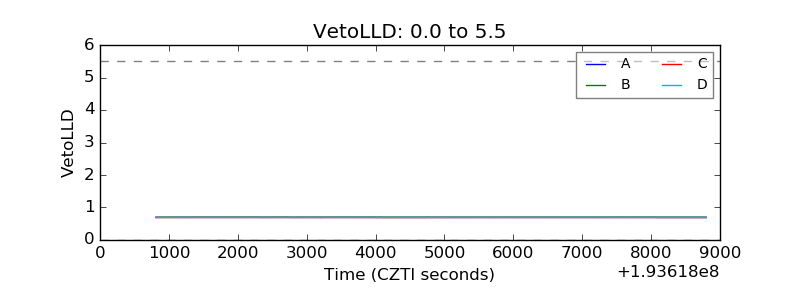 |
| Alpha Counter | 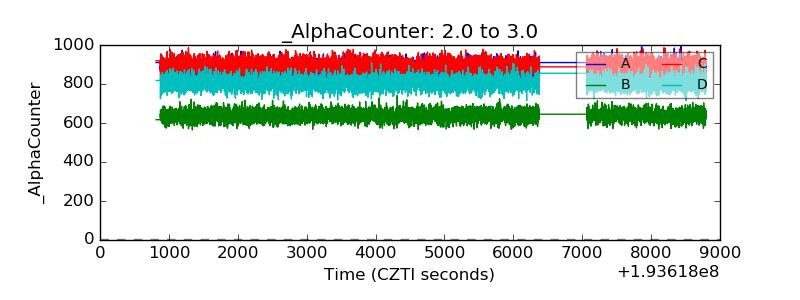 |
| _CPM_Rate | 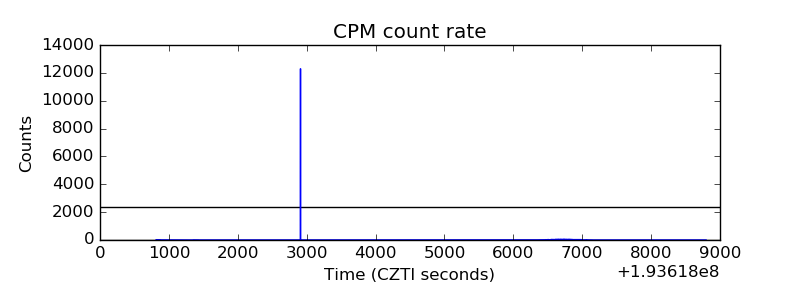 |
| CZT Counter | 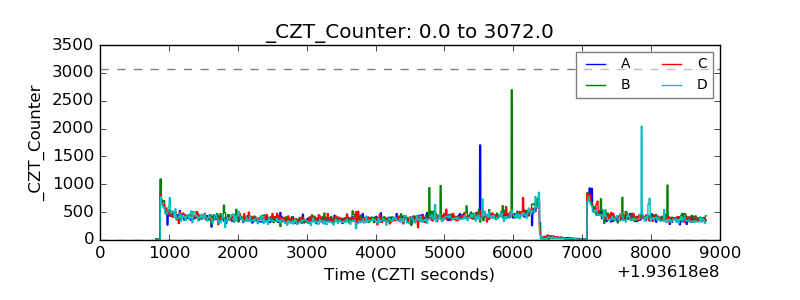 |
| +2.5 Volts monitor | 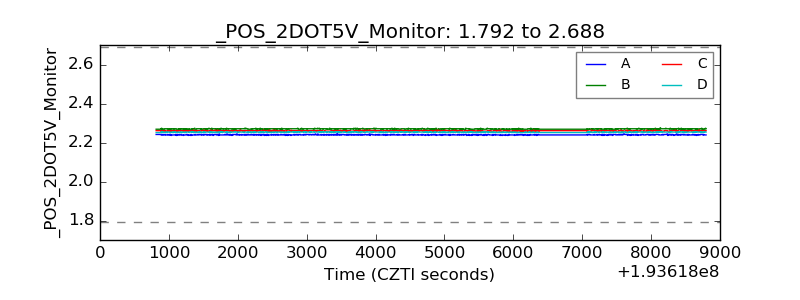 |
| +5 Volts monitor | 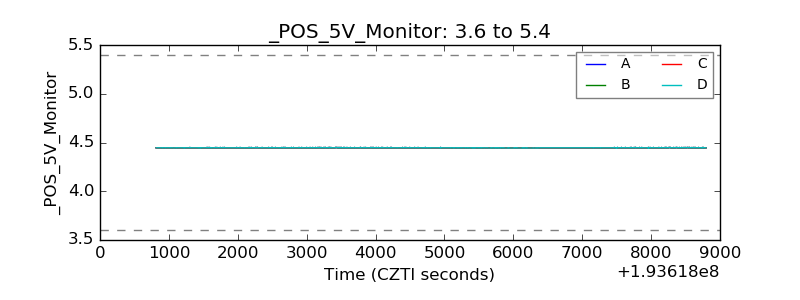 |
| _ROLL_ROT | 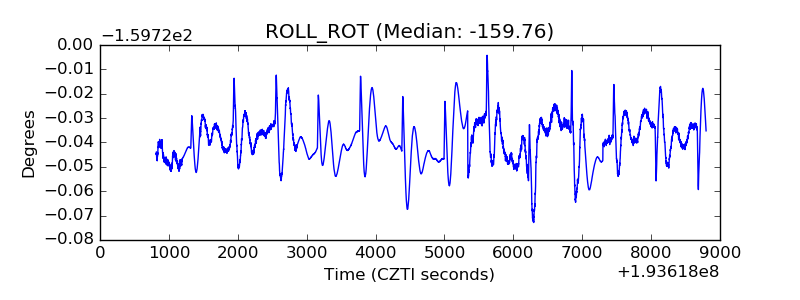 |
| _Roll_DEC | 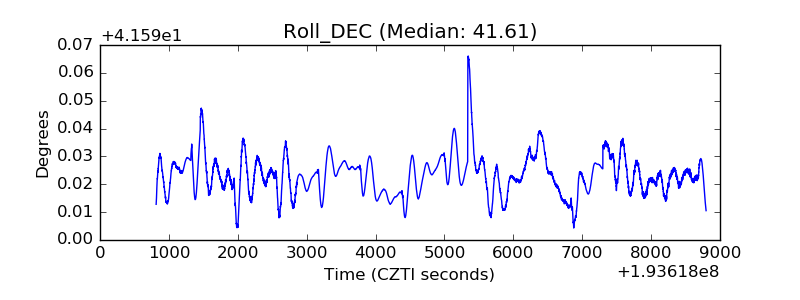 |
| _Roll_RA | 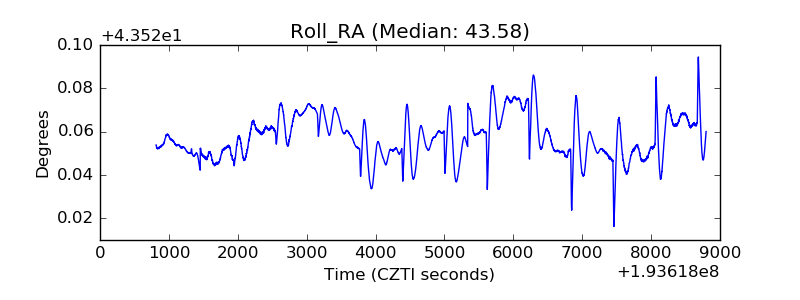 |
| Veto Counter | 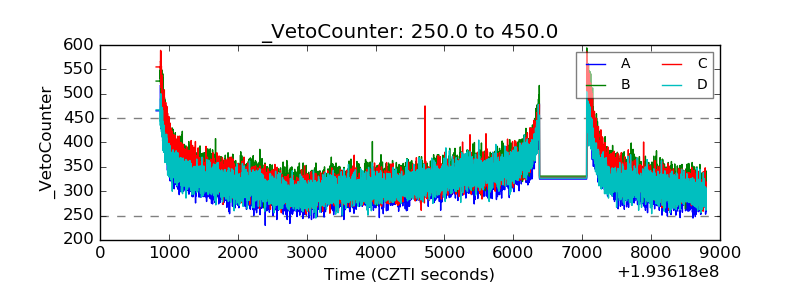 |