| Param | Original file | Final file |
|---|---|---|
| Filename | modeM0/AS1T01_072T02_9000000336_02147cztM0_level2.evt | modeM0/AS1T01_072T02_9000000336_02147cztM0_level2_quad_clean.evt |
| Size (bytes) | 559,224,000 | 90,014,400 |
| Size | 533.3 MB | 85.8 MB |
| Events in quadrant A | 5,592,552 | 537,589 |
| Events in quadrant B | 3,756,499 | 550,690 |
| Events in quadrant C | 3,591,296 | 532,848 |
| Events in quadrant D | 3,429,385 | 525,664 |
| Mode M0 | |||
|---|---|---|---|
| Quadrant | BADHDUFLAG | Total packets | Discarded packets |
| A | 0 | 23149 | 2 |
| B | 0 | 17518 | 2 |
| C | 0 | 17343 | 6 |
| D | 0 | 17297 | 2 |
| Mode SS | |||
|---|---|---|---|
| Quadrant | BADHDUFLAG | Total packets | Discarded packets |
| A | 0 | 168 | 0 |
| B | 0 | 168 | 0 |
| C | 0 | 168 | 0 |
| D | 0 | 168 | 0 |
| Mode M9 | |||
|---|---|---|---|
| Quadrant | BADHDUFLAG | Total packets | Discarded packets |
| A | 0 | 2 | 0 |
| B | 0 | 1 | 0 |
| C | 0 | 1 | 0 |
| D | 0 | 2 | 0 |
| Quadrant | Total seconds | Saturated seconds | Saturation percentage |
|---|---|---|---|
| A | 8338 | 684 | 8.203406% |
| B | 8338 | 127 | 1.523147% |
| C | 8336 | 46 | 0.551823% |
| D | 8338 | 16 | 0.191893% |
Noise dominated data is calculated using 1-second bins in cleaned event files. If a bin has >2000 counts, and if more than 50% of those come from <1% of pixels, then it is considered to be noise-dominated and hence unusable.
| Quadrant | # 1 sec bins | Bins with >0 counts | Bins with >2000 counts | High rate bins dominated by noise | Noise dominated (total time) | Noise dominated (detector-on time) | Marked lightcurve |
|---|---|---|---|---|---|---|---|
| A | 8633 | 8340 | 330 | 330 | 3.82% | 3.96% | 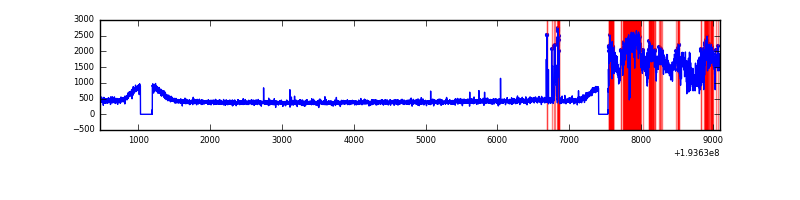 |
| B | 8633 | 8340 | 4 | 4 | 0.05% | 0.05% | 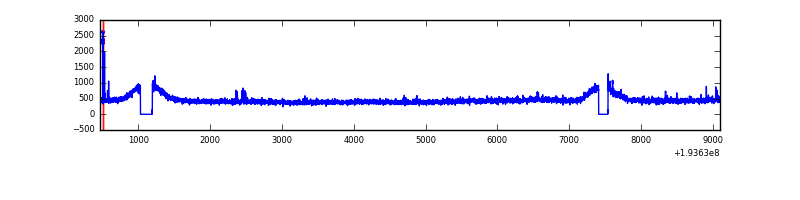 |
| C | 8633 | 8339 | 0 | 0 | 0.00% | 0.00% |  |
| D | 8633 | 8340 | 4 | 4 | 0.05% | 0.05% |  |
Top three noisy pixels from each quadrant. If the there are fewer than three noisy pixels in the level2.evt file, extra rows are filled as -1
| Pixel properties | Quadrant properties | ||||||
|---|---|---|---|---|---|---|---|
| Quadrant | DetID | PixID | Counts | Sigma | Mean | Median | Sigma |
| A | 15 | 171 | 2160826 | 12237.1 | 892 | 873 | 176.5 |
| A | 0 | 1 | 6234 | 30.37 | 892 | 873 | 176.5 |
| A | 10 | 2 | 2110 | 7.01 | 892 | 873 | 176.5 |
| B | 5 | 68 | 80429 | 450.16 | 956 | 934 | 176.6 |
| B | 0 | 220 | 14476 | 76.69 | 956 | 934 | 176.6 |
| B | 0 | 234 | 11570 | 60.23 | 956 | 934 | 176.6 |
| C | 10 | 82 | 17317 | 82.3 | 908 | 912 | 199.3 |
| C | 12 | 4 | 9967 | 45.43 | 908 | 912 | 199.3 |
| C | 1 | 192 | 4779 | 19.4 | 908 | 912 | 199.3 |
| D | 13 | 53 | 29591 | 141.46 | 894 | 871 | 203.0 |
| D | 10 | 199 | 15902 | 74.04 | 894 | 871 | 203.0 |
| D | 5 | 233 | 8690 | 38.51 | 894 | 871 | 203.0 |
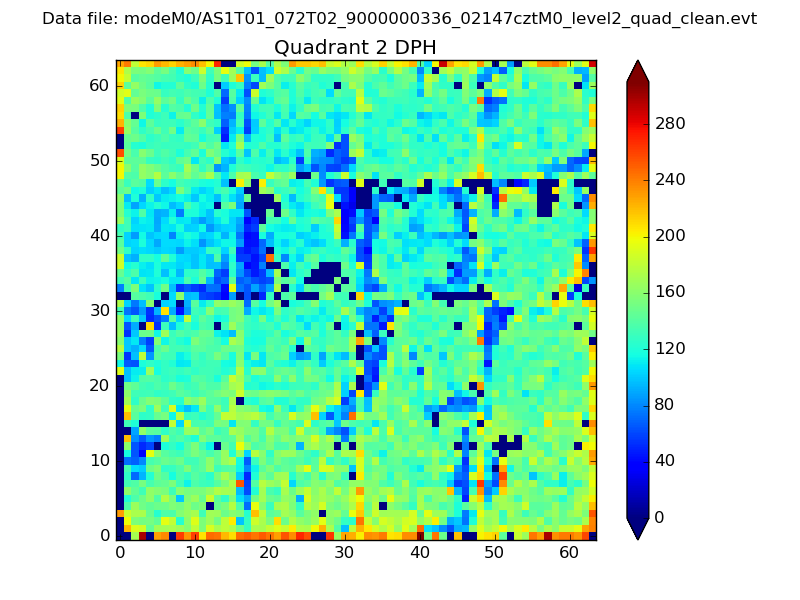
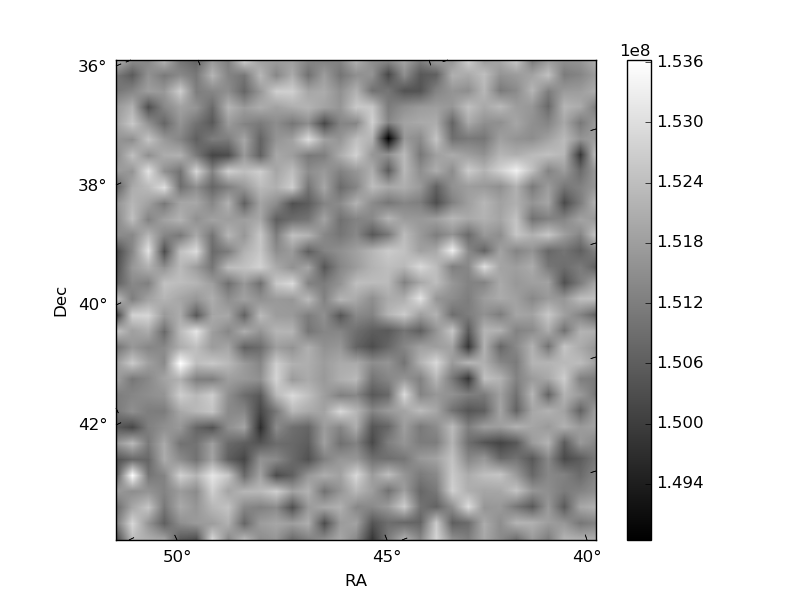
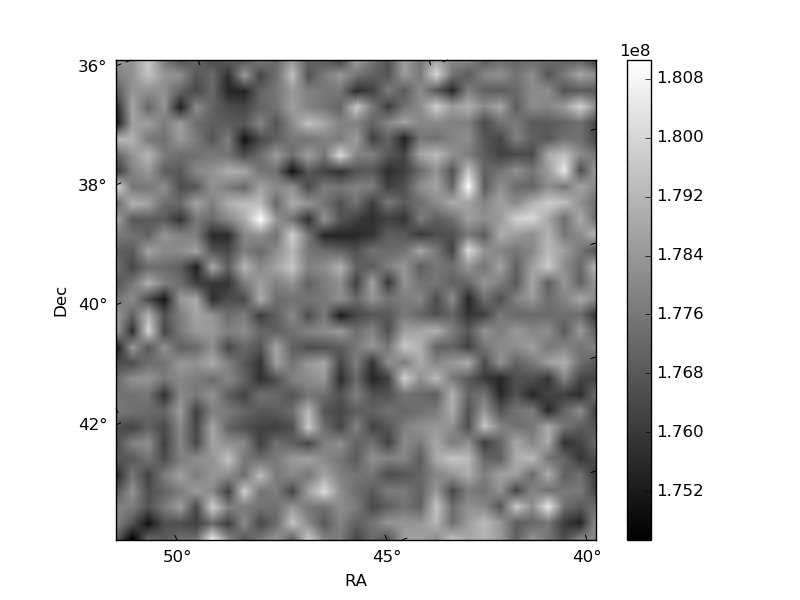
Histogram calculated using DETX and DETY for each event in the final _common_clean file
| Quadrant A | 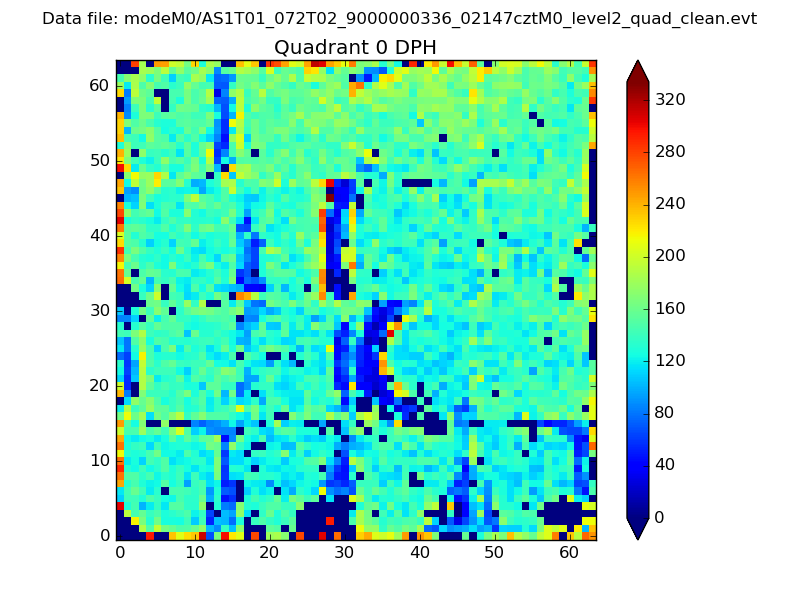 |
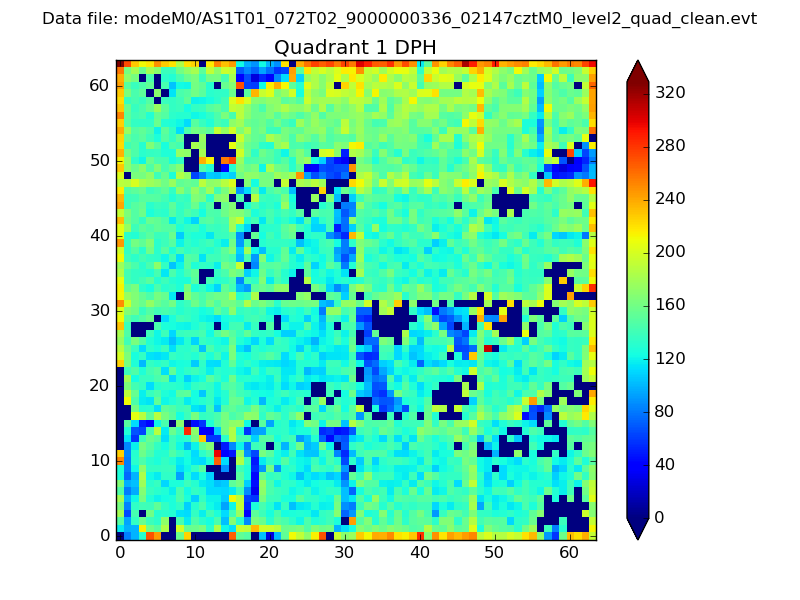 |
Quadrant B |
|---|---|---|---|
| Quadrant D | 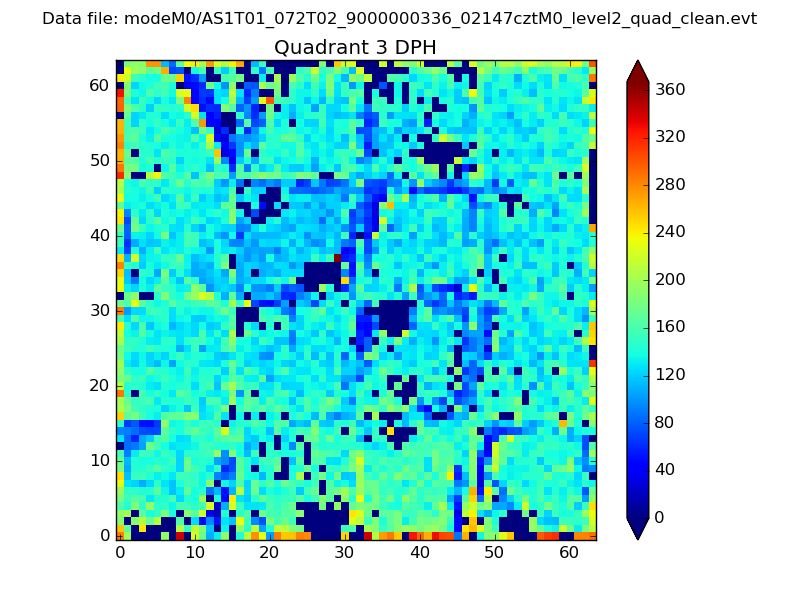 |
 |
Quadrant C |
| Plot type | Count rate plots | Images |
|---|---|---|
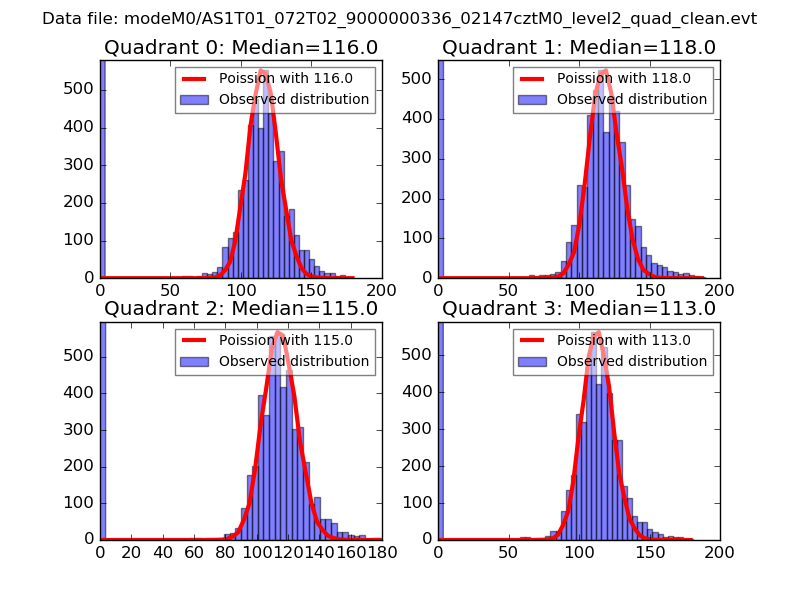
| Comparison with Poisson distribution Blue bars denote a histogram of data divided into 1 sec bins. Red curve is a Poisson curve with rate = median count rate of data. |
 |
 |
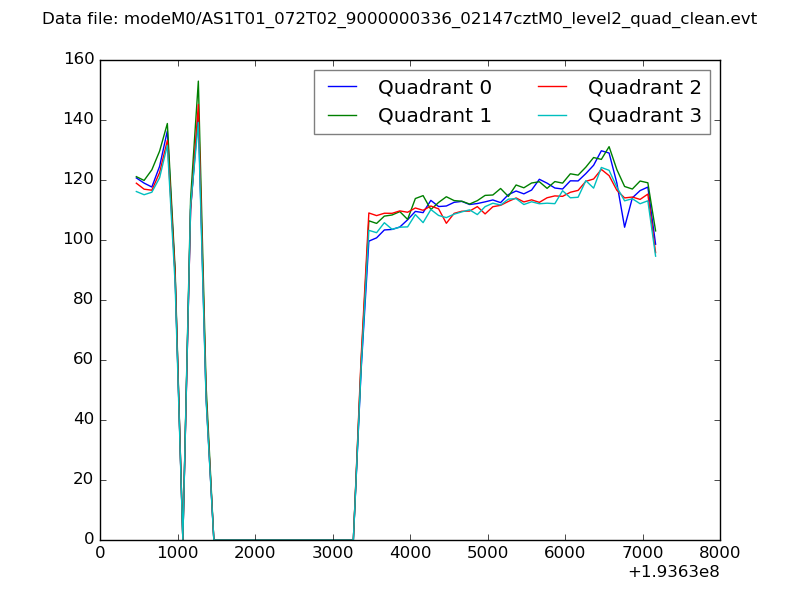
| Quadrant-wise count rates Data is divided into 100 sec bins |
 |
|
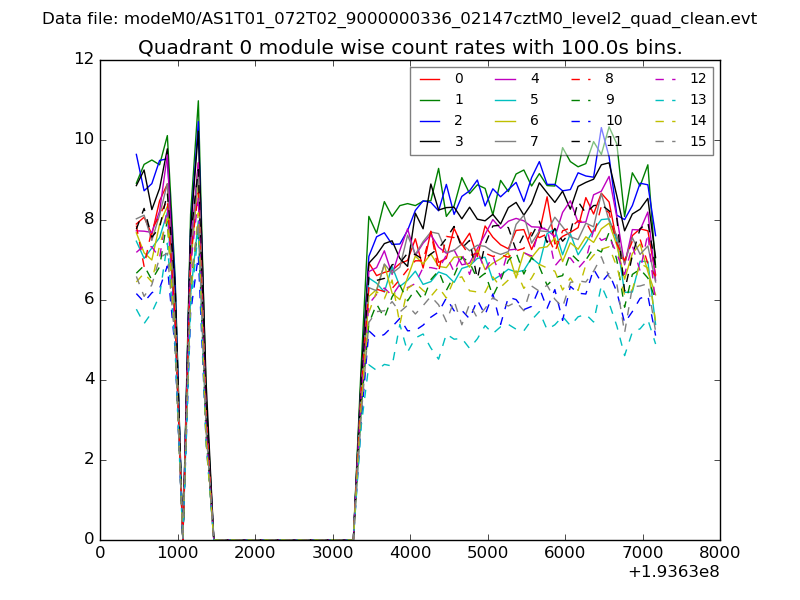
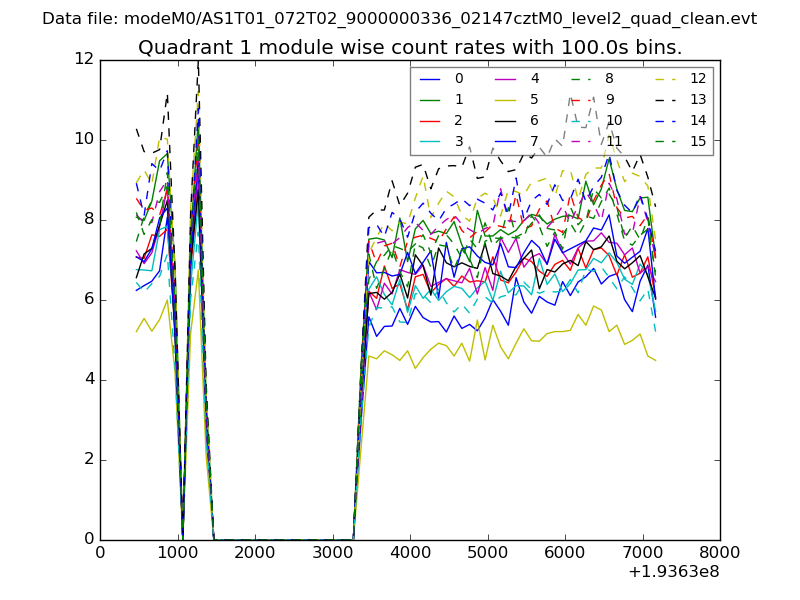
| Module-wise count rates for Quadrant A Data is divided into 100 sec bins |
 |
 |
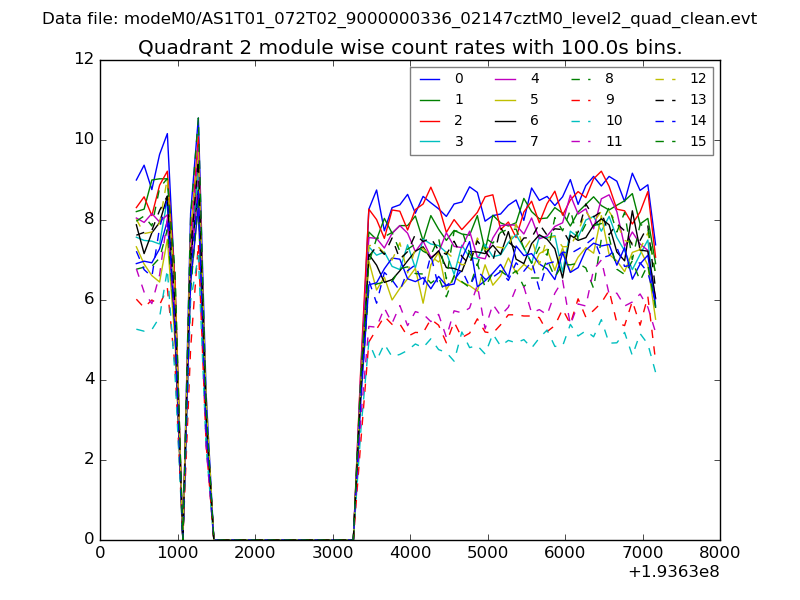
| Module-wise count rates for Quadrant B Data is divided into 100 sec bins |
 |
 |
| Module-wise count rates for Quadrant C Data is divided into 100 sec bins |
 |
 |
| Module-wise count rates for Quadrant D Data is divided into 100 sec bins |
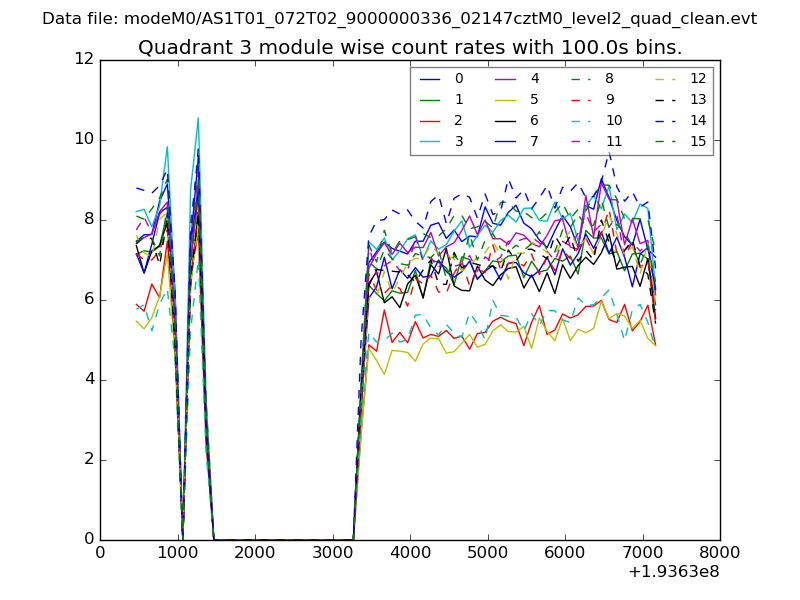 |
 |
| Parameter | Plot |
|---|---|
| CZT HV Monitor | 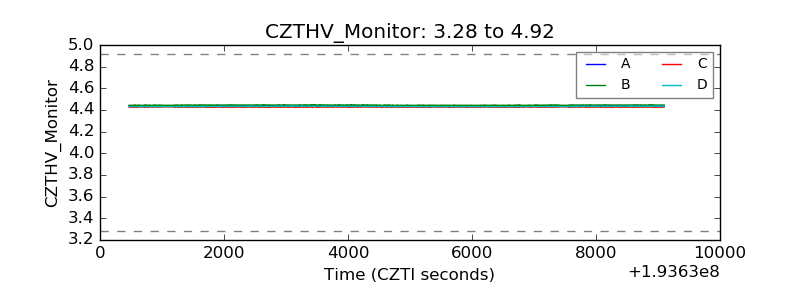 |
| D_VDD | 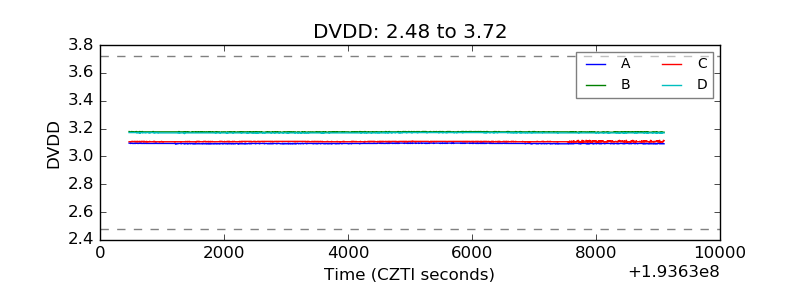 |
| Temperature 1 | 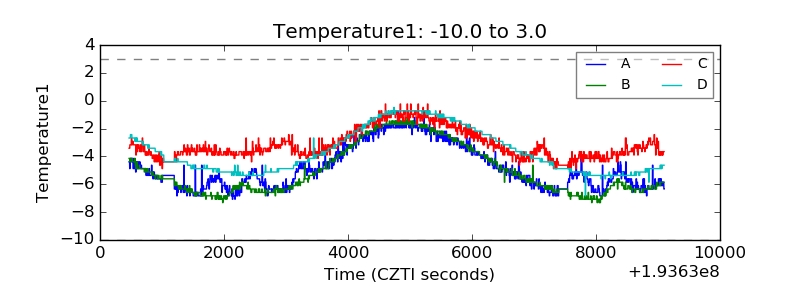 |
| Veto HV Monitor | 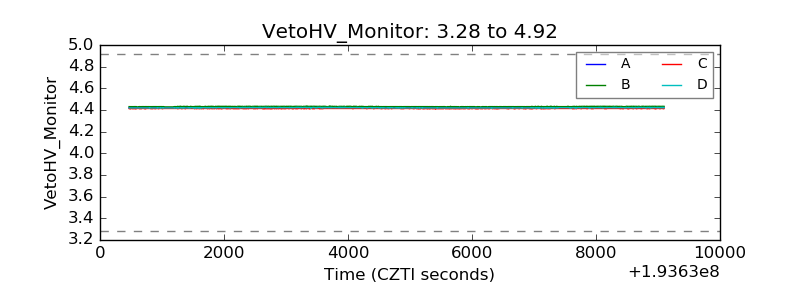 |
| Veto LLD | 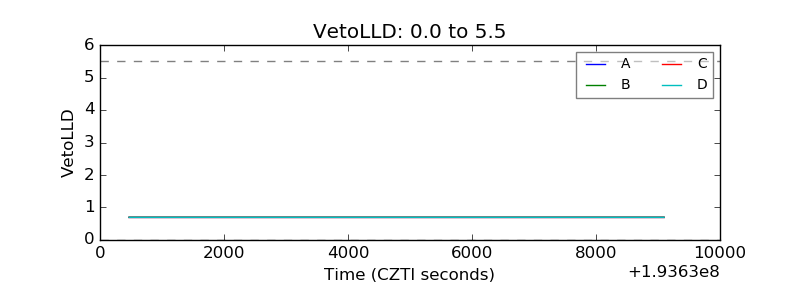 |
| Alpha Counter | 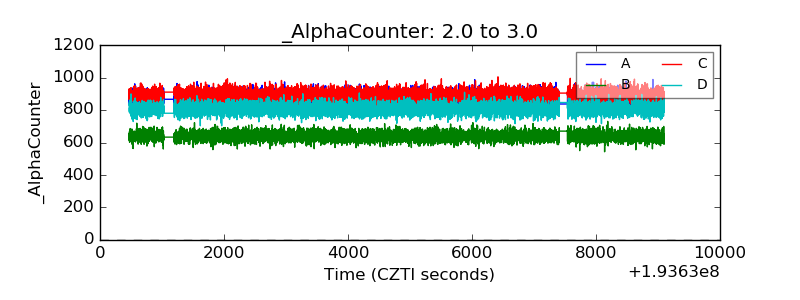 |
| _CPM_Rate | 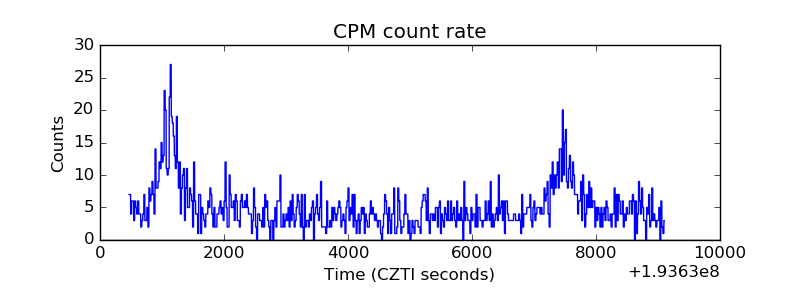 |
| CZT Counter | 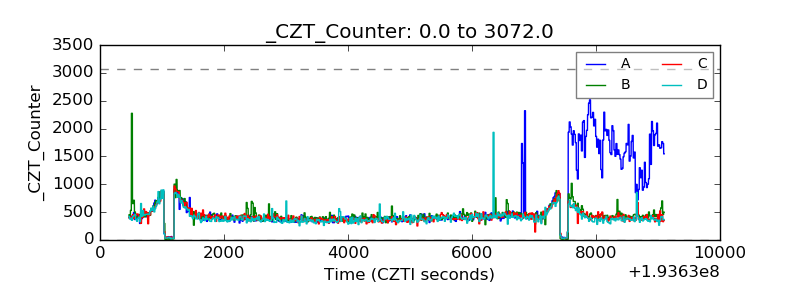 |
| +2.5 Volts monitor |  |
| +5 Volts monitor | 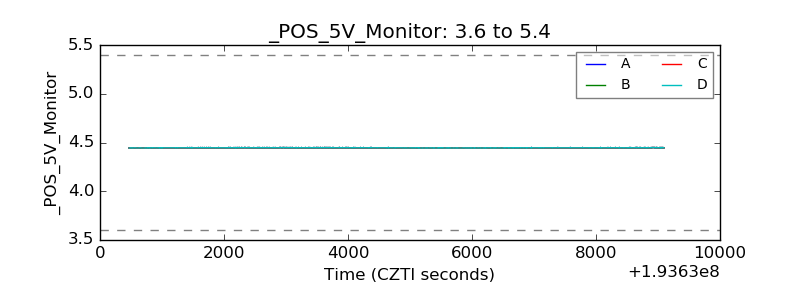 |
| _ROLL_ROT | 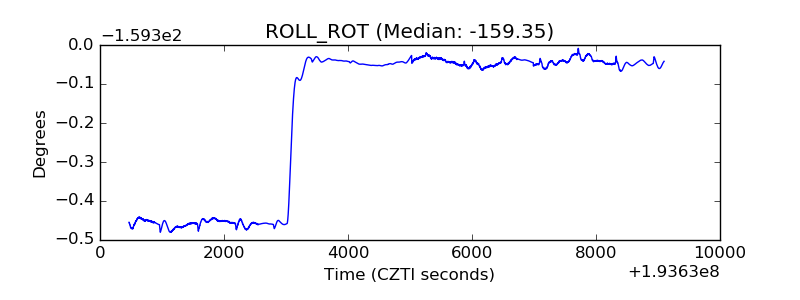 |
| _Roll_DEC | 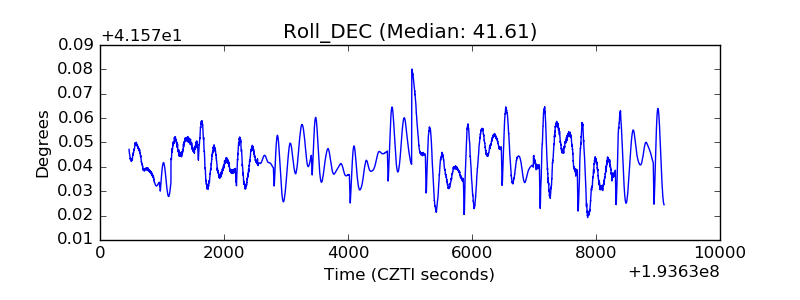 |
| _Roll_RA | 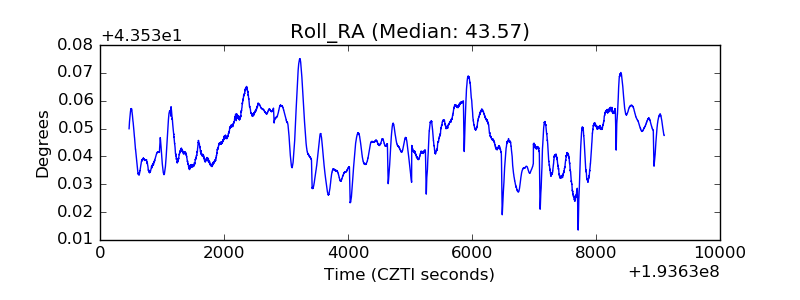 |
| Veto Counter | 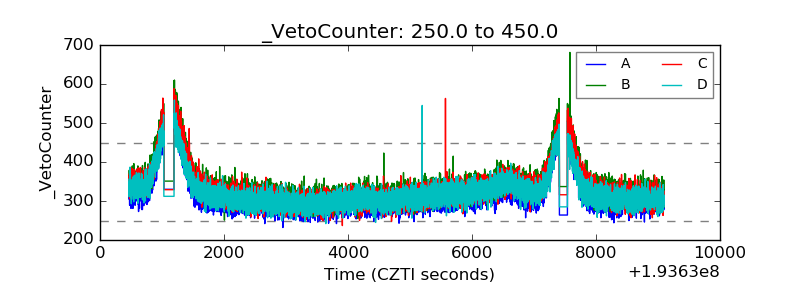 |