| Param | Original file | Final file |
|---|---|---|
| Filename | modeM0/AS1T01_072T02_9000000336_02149cztM0_level2.evt | modeM0/AS1T01_072T02_9000000336_02149cztM0_level2_quad_clean.evt |
| Size (bytes) | 438,972,480 | 85,962,240 |
| Size | 418.6 MB | 82.0 MB |
| Events in quadrant A | 3,094,829 | 524,170 |
| Events in quadrant B | 3,466,731 | 531,455 |
| Events in quadrant C | 3,128,348 | 516,766 |
| Events in quadrant D | 3,094,310 | 509,097 |
| Mode M0 | |||
|---|---|---|---|
| Quadrant | BADHDUFLAG | Total packets | Discarded packets |
| A | 0 | 15231 | 2 |
| B | 0 | 15706 | 6 |
| C | 0 | 15332 | 2 |
| D | 0 | 15403 | 2 |
| Mode SS | |||
|---|---|---|---|
| Quadrant | BADHDUFLAG | Total packets | Discarded packets |
| A | 0 | 152 | 0 |
| B | 0 | 152 | 0 |
| C | 0 | 152 | 0 |
| D | 0 | 152 | 0 |
| Mode M9 | |||
|---|---|---|---|
| Quadrant | BADHDUFLAG | Total packets | Discarded packets |
| A | 0 | 1 | 0 |
| B | 1 | 1 | 0 |
| C | 1 | -1 | -1 |
| D | 1 | -1 | -1 |
| Quadrant | Total seconds | Saturated seconds | Saturation percentage |
|---|---|---|---|
| A | 7488 | 73 | 0.974893% |
| B | 7486 | 82 | 1.095378% |
| C | 7488 | 37 | 0.494124% |
| D | 7488 | 38 | 0.507479% |
Noise dominated data is calculated using 1-second bins in cleaned event files. If a bin has >2000 counts, and if more than 50% of those come from <1% of pixels, then it is considered to be noise-dominated and hence unusable.
| Quadrant | # 1 sec bins | Bins with >0 counts | Bins with >2000 counts | High rate bins dominated by noise | Noise dominated (total time) | Noise dominated (detector-on time) | Marked lightcurve |
|---|---|---|---|---|---|---|---|
| A | 7968 | 7489 | 0 | 0 | 0.00% | 0.00% | 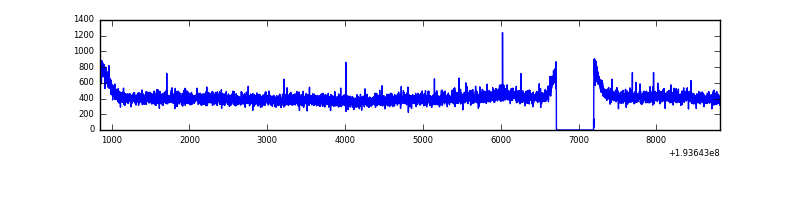 |
| B | 7968 | 7488 | 0 | 0 | 0.00% | 0.00% | 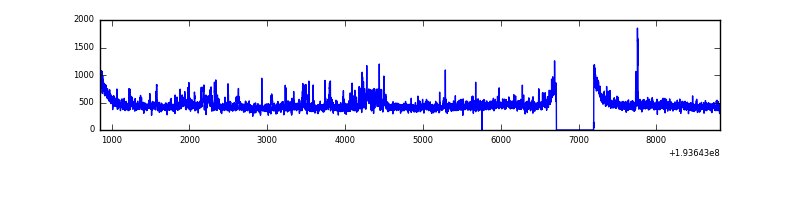 |
| C | 7968 | 7489 | 11 | 11 | 0.14% | 0.15% | 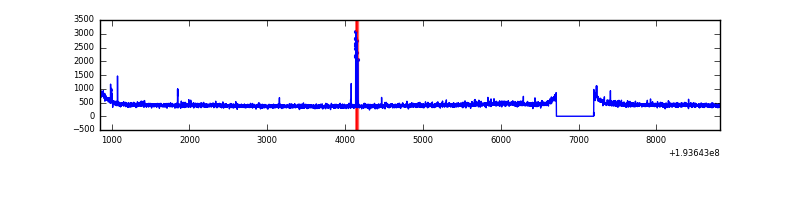 |
| D | 7968 | 7489 | 4 | 4 | 0.05% | 0.05% | 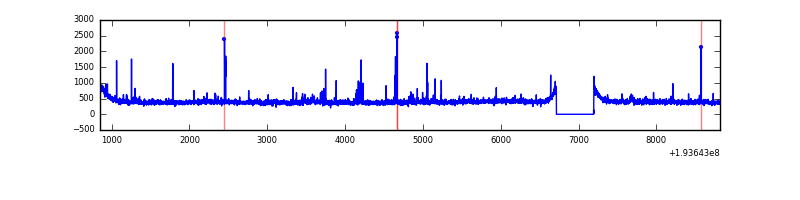 |
Top three noisy pixels from each quadrant. If the there are fewer than three noisy pixels in the level2.evt file, extra rows are filled as -1
| Pixel properties | Quadrant properties | ||||||
|---|---|---|---|---|---|---|---|
| Quadrant | DetID | PixID | Counts | Sigma | Mean | Median | Sigma |
| A | 15 | 175 | 5629 | 30.45 | 804 | 791 | 158.9 |
| A | 0 | 1 | 5019 | 26.61 | 804 | 791 | 158.9 |
| A | 14 | 238 | 2960 | 13.65 | 804 | 791 | 158.9 |
| B | 5 | 68 | 177884 | 1149.58 | 829 | 811 | 154.0 |
| B | 0 | 234 | 69980 | 449.05 | 829 | 811 | 154.0 |
| B | 4 | 200 | 24811 | 155.81 | 829 | 811 | 154.0 |
| C | 10 | 34 | 34103 | 192.33 | 783 | 788 | 173.2 |
| C | 12 | 4 | 14900 | 81.47 | 783 | 788 | 173.2 |
| C | 10 | 82 | 4661 | 22.36 | 783 | 788 | 173.2 |
| D | 6 | 112 | 52361 | 293.22 | 776 | 759 | 176.0 |
| D | 13 | 53 | 41250 | 230.09 | 776 | 759 | 176.0 |
| D | 13 | 88 | 25552 | 140.88 | 776 | 759 | 176.0 |
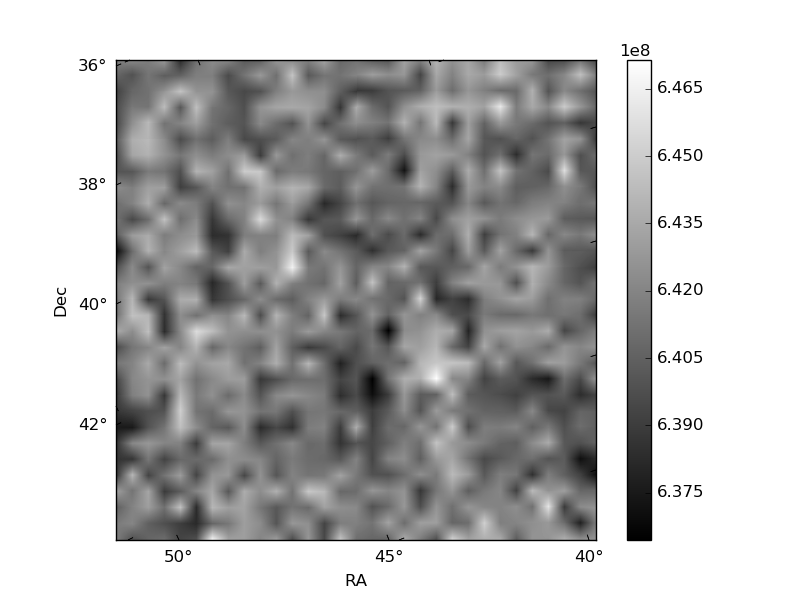
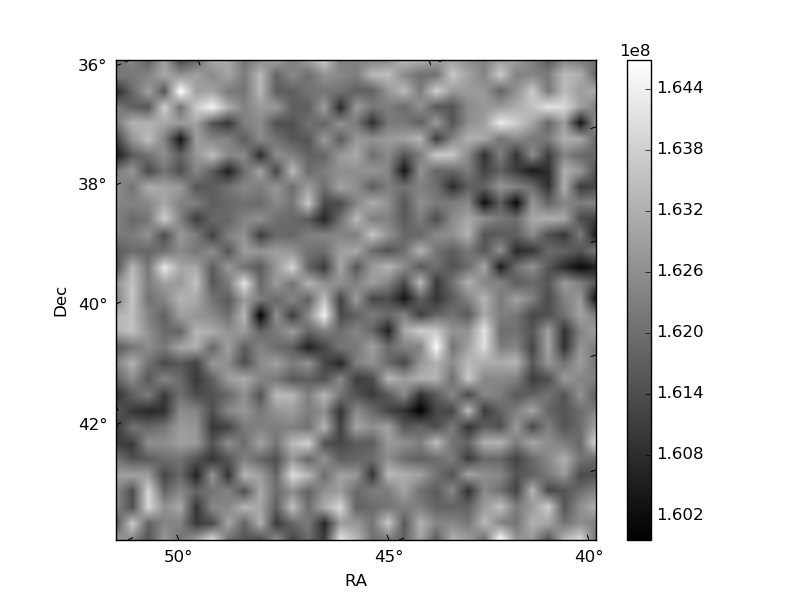
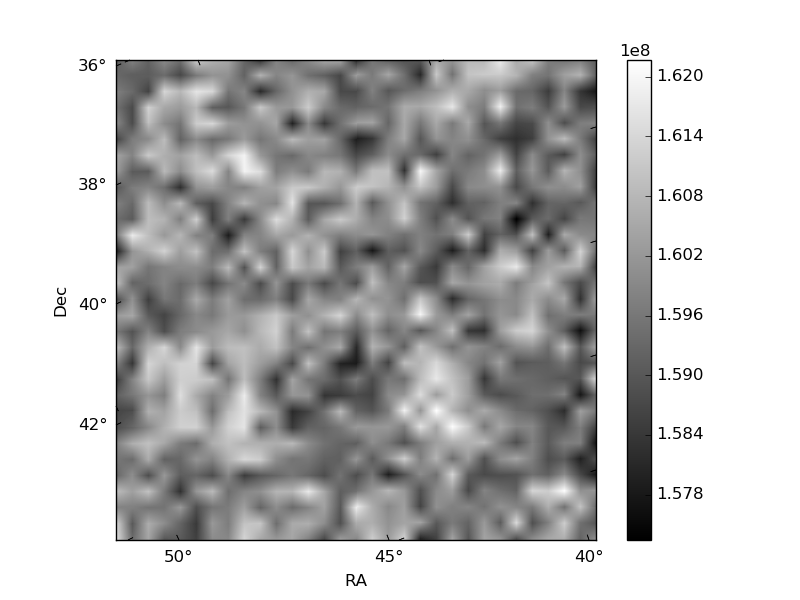
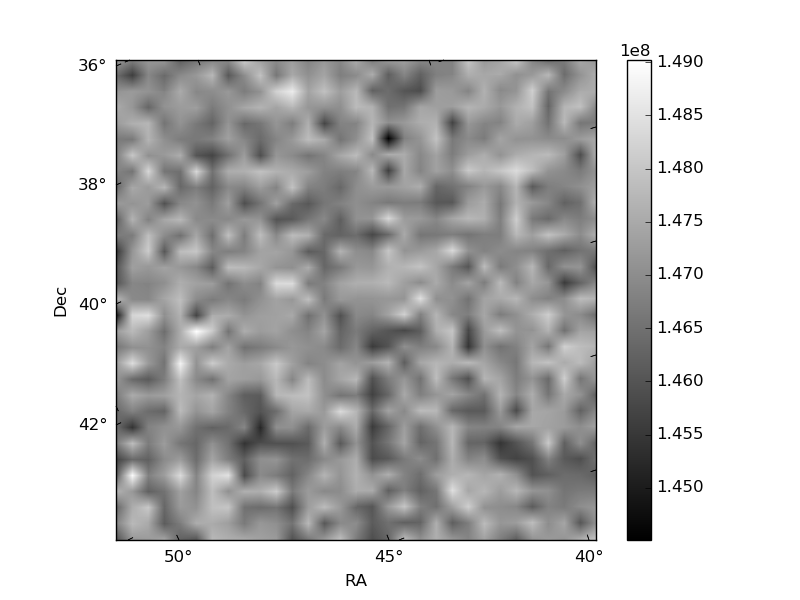
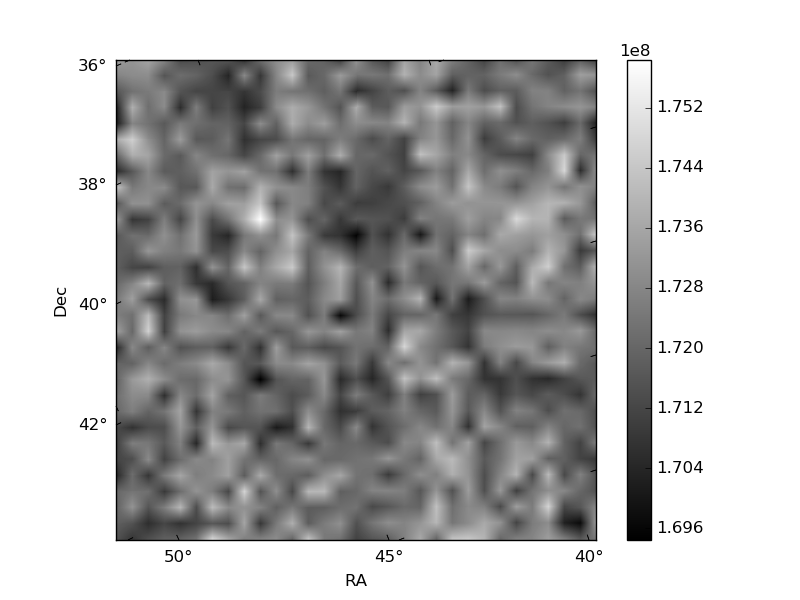
Histogram calculated using DETX and DETY for each event in the final _common_clean file
| Quadrant A | 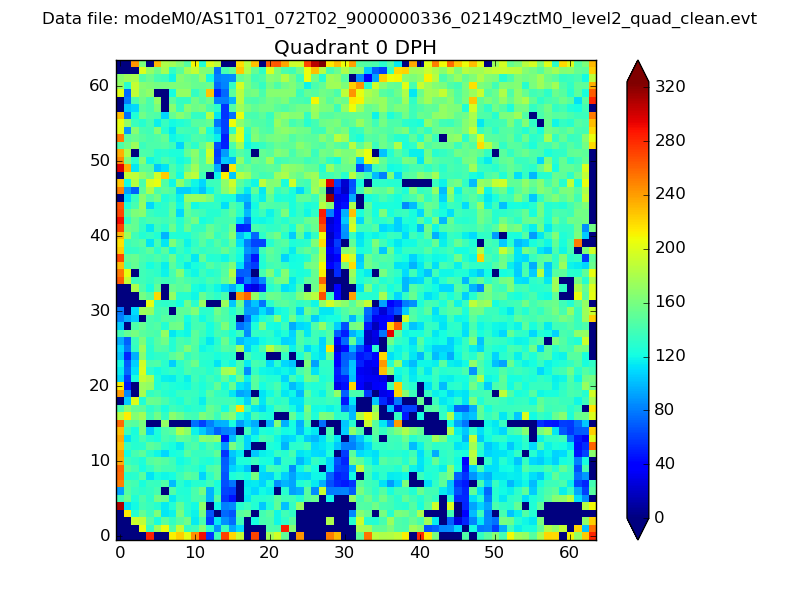 |
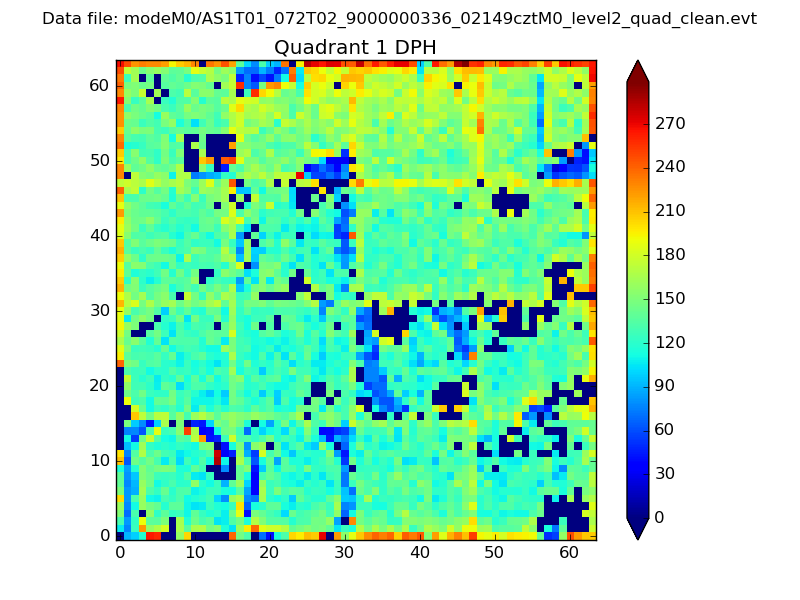 |
Quadrant B |
|---|---|---|---|
| Quadrant D | 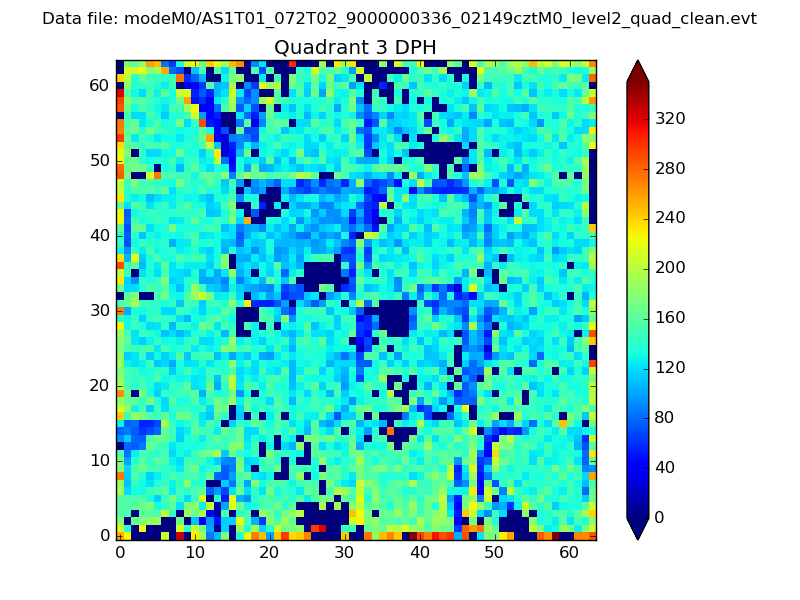 |
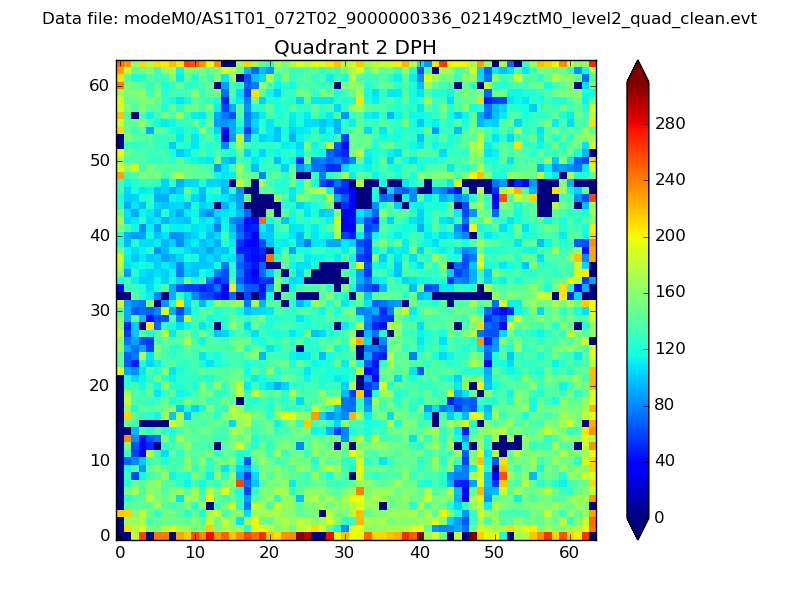 |
Quadrant C |
| Plot type | Count rate plots | Images |
|---|---|---|
| Comparison with Poisson distribution Blue bars denote a histogram of data divided into 1 sec bins. Red curve is a Poisson curve with rate = median count rate of data. |
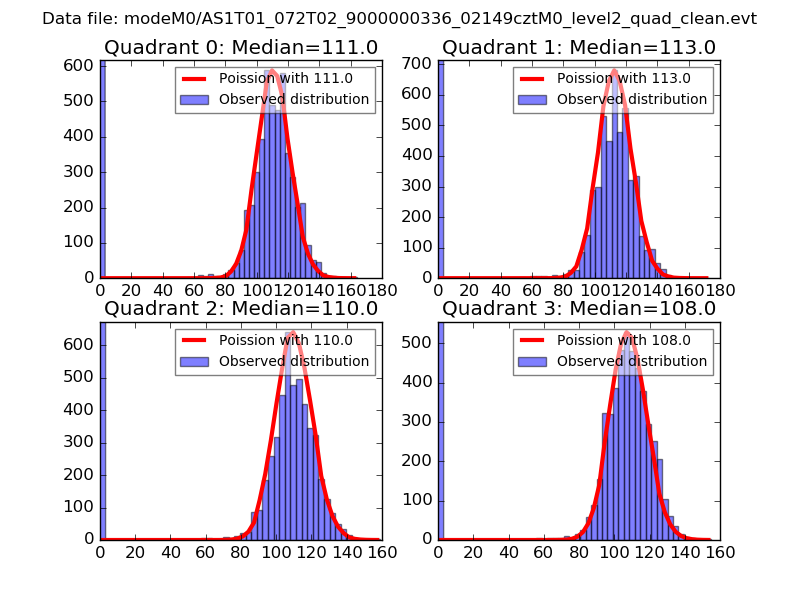 |
 |
| Quadrant-wise count rates Data is divided into 100 sec bins |
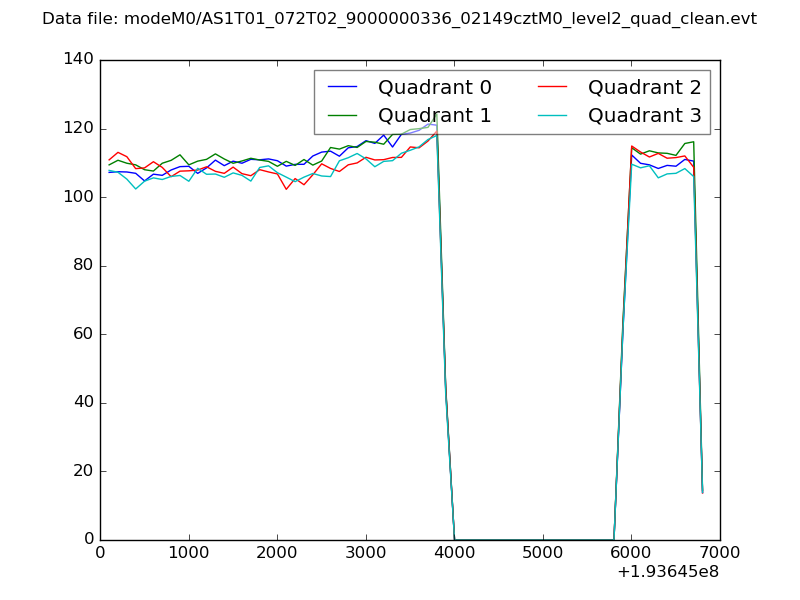 |
|
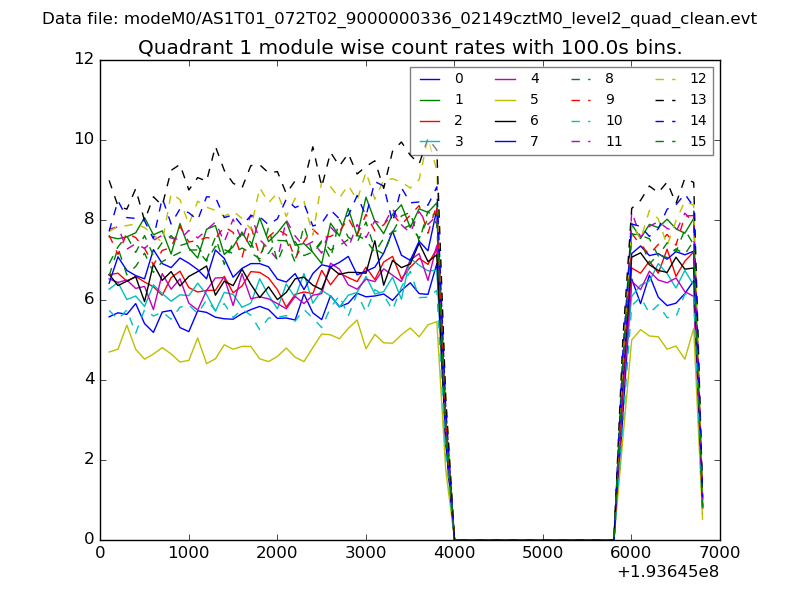
| Module-wise count rates for Quadrant A Data is divided into 100 sec bins |
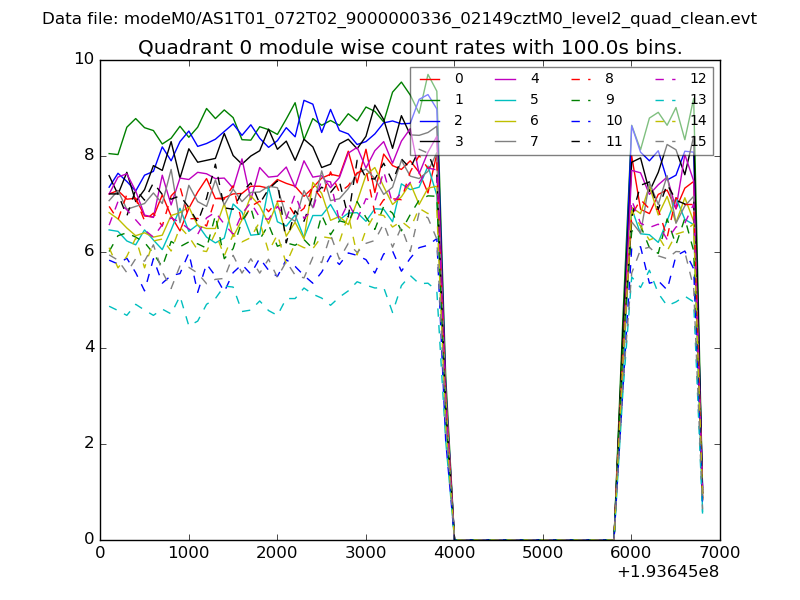 |
 |
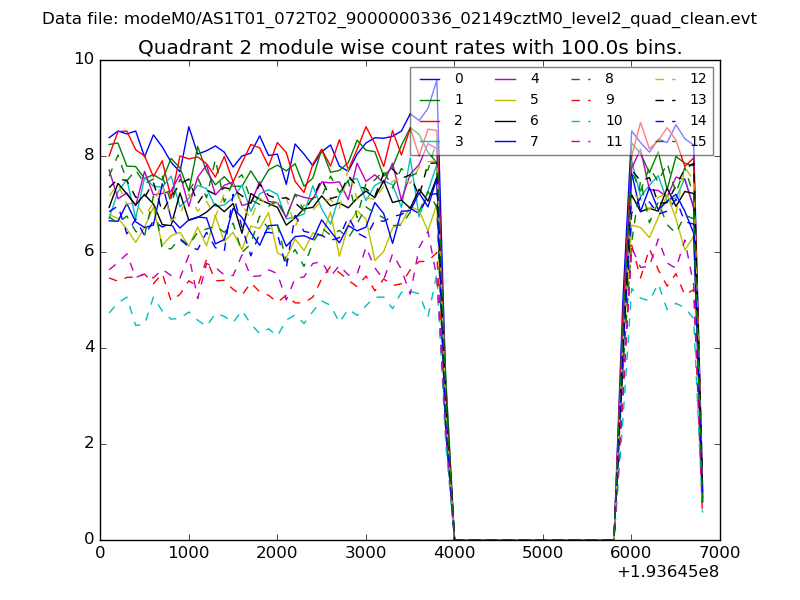
| Module-wise count rates for Quadrant B Data is divided into 100 sec bins |
 |
 |
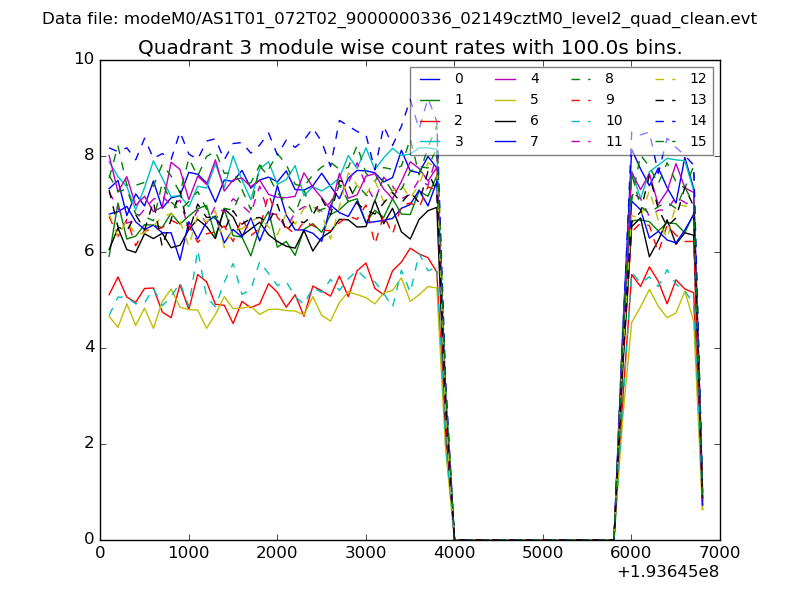
| Module-wise count rates for Quadrant C Data is divided into 100 sec bins |
 |
 |
| Module-wise count rates for Quadrant D Data is divided into 100 sec bins |
 |
 |
| Parameter | Plot |
|---|---|
| CZT HV Monitor | 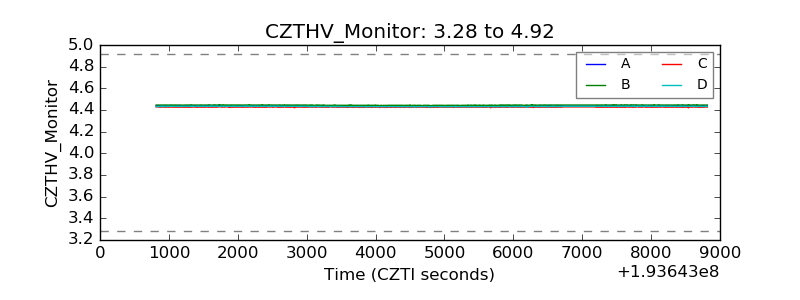 |
| D_VDD | 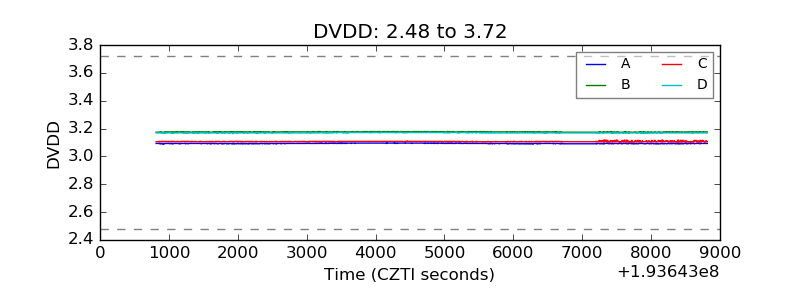 |
| Temperature 1 | 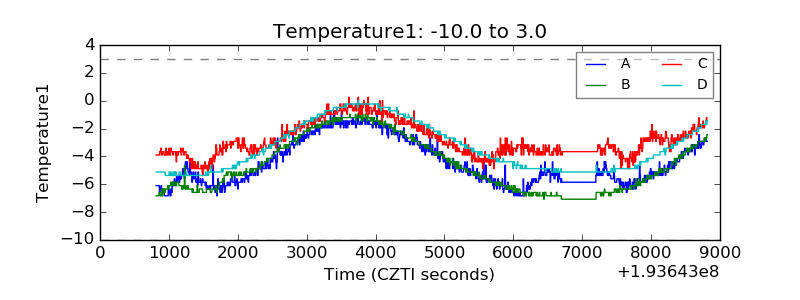 |
| Veto HV Monitor | 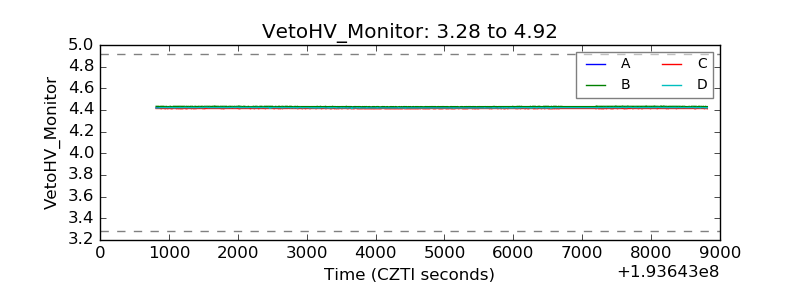 |
| Veto LLD | 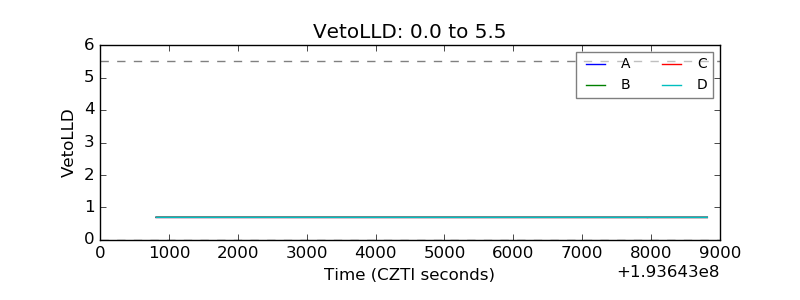 |
| Alpha Counter | 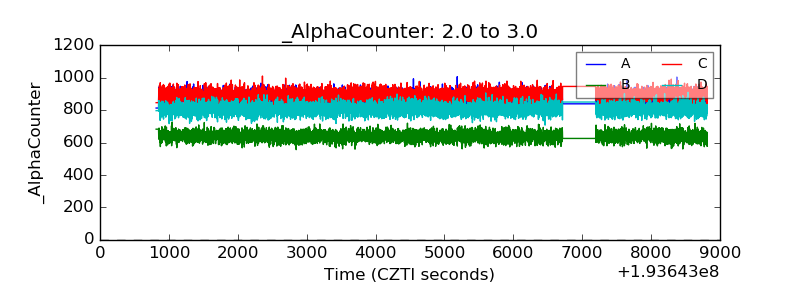 |
| _CPM_Rate | 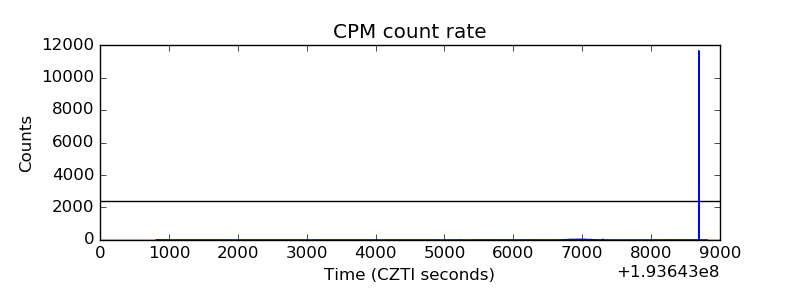 |
| CZT Counter | 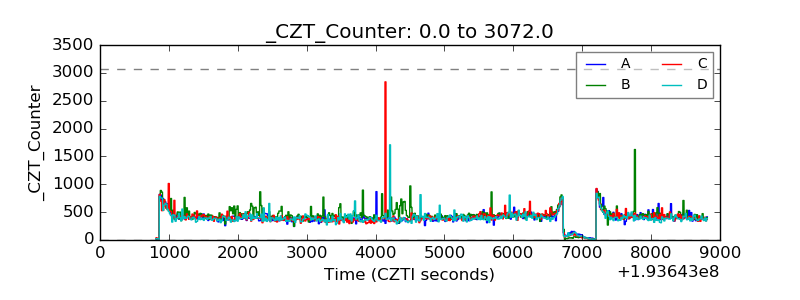 |
| +2.5 Volts monitor | 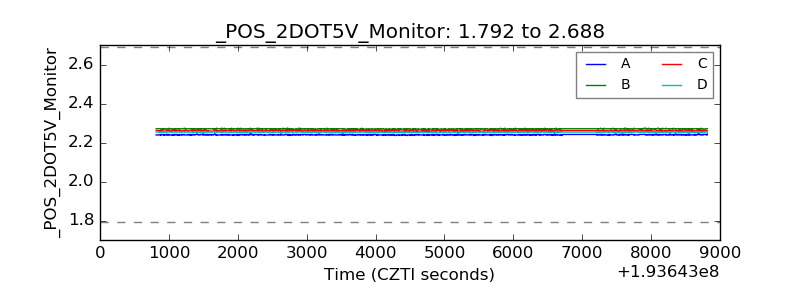 |
| +5 Volts monitor | 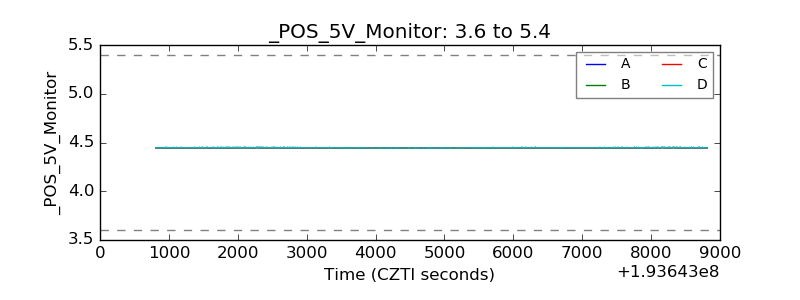 |
| _ROLL_ROT | 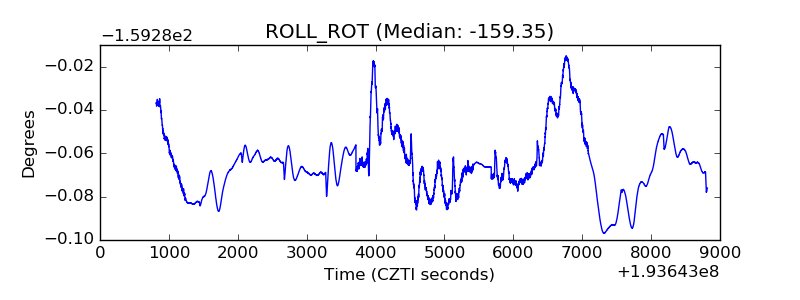 |
| _Roll_DEC | 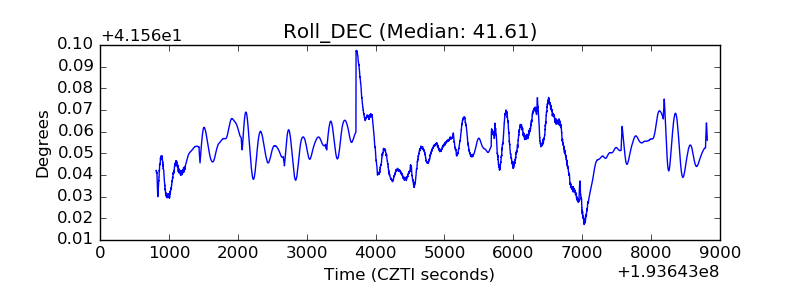 |
| _Roll_RA | 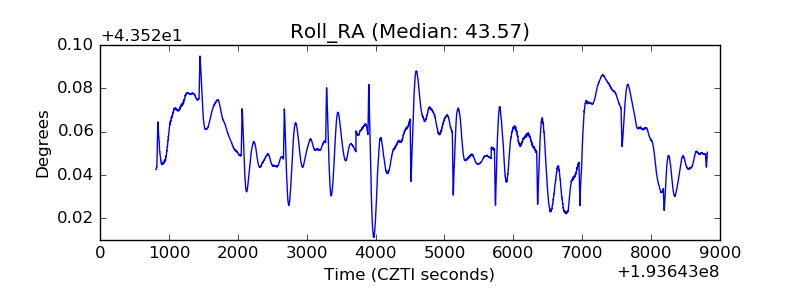 |
| Veto Counter | 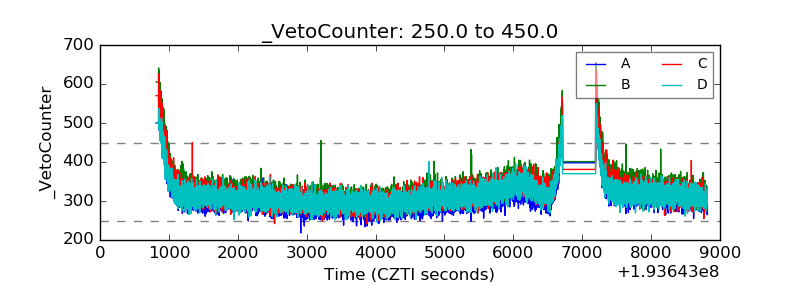 |