| Param | Original file | Final file |
|---|---|---|
| Filename | modeM0/AS1T01_072T02_9000000336_02150cztM0_level2.evt | modeM0/AS1T01_072T02_9000000336_02150cztM0_level2_quad_clean.evt |
| Size (bytes) | 393,543,360 | 90,178,560 |
| Size | 375.3 MB | 86.0 MB |
| Events in quadrant A | 2,799,112 | 568,001 |
| Events in quadrant B | 2,995,360 | 578,807 |
| Events in quadrant C | 2,908,952 | 559,219 |
| Events in quadrant D | 2,750,203 | 549,259 |
| Mode M0 | |||
|---|---|---|---|
| Quadrant | BADHDUFLAG | Total packets | Discarded packets |
| A | 0 | 13789 | 1 |
| B | 0 | 14004 | 1 |
| C | 0 | 14051 | 1 |
| D | 0 | 13948 | 1 |
| Mode SS | |||
|---|---|---|---|
| Quadrant | BADHDUFLAG | Total packets | Discarded packets |
| A | 0 | 138 | 0 |
| B | 0 | 138 | 0 |
| C | 0 | 138 | 0 |
| D | 0 | 138 | 0 |
| Mode M9 | |||
|---|---|---|---|
| Quadrant | BADHDUFLAG | Total packets | Discarded packets |
| A | 0 | 1 | 0 |
| B | 1 | 1 | 0 |
| C | 1 | -1 | -1 |
| D | 1 | -1 | -1 |
| Quadrant | Total seconds | Saturated seconds | Saturation percentage |
|---|---|---|---|
| A | 6819 | 52 | 0.762575% |
| B | 6819 | 41 | 0.601261% |
| C | 6819 | 23 | 0.337293% |
| D | 6819 | 35 | 0.513272% |
Noise dominated data is calculated using 1-second bins in cleaned event files. If a bin has >2000 counts, and if more than 50% of those come from <1% of pixels, then it is considered to be noise-dominated and hence unusable.
| Quadrant | # 1 sec bins | Bins with >0 counts | Bins with >2000 counts | High rate bins dominated by noise | Noise dominated (total time) | Noise dominated (detector-on time) | Marked lightcurve |
|---|---|---|---|---|---|---|---|
| A | 7459 | 6820 | 0 | 0 | 0.00% | 0.00% | 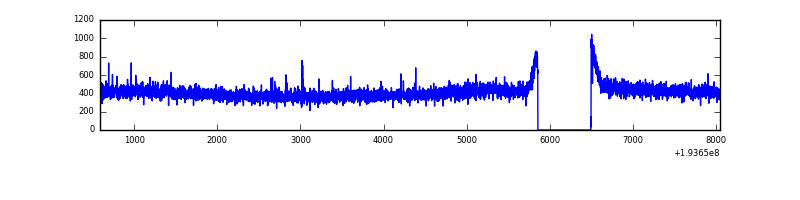 |
| B | 7459 | 6820 | 1 | 1 | 0.01% | 0.01% | 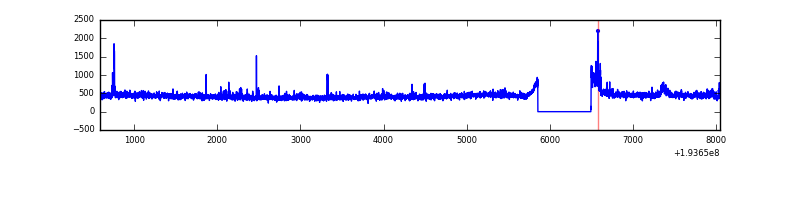 |
| C | 7459 | 6820 | 7 | 7 | 0.09% | 0.10% | 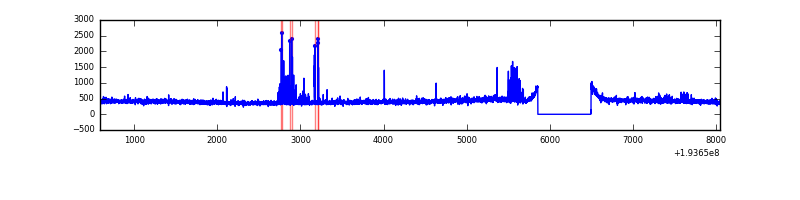 |
| D | 7459 | 6820 | 5 | 5 | 0.07% | 0.07% | 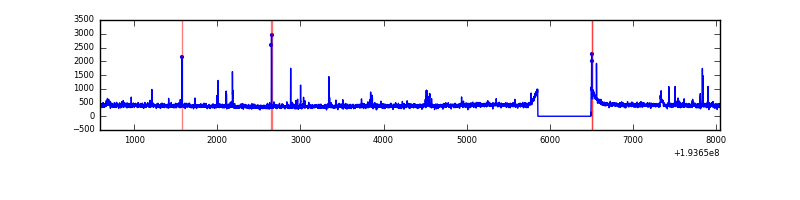 |
Top three noisy pixels from each quadrant. If the there are fewer than three noisy pixels in the level2.evt file, extra rows are filled as -1
| Pixel properties | Quadrant properties | ||||||
|---|---|---|---|---|---|---|---|
| Quadrant | DetID | PixID | Counts | Sigma | Mean | Median | Sigma |
| A | 0 | 1 | 8214 | 52.02 | 726 | 714 | 144.2 |
| A | 15 | 175 | 3678 | 20.56 | 726 | 714 | 144.2 |
| A | 14 | 188 | 1724 | 7.01 | 726 | 714 | 144.2 |
| B | 5 | 68 | 77804 | 561.46 | 746 | 733 | 137.3 |
| B | 0 | 234 | 20455 | 143.67 | 746 | 733 | 137.3 |
| B | 4 | 185 | 20333 | 142.79 | 746 | 733 | 137.3 |
| C | 9 | 85 | 140371 | 894.45 | 702 | 704 | 156.1 |
| C | 14 | 223 | 6358 | 36.21 | 702 | 704 | 156.1 |
| C | 10 | 65 | 4569 | 24.75 | 702 | 704 | 156.1 |
| D | 9 | 64 | 32377 | 198.86 | 700 | 685 | 159.4 |
| D | 10 | 254 | 19257 | 116.54 | 700 | 685 | 159.4 |
| D | 5 | 233 | 17334 | 104.47 | 700 | 685 | 159.4 |
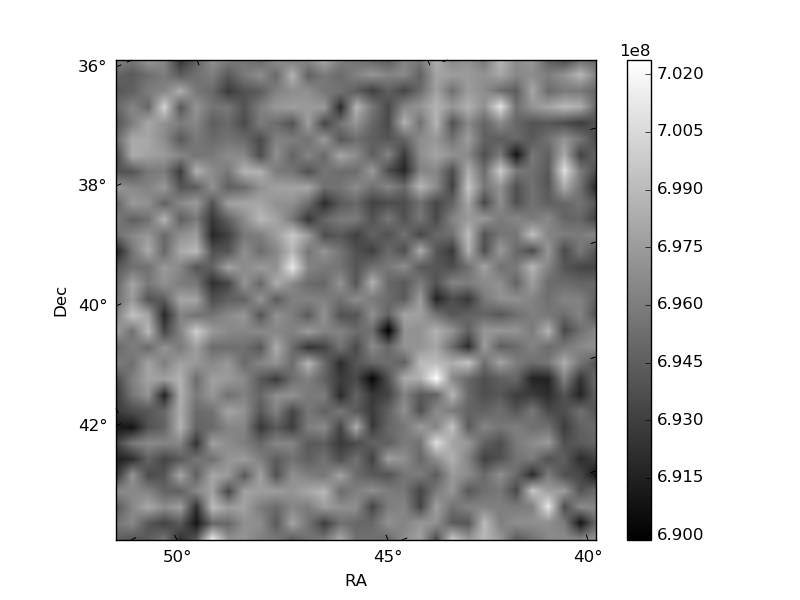
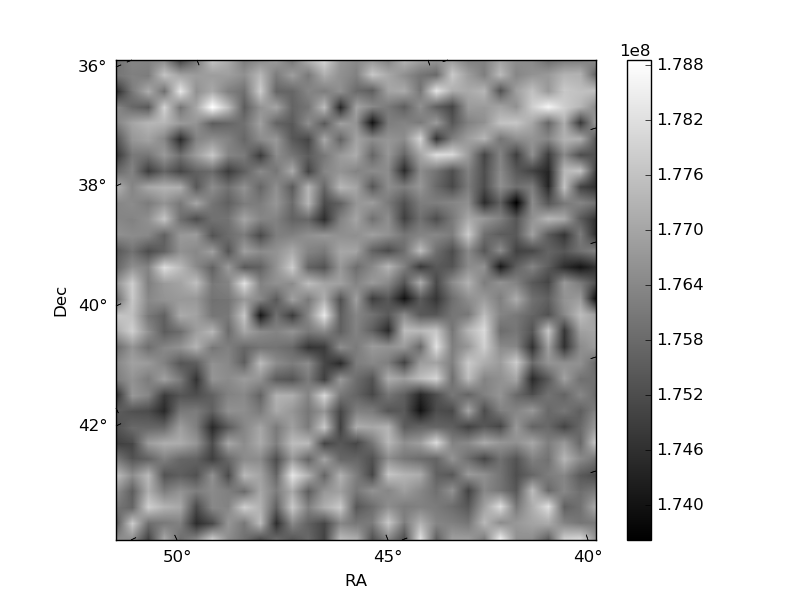
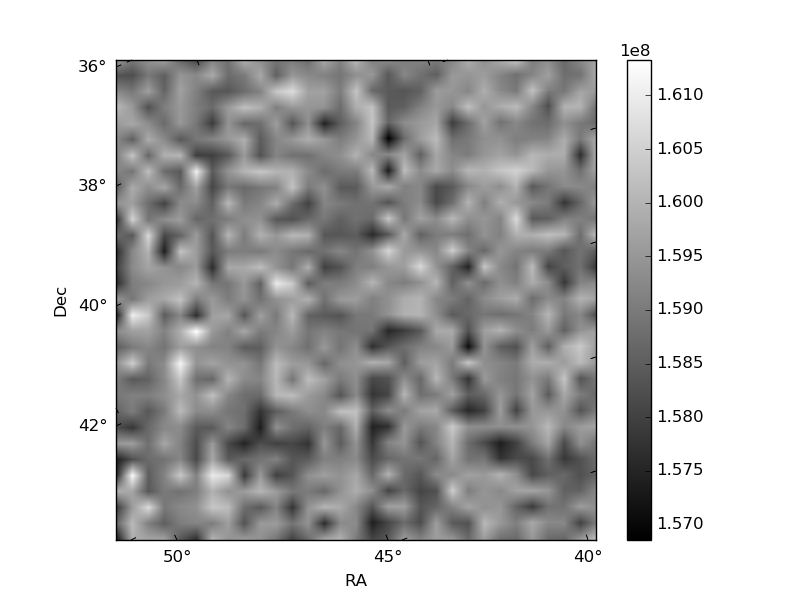
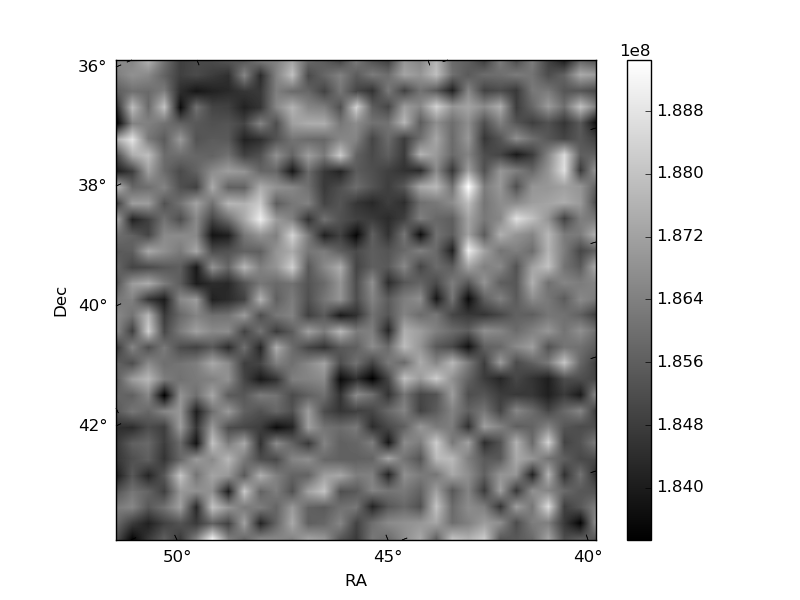
Histogram calculated using DETX and DETY for each event in the final _common_clean file
| Quadrant A | 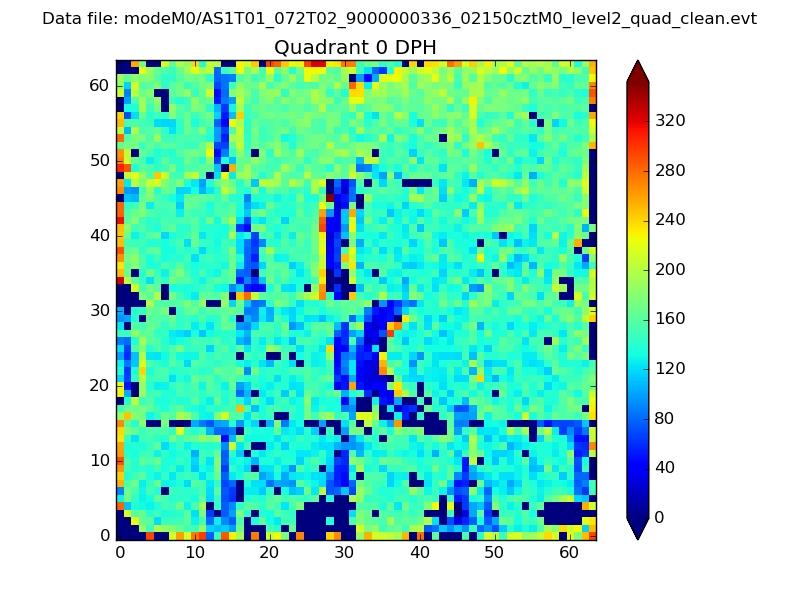 |
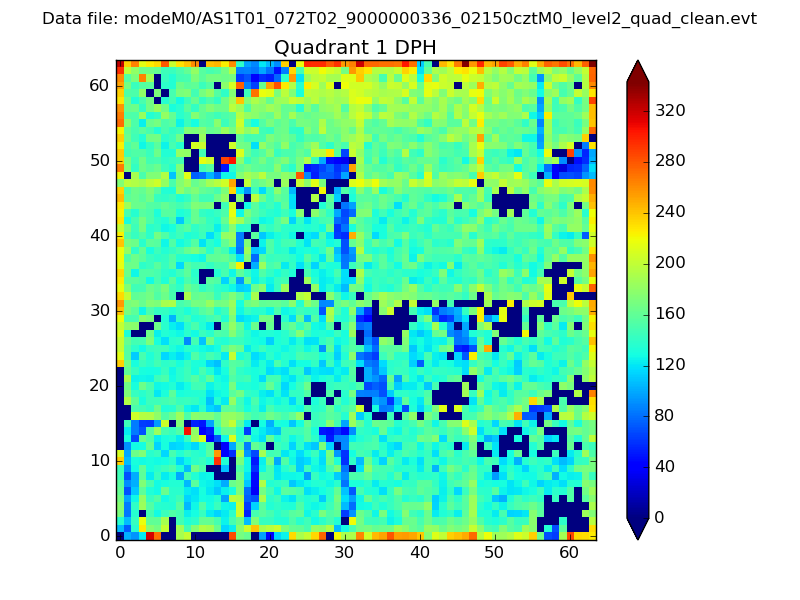 |
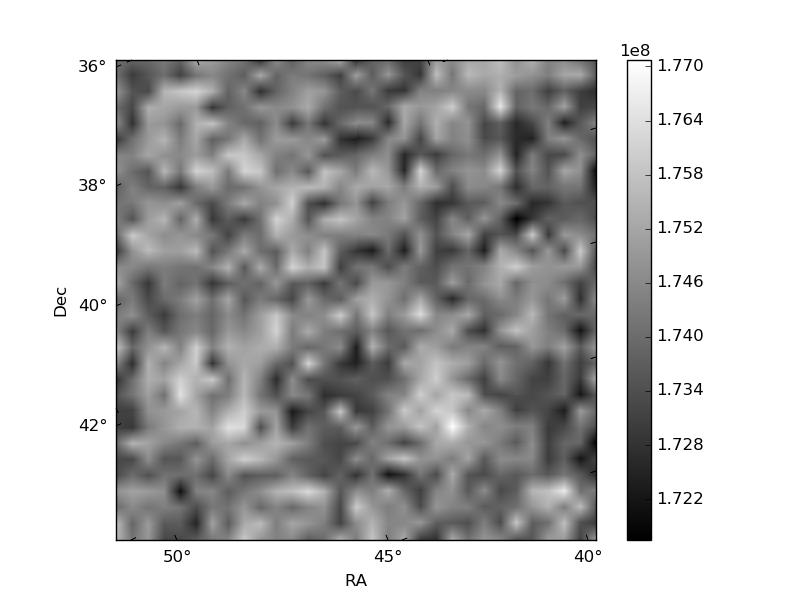
Quadrant B |
|---|---|---|---|
| Quadrant D | 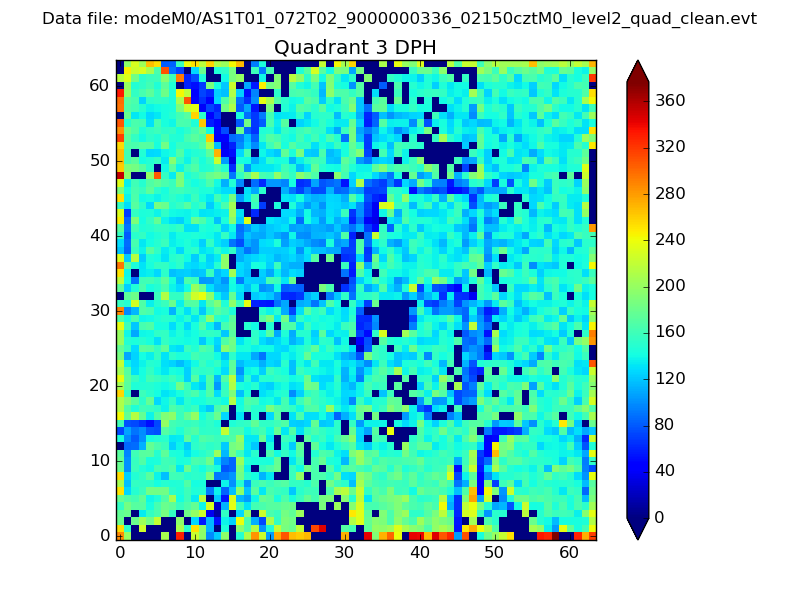 |
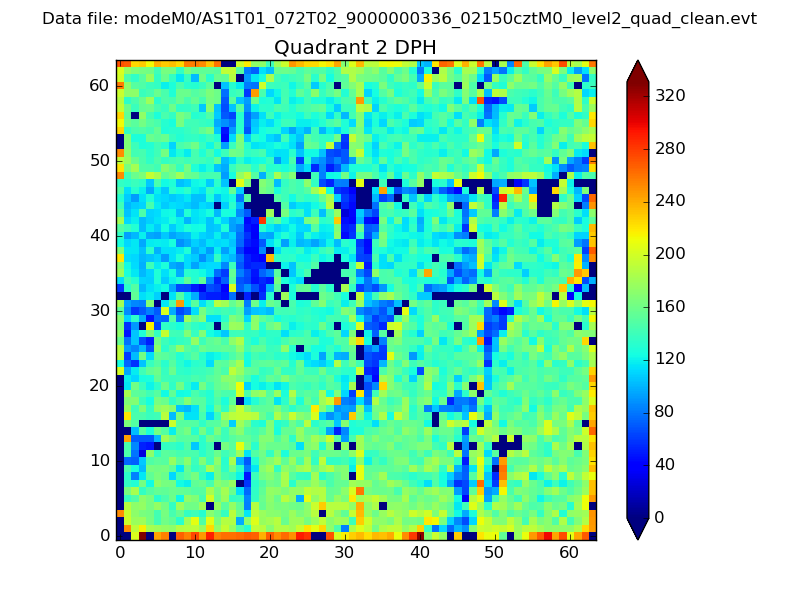 |
Quadrant C |
| Plot type | Count rate plots | Images |
|---|---|---|
| Comparison with Poisson distribution Blue bars denote a histogram of data divided into 1 sec bins. Red curve is a Poisson curve with rate = median count rate of data. |
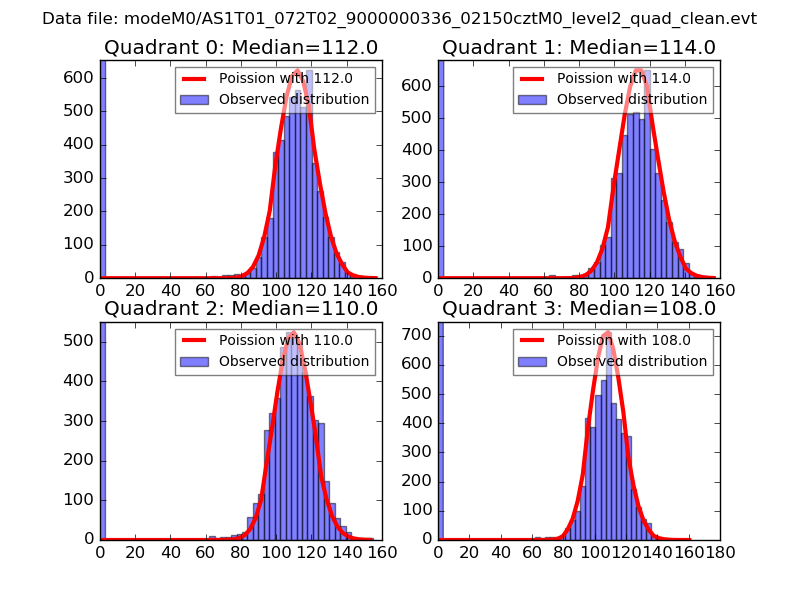 |
 |
| Quadrant-wise count rates Data is divided into 100 sec bins |
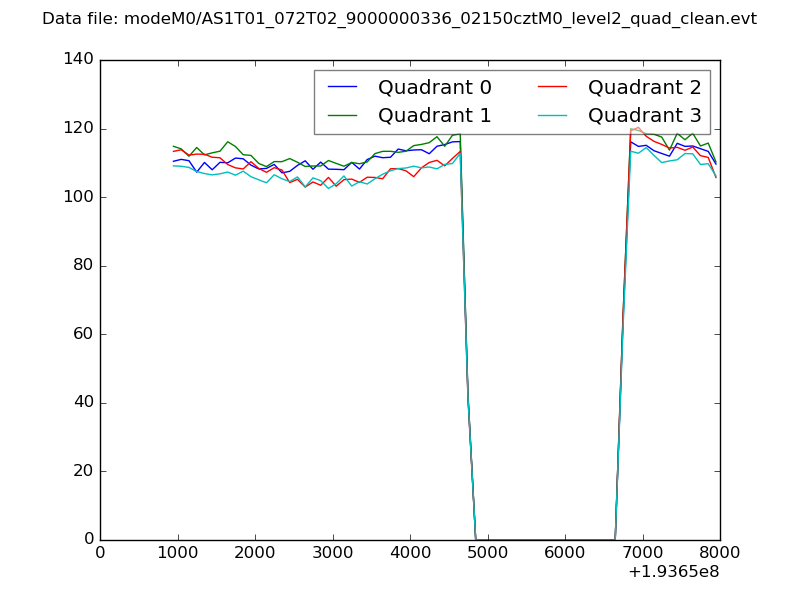 |
|
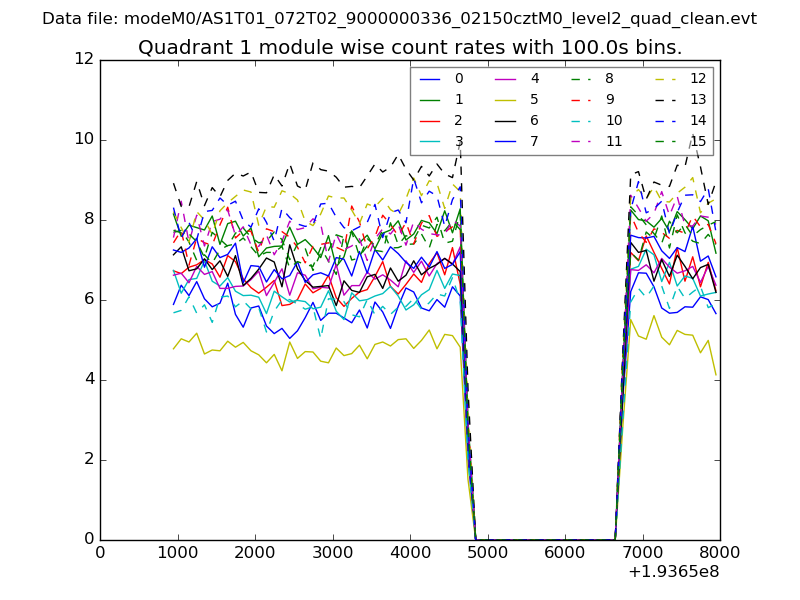
| Module-wise count rates for Quadrant A Data is divided into 100 sec bins |
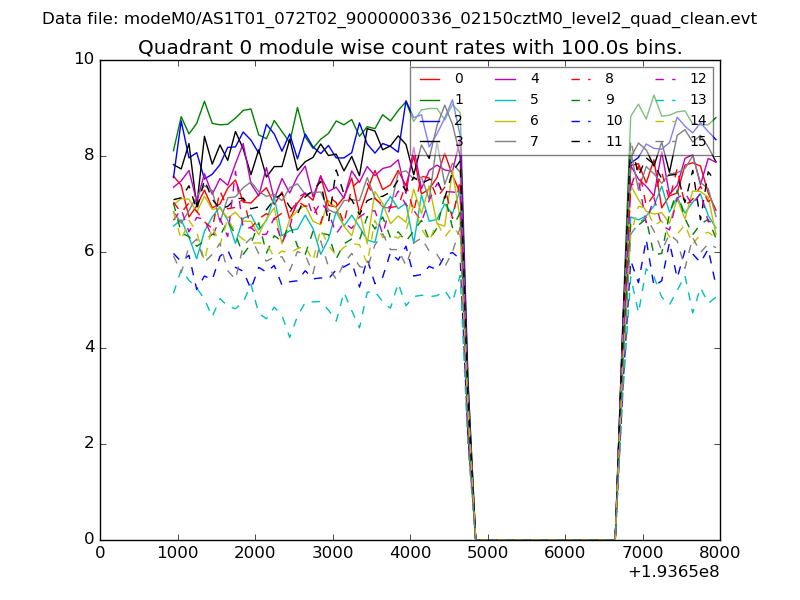 |
 |
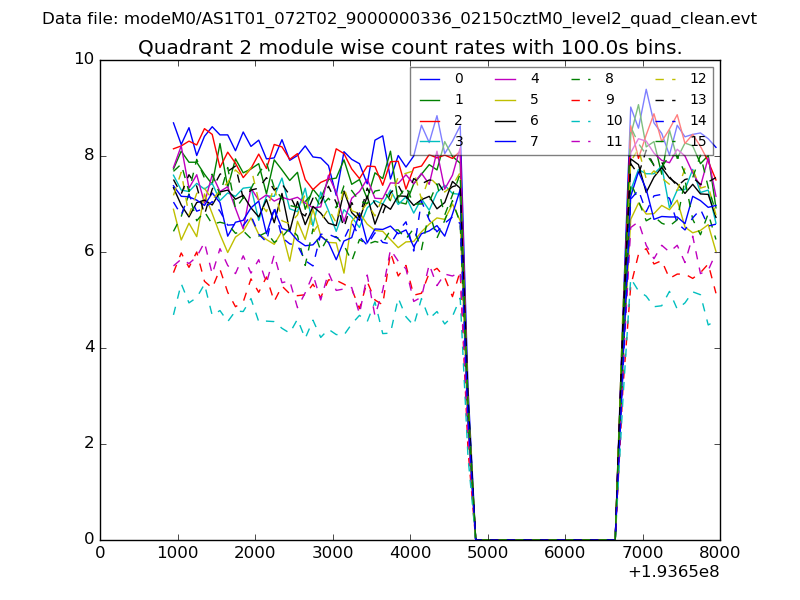
| Module-wise count rates for Quadrant B Data is divided into 100 sec bins |
 |
 |
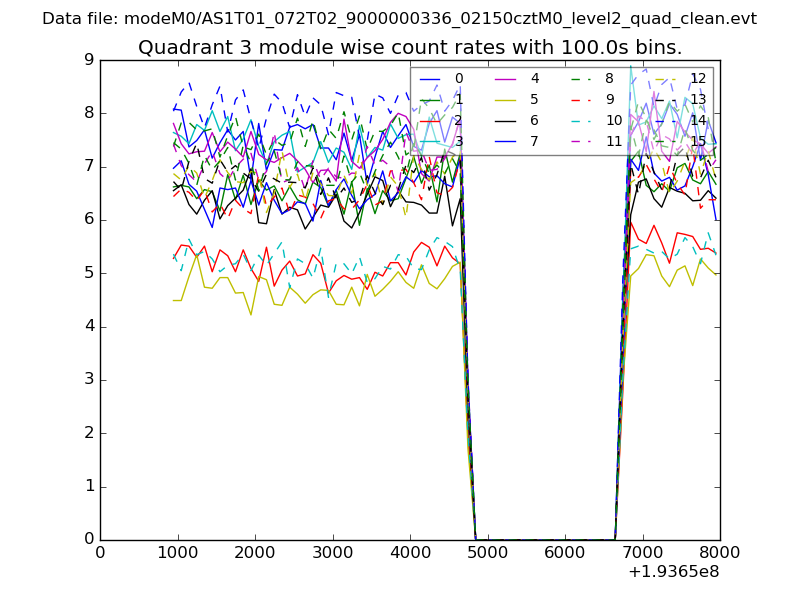
| Module-wise count rates for Quadrant C Data is divided into 100 sec bins |
 |
 |
| Module-wise count rates for Quadrant D Data is divided into 100 sec bins |
 |
 |
| Parameter | Plot |
|---|---|
| CZT HV Monitor | 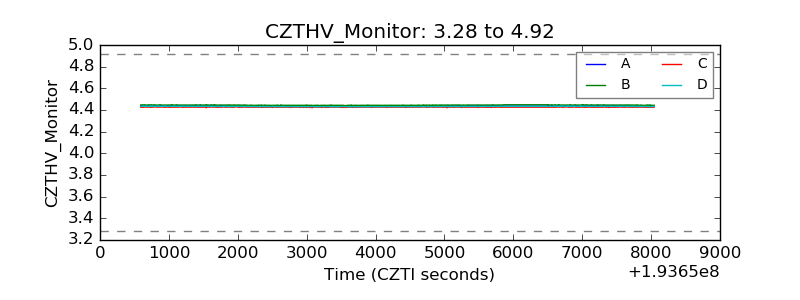 |
| D_VDD | 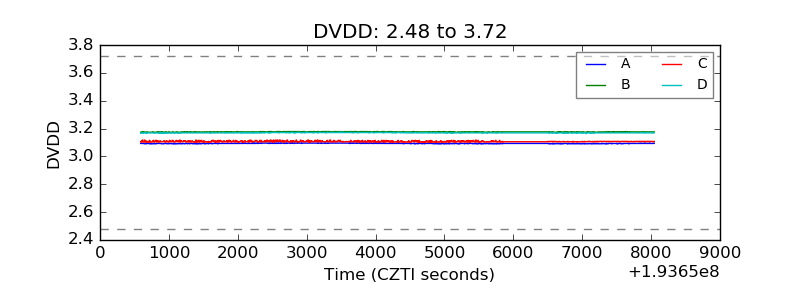 |
| Temperature 1 | 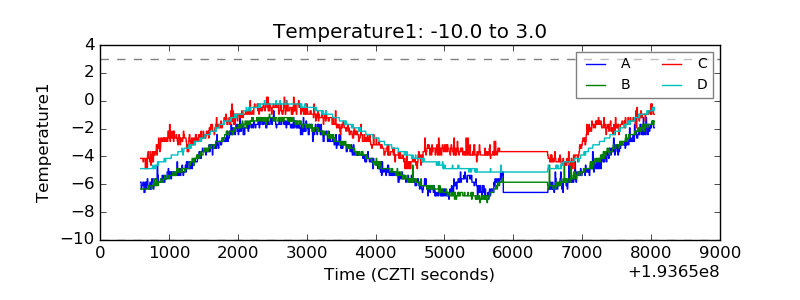 |
| Veto HV Monitor | 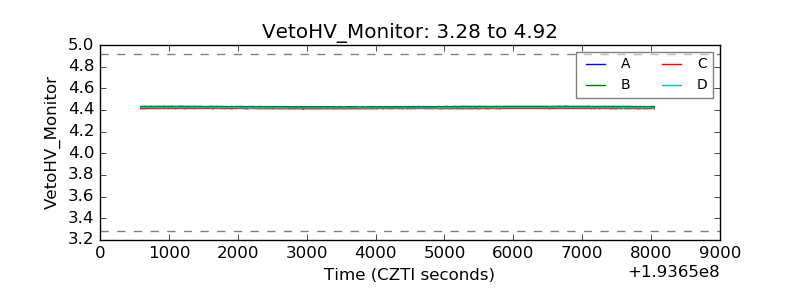 |
| Veto LLD | 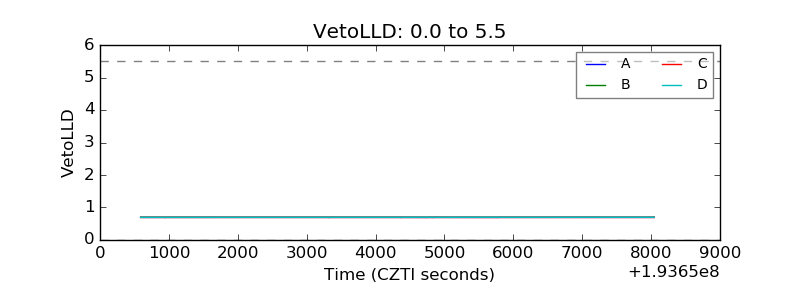 |
| Alpha Counter | 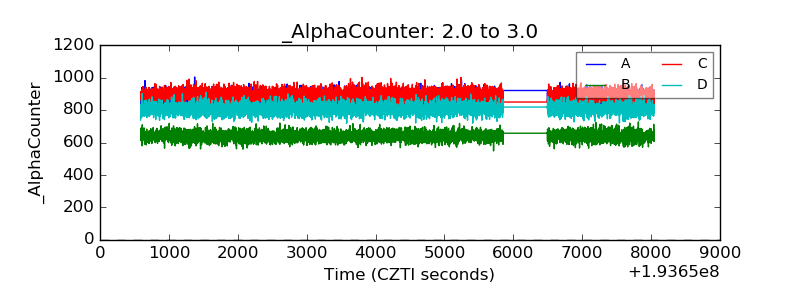 |
| _CPM_Rate | 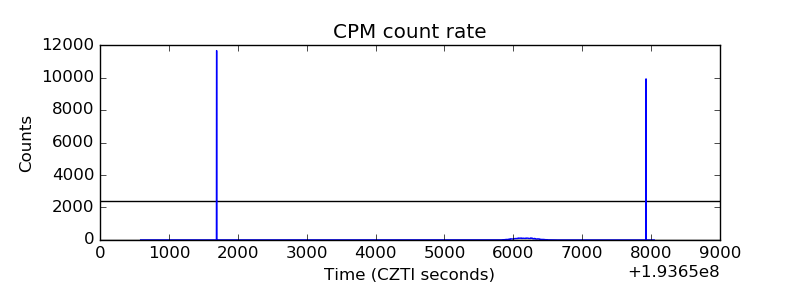 |
| CZT Counter |  |
| +2.5 Volts monitor | 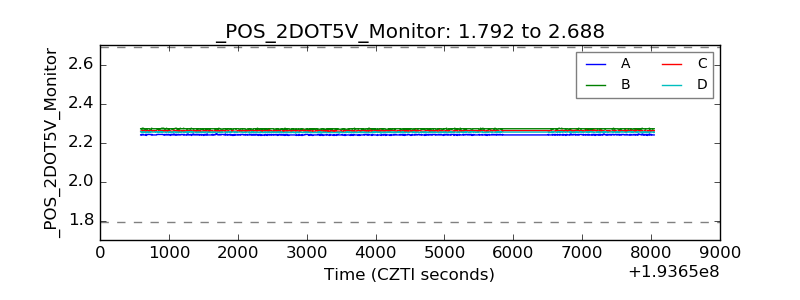 |
| +5 Volts monitor |  |
| _ROLL_ROT | 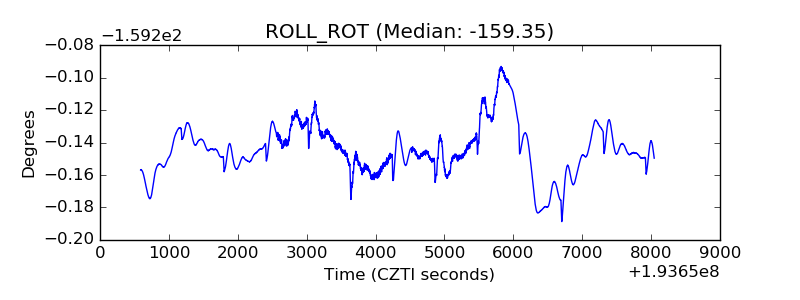 |
| _Roll_DEC | 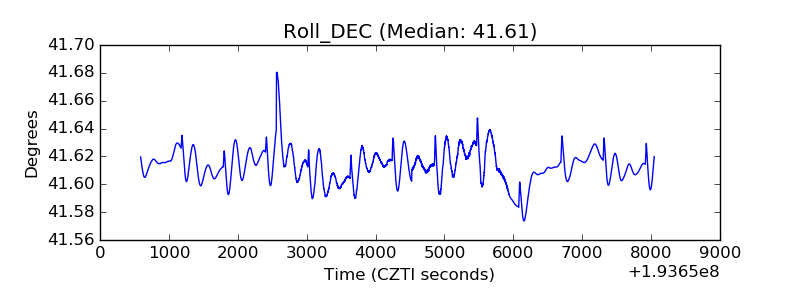 |
| _Roll_RA | 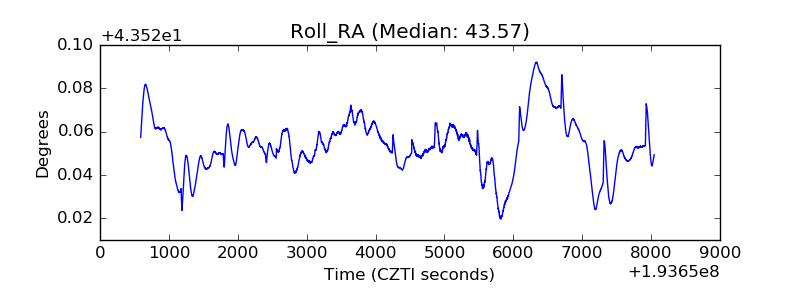 |
| Veto Counter |  |