| Param | Original file | Final file |
|---|---|---|
| Filename | modeM0/AS1T01_072T02_9000000336_02154cztM0_level2.evt | modeM0/AS1T01_072T02_9000000336_02154cztM0_level2_quad_clean.evt |
| Size (bytes) | 141,310,080 | 38,315,520 |
| Size | 134.8 MB | 36.5 MB |
| Events in quadrant A | 1,375,759 | 252,337 |
| Events in quadrant B | 963,116 | 261,058 |
| Events in quadrant C | 897,739 | 248,121 |
| Events in quadrant D | 897,921 | 246,429 |
| Mode M0 | |||
|---|---|---|---|
| Quadrant | BADHDUFLAG | Total packets | Discarded packets |
| A | 0 | 5611 | 1 |
| B | 0 | 4315 | 1 |
| C | 0 | 4219 | 1 |
| D | 0 | 4329 | 1 |
| Mode SS | |||
|---|---|---|---|
| Quadrant | BADHDUFLAG | Total packets | Discarded packets |
| A | 0 | 42 | 0 |
| B | 0 | 42 | 0 |
| C | 0 | 42 | 0 |
| D | 0 | 42 | 0 |
| Quadrant | Total seconds | Saturated seconds | Saturation percentage |
|---|---|---|---|
| A | 2096 | 104 | 4.961832% |
| B | 2096 | 0 | 0.000000% |
| C | 2096 | 0 | 0.000000% |
| D | 2096 | 2 | 0.095420% |
Noise dominated data is calculated using 1-second bins in cleaned event files. If a bin has >2000 counts, and if more than 50% of those come from <1% of pixels, then it is considered to be noise-dominated and hence unusable.
| Quadrant | # 1 sec bins | Bins with >0 counts | Bins with >2000 counts | High rate bins dominated by noise | Noise dominated (total time) | Noise dominated (detector-on time) | Marked lightcurve |
|---|---|---|---|---|---|---|---|
| A | 2096 | 2096 | 153 | 153 | 7.30% | 7.30% | 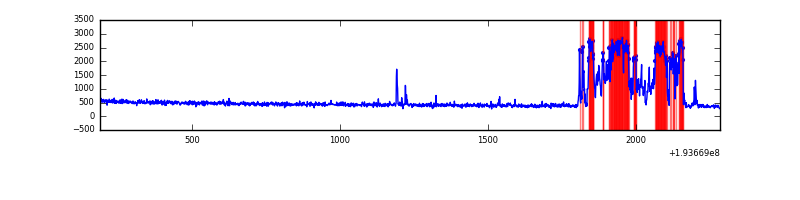 |
| B | 2096 | 2096 | 0 | 0 | 0.00% | 0.00% | 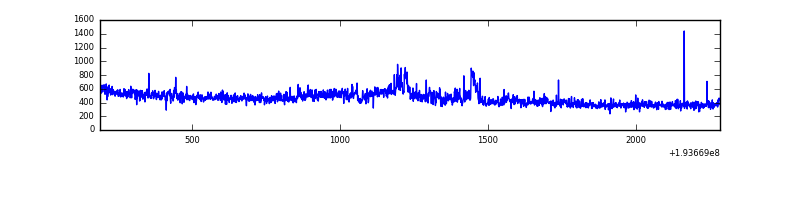 |
| C | 2096 | 2096 | 0 | 0 | 0.00% | 0.00% | 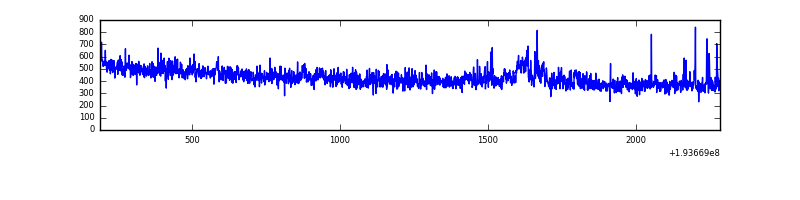 |
| D | 2096 | 2096 | 5 | 5 | 0.24% | 0.24% | 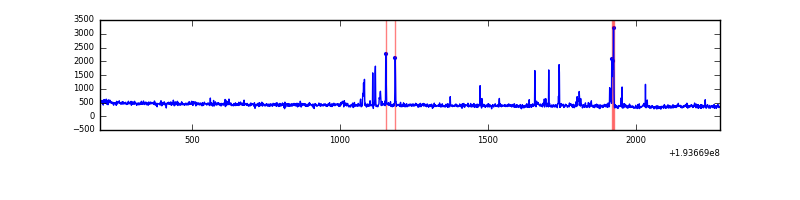 |
Top three noisy pixels from each quadrant. If the there are fewer than three noisy pixels in the level2.evt file, extra rows are filled as -1
| Pixel properties | Quadrant properties | ||||||
|---|---|---|---|---|---|---|---|
| Quadrant | DetID | PixID | Counts | Sigma | Mean | Median | Sigma |
| A | 0 | 247 | 498690 | 11018.36 | 225 | 222 | 45.2 |
| A | 15 | 236 | 8839 | 190.47 | 225 | 222 | 45.2 |
| A | 0 | 1 | 2996 | 61.32 | 225 | 222 | 45.2 |
| B | 0 | 234 | 74384 | 1712.88 | 229 | 225 | 43.3 |
| B | 15 | 222 | 6270 | 139.62 | 229 | 225 | 43.3 |
| B | 0 | 220 | 4173 | 91.19 | 229 | 225 | 43.3 |
| C | 9 | 85 | 29337 | 596.6 | 216 | 216 | 48.8 |
| C | 10 | 34 | 11061 | 222.18 | 216 | 216 | 48.8 |
| C | 1 | 192 | 7630 | 151.89 | 216 | 216 | 48.8 |
| D | 2 | 31 | 31017 | 615.63 | 218 | 214 | 50.0 |
| D | 5 | 233 | 14967 | 294.85 | 218 | 214 | 50.0 |
| D | 2 | 107 | 9793 | 191.45 | 218 | 214 | 50.0 |
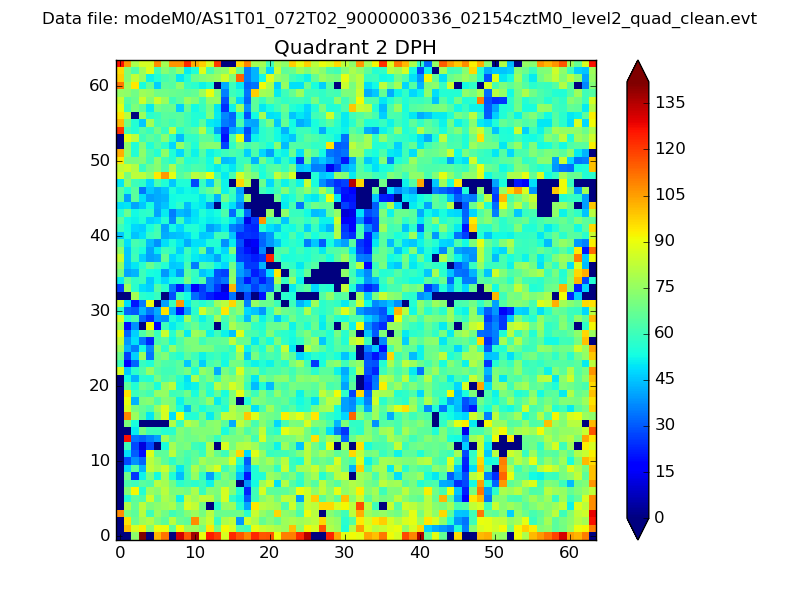
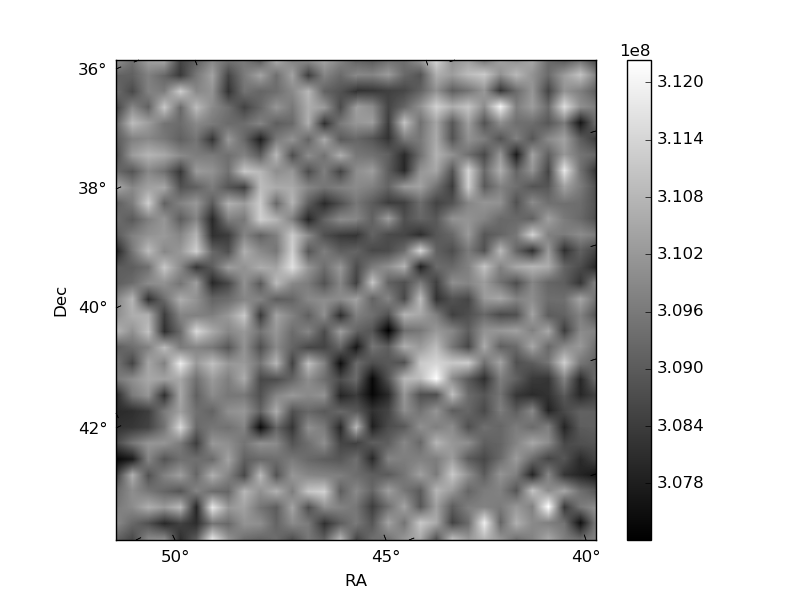
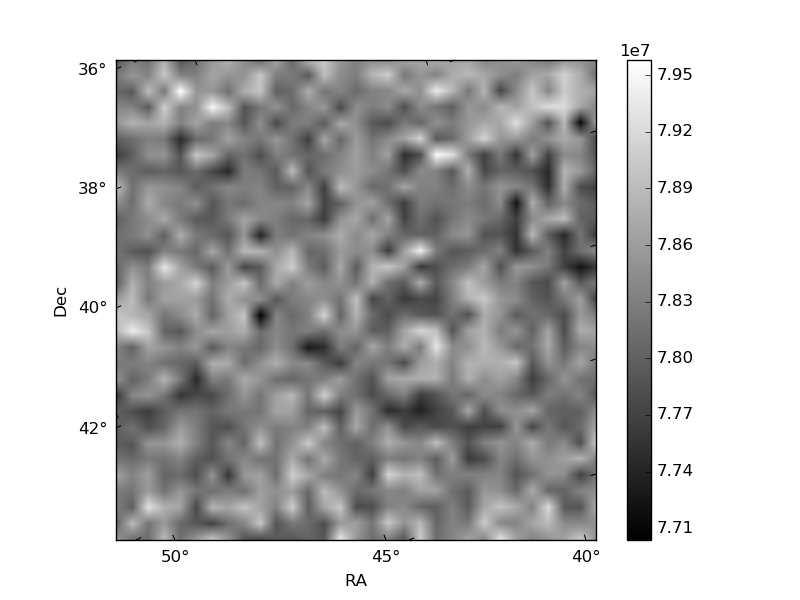
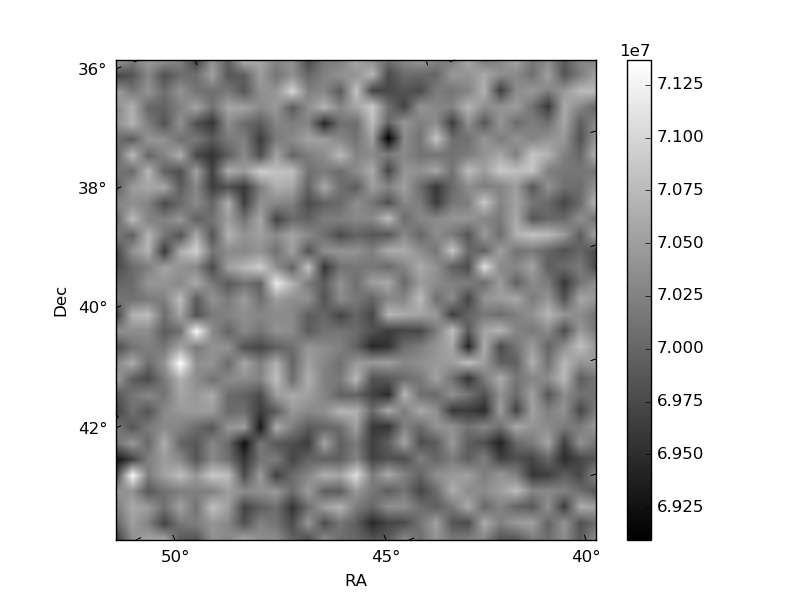
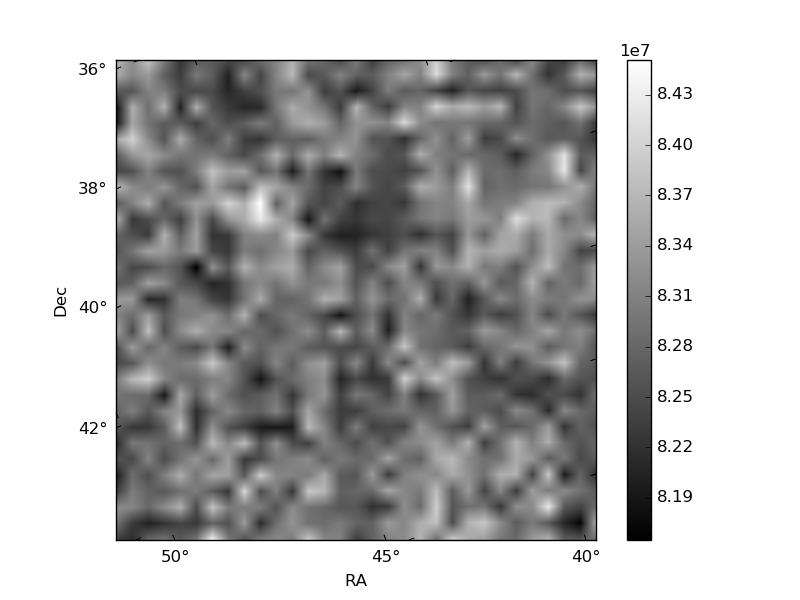
Histogram calculated using DETX and DETY for each event in the final _common_clean file
| Quadrant A | 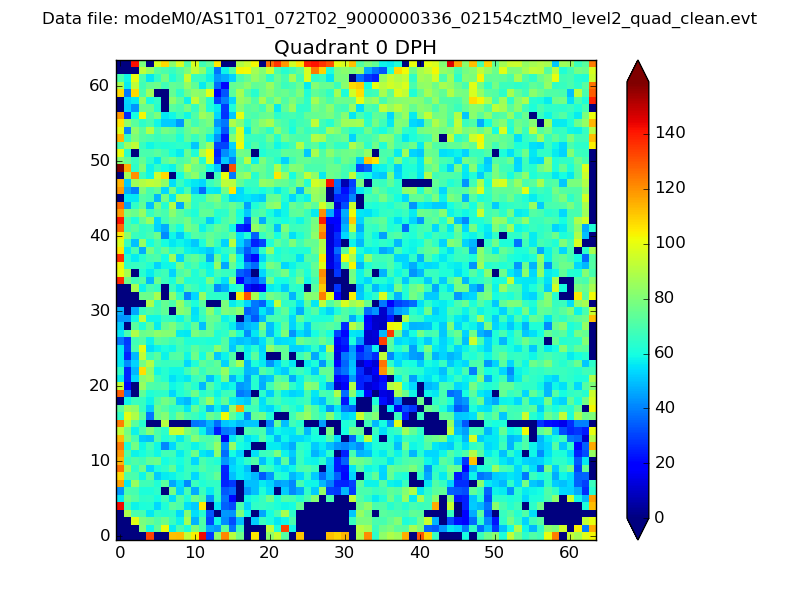 |
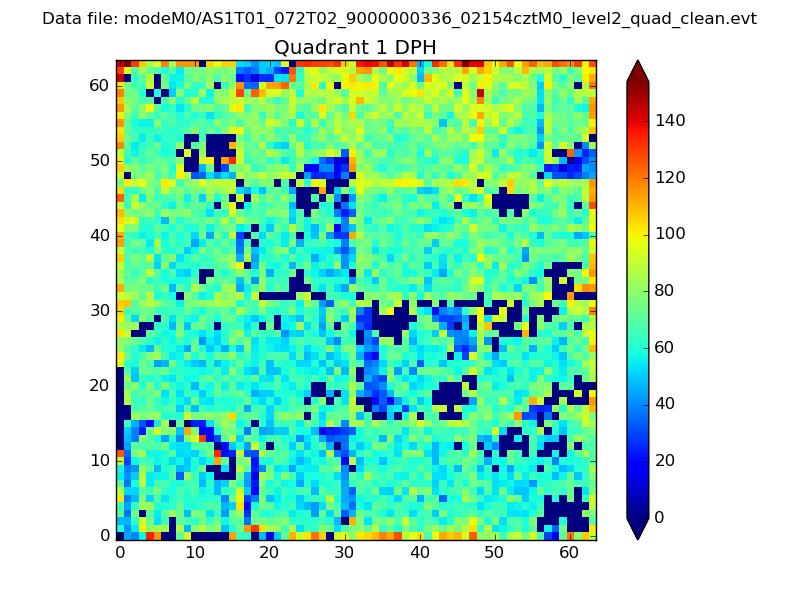 |
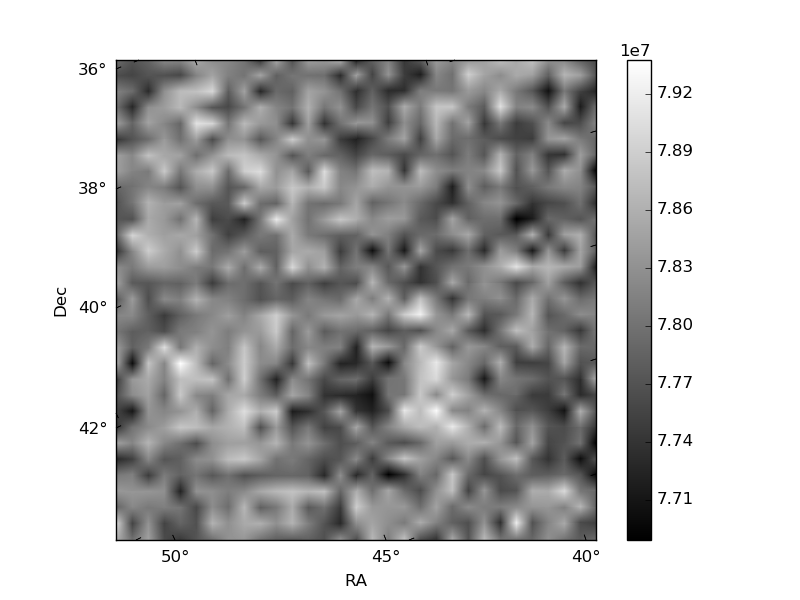
Quadrant B |
|---|---|---|---|
| Quadrant D | 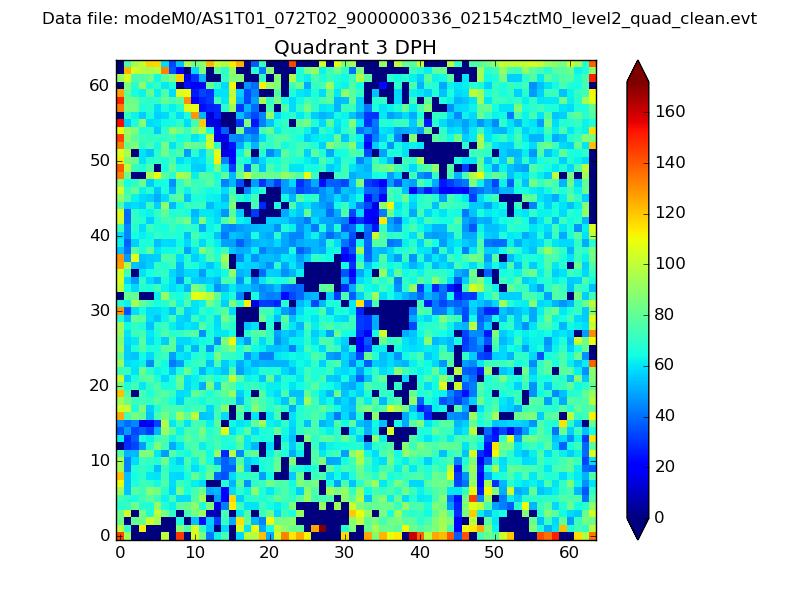 |
 |
Quadrant C |
| Plot type | Count rate plots | Images |
|---|---|---|
| Comparison with Poisson distribution Blue bars denote a histogram of data divided into 1 sec bins. Red curve is a Poisson curve with rate = median count rate of data. |
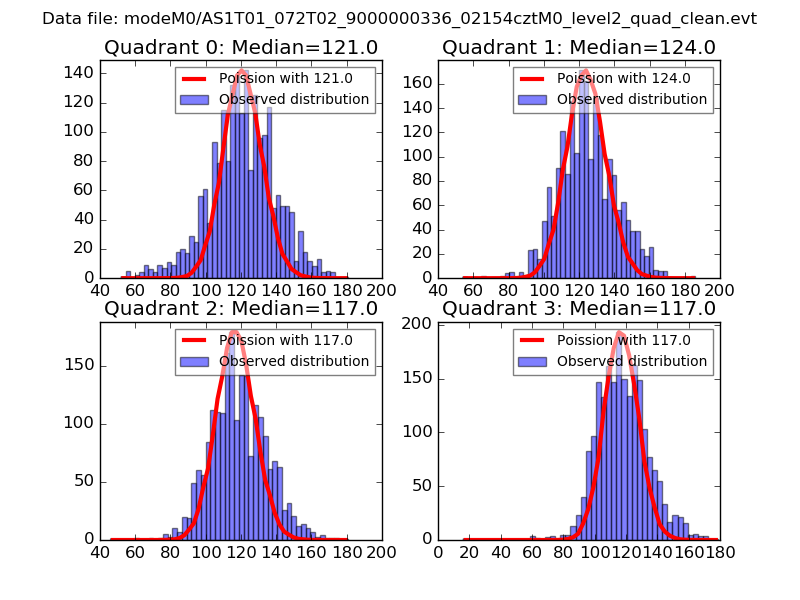 |
 |
| Quadrant-wise count rates Data is divided into 100 sec bins |
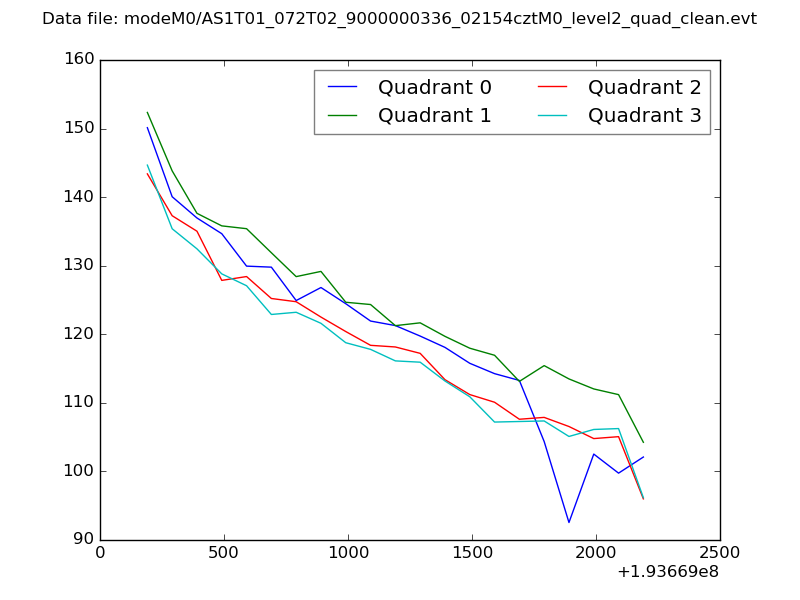 |
|
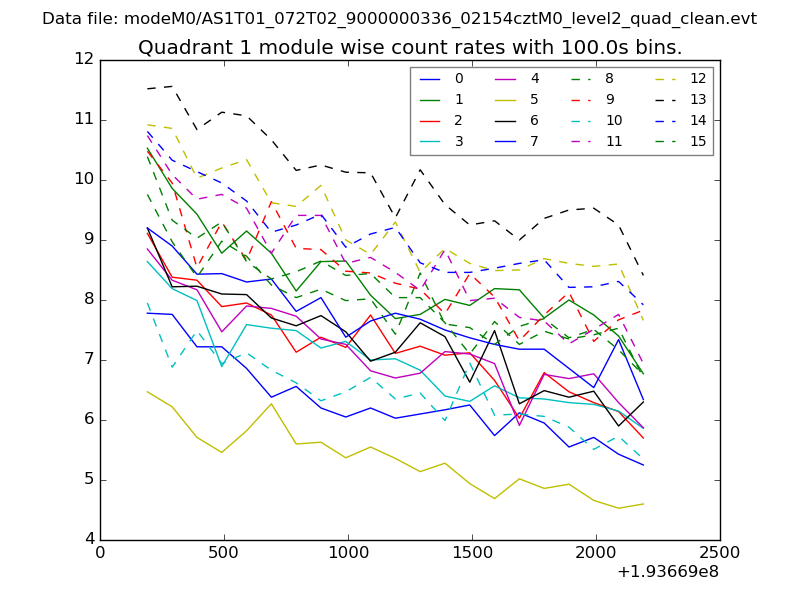
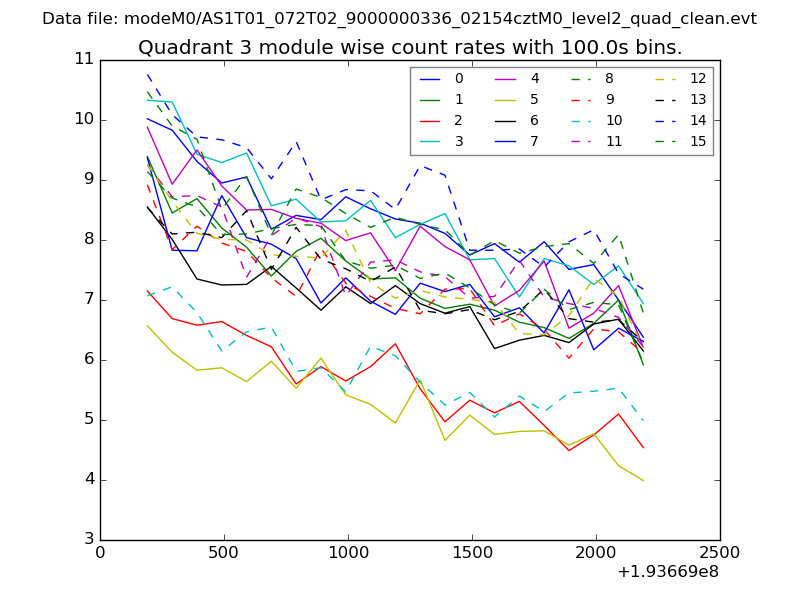
| Module-wise count rates for Quadrant A Data is divided into 100 sec bins |
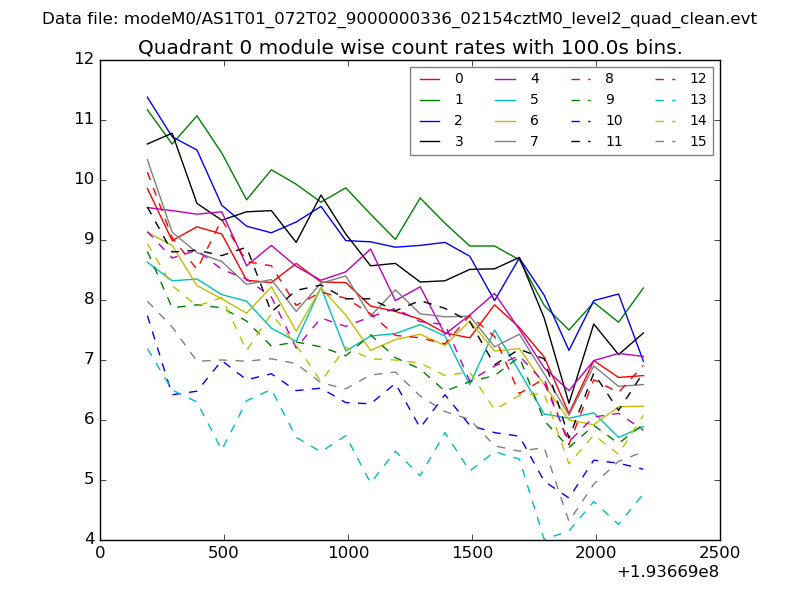 |
 |
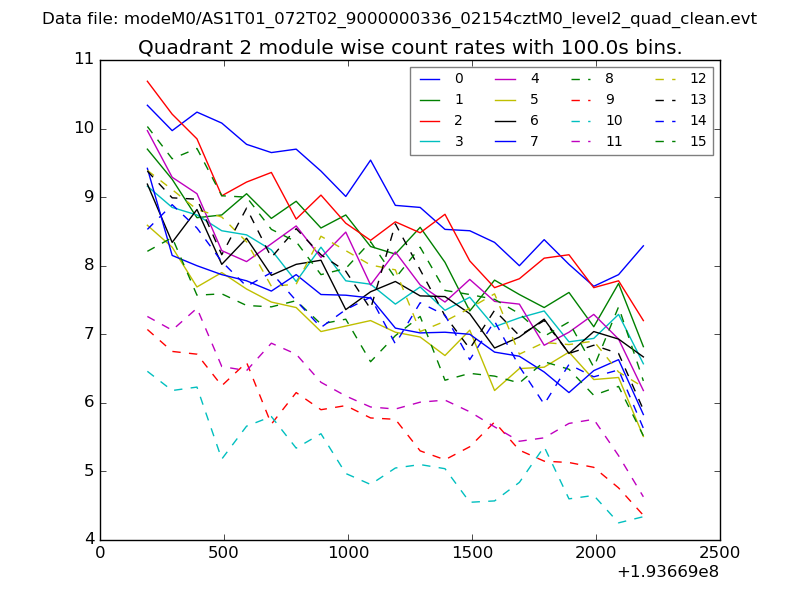
| Module-wise count rates for Quadrant B Data is divided into 100 sec bins |
 |
 |
| Module-wise count rates for Quadrant C Data is divided into 100 sec bins |
 |
 |
| Module-wise count rates for Quadrant D Data is divided into 100 sec bins |
 |
 |
| Parameter | Plot |
|---|---|
| CZT HV Monitor | 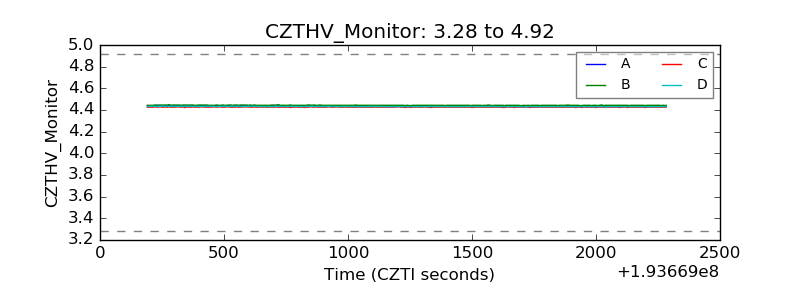 |
| D_VDD | 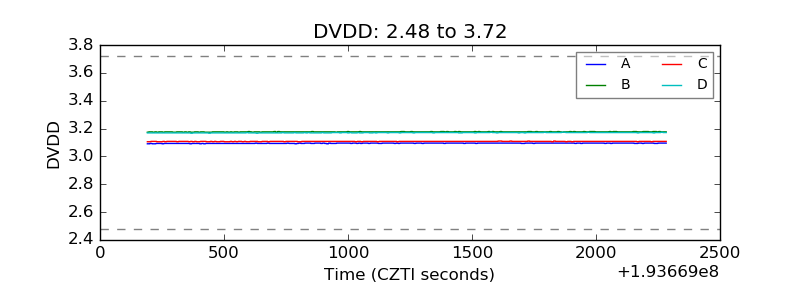 |
| Temperature 1 | 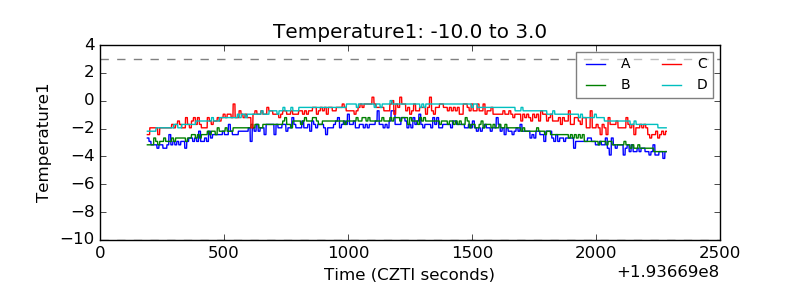 |
| Veto HV Monitor | 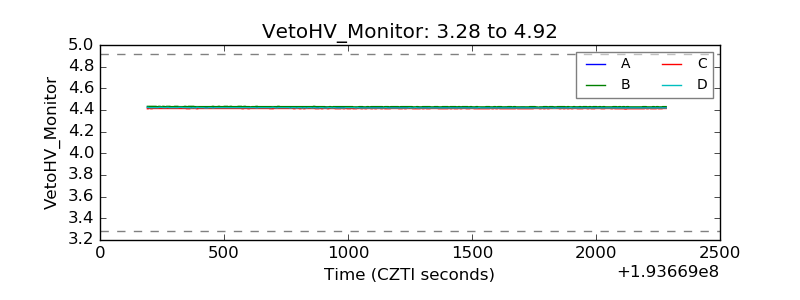 |
| Veto LLD | 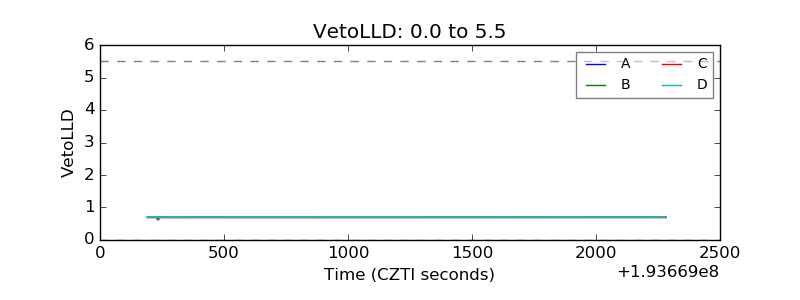 |
| Alpha Counter | 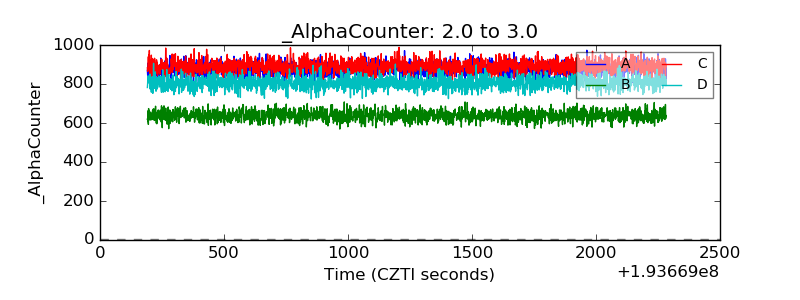 |
| _CPM_Rate | 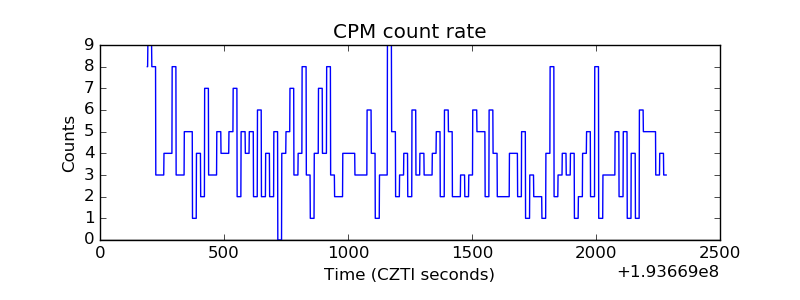 |
| CZT Counter | 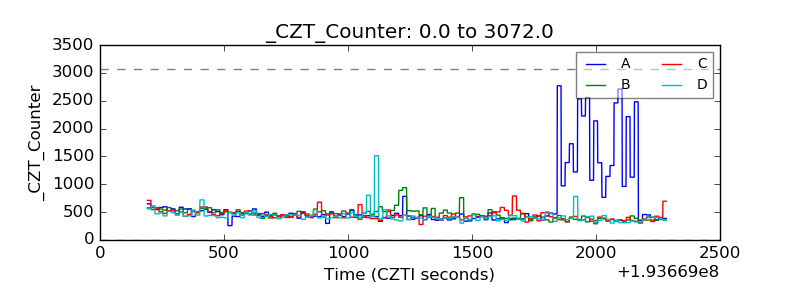 |
| +2.5 Volts monitor | 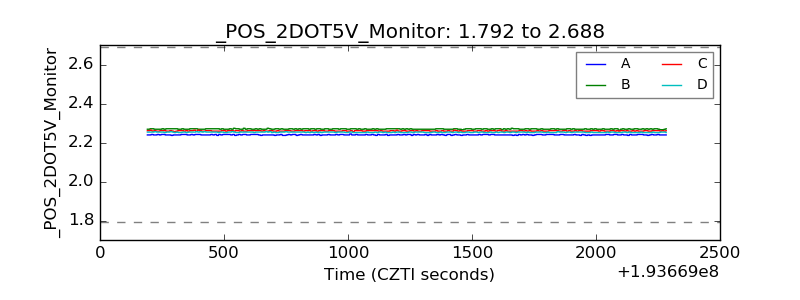 |
| +5 Volts monitor | 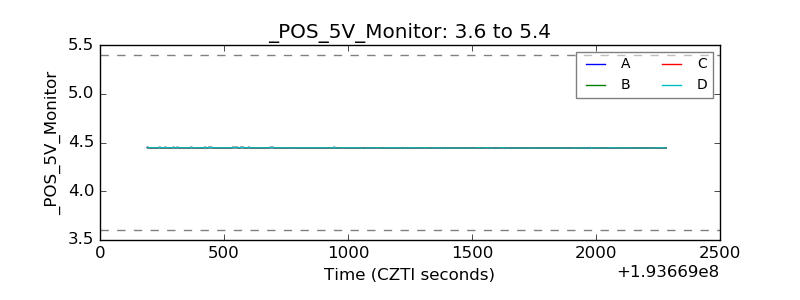 |
| _ROLL_ROT | 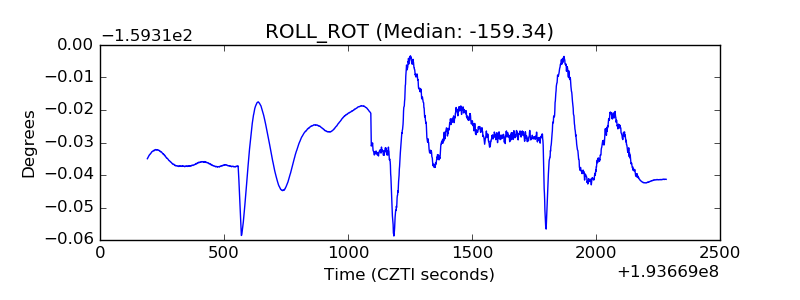 |
| _Roll_DEC | 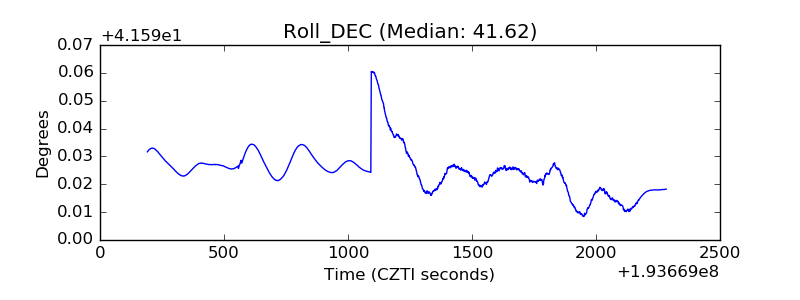 |
| _Roll_RA | 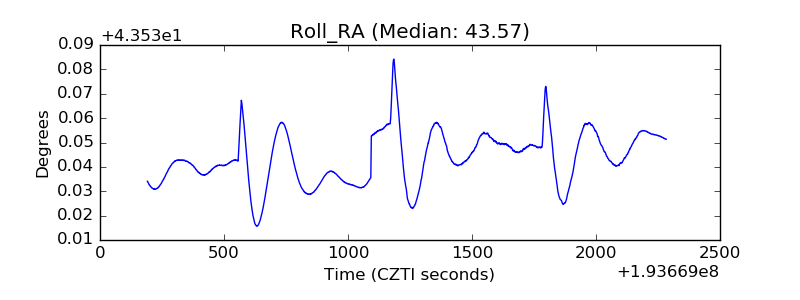 |
| Veto Counter | 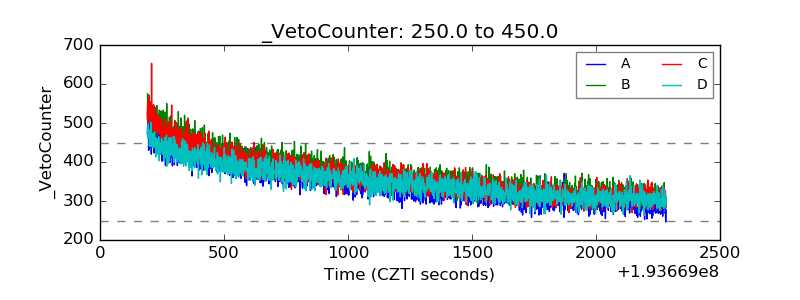 |