| Param | Original file | Final file |
|---|---|---|
| Filename | modeM0/AS1T01_072T01_9000000338cztM0_level2.fits | modeM0/AS1T01_072T01_9000000338cztM0_level2_quad_clean.evt |
| Size (bytes) | 852,943,680 | 924,465,600 |
| Size | 813.4 MB | 881.6 MB |
| Events in quadrant A | 4,962,888 | 5,444,085 |
| Events in quadrant B | 4,961,982 | 5,531,810 |
| Events in quadrant C | 4,867,494 | 5,342,085 |
| Events in quadrant D | 4,267,106 | 4,909,565 |
| Mode SS | |||
|---|---|---|---|
| Quadrant | BADHDUFLAG | Total packets | Discarded packets |
| A | 0 | 1976 | 0 |
| B | 0 | 1976 | 0 |
| C | 0 | 1976 | 0 |
| D | 0 | 1976 | 0 |
| Mode M9 | |||
|---|---|---|---|
| Quadrant | BADHDUFLAG | Total packets | Discarded packets |
| A | 1 | 139986430990376 | 139985869078574 |
| B | 1 | 139986430990376 | 139985869078574 |
| C | 1 | 139986430990376 | 139985869078574 |
| D | 1 | 139986430990376 | 139985869078574 |
| Mode M0 | |||
|---|---|---|---|
| Quadrant | BADHDUFLAG | Total packets | Discarded packets |
| A | 0 | 202909 | 0 |
| B | 0 | 204807 | 0 |
| C | 0 | 217869 | 0 |
| D | 0 | 208659 | 0 |
| Quadrant | Total seconds | Saturated seconds | Saturation percentage |
|---|---|---|---|
| A | 98801 | 620 | 0.627524% |
| B | 98797 | 701 | 0.709536% |
| C | 98797 | 1339 | 1.355304% |
| D | 98801 | 713 | 0.721653% |
Noise dominated data is calculated using 1-second bins in cleaned event files. If a bin has >2000 counts, and if more than 50% of those come from <1% of pixels, then it is considered to be noise-dominated and hence unusable.
| Quadrant | # 1 sec bins | Bins with >0 counts | Bins with >2000 counts | High rate bins dominated by noise | Noise dominated (total time) | Noise dominated (detector-on time) | Marked lightcurve |
|---|---|---|---|---|---|---|---|
| A | 114891 | 98786 | 0 | 0 | 0.00% | 0.00% |  |
| B | 114891 | 98783 | 0 | 0 | 0.00% | 0.00% | 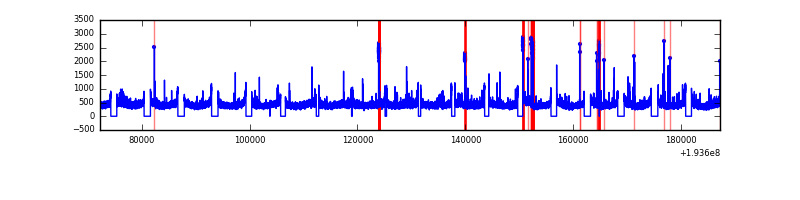 |
| C | 114891 | 98785 | 0 | 0 | 0.00% | 0.00% |  |
| D | 114891 | 98785 | 0 | 0 | 0.00% | 0.00% | 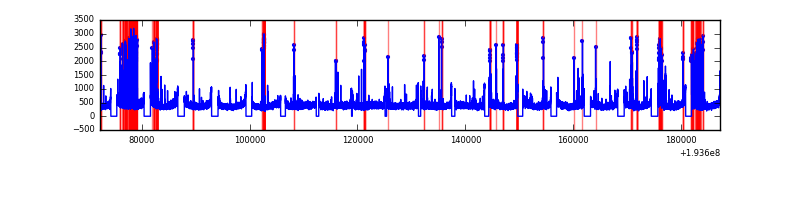 |
Top three noisy pixels from each quadrant. If the there are fewer than three noisy pixels in the level2.evt file, extra rows are filled as -1
| Pixel properties | Quadrant properties | ||||||
|---|---|---|---|---|---|---|---|
| Quadrant | DetID | PixID | Counts | Sigma | Mean | Median | Sigma |
| A | 0 | 29 | 4508 | 10.89 | 1287 | 1195 | 304.1 |
| A | 7 | 110 | 4484 | 10.81 | 1287 | 1195 | 304.1 |
| A | 9 | 19 | 3498 | 7.57 | 1287 | 1195 | 304.1 |
| B | 2 | 9 | 3936 | 11.15 | 1308 | 1237 | 242.1 |
| B | 10 | 225 | 3289 | 8.48 | 1308 | 1237 | 242.1 |
| B | 5 | 128 | 3220 | 8.19 | 1308 | 1237 | 242.1 |
| C | 12 | 241 | 3305 | 6.78 | 1283 | 1183 | 313.1 |
| C | 9 | 242 | 3122 | 6.19 | 1283 | 1183 | 313.1 |
| C | 3 | 187 | 3066 | 6.01 | 1283 | 1183 | 313.1 |
| D | 1 | 19 | 3129 | 6.95 | 1216 | 1110 | 290.6 |
| D | 3 | 14 | 2975 | 6.42 | 1216 | 1110 | 290.6 |
| D | 6 | 231 | 2970 | 6.4 | 1216 | 1110 | 290.6 |
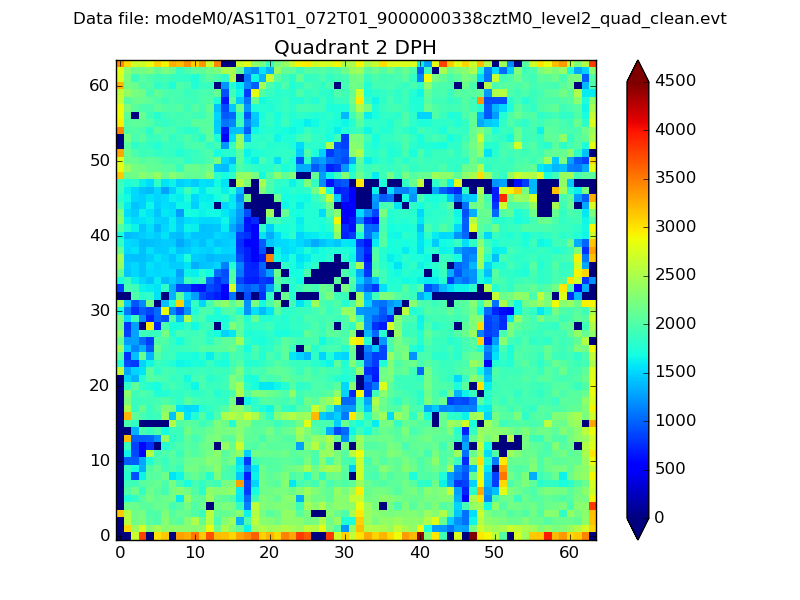
Histogram calculated using DETX and DETY for each event in the final _common_clean file
| Quadrant A | 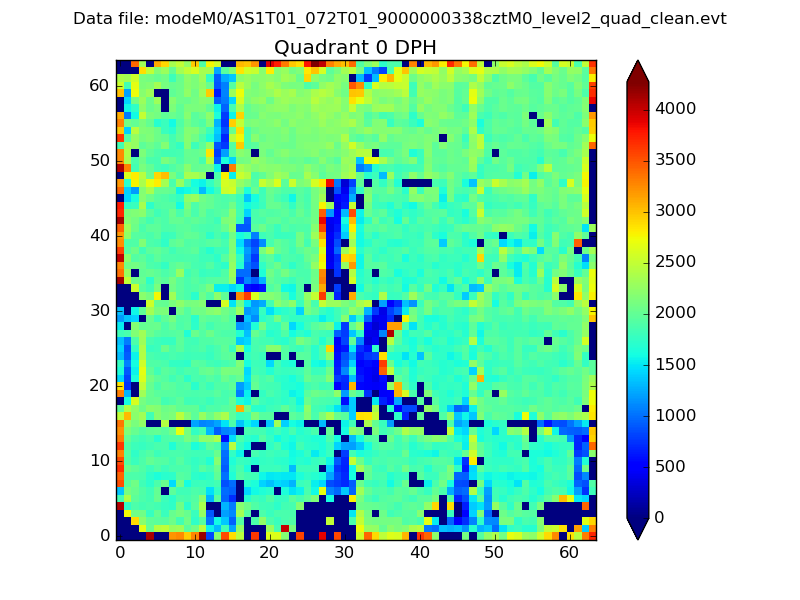 |
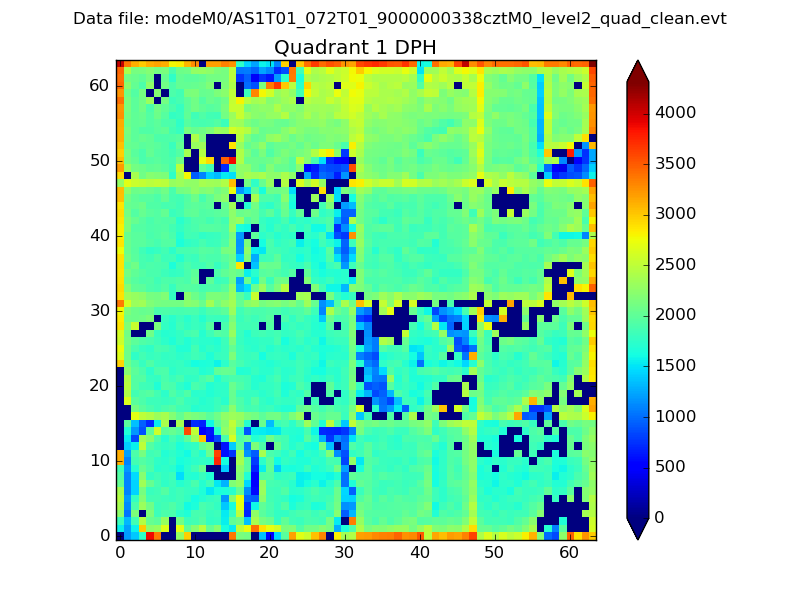 |
Quadrant B |
|---|---|---|---|
| Quadrant D | 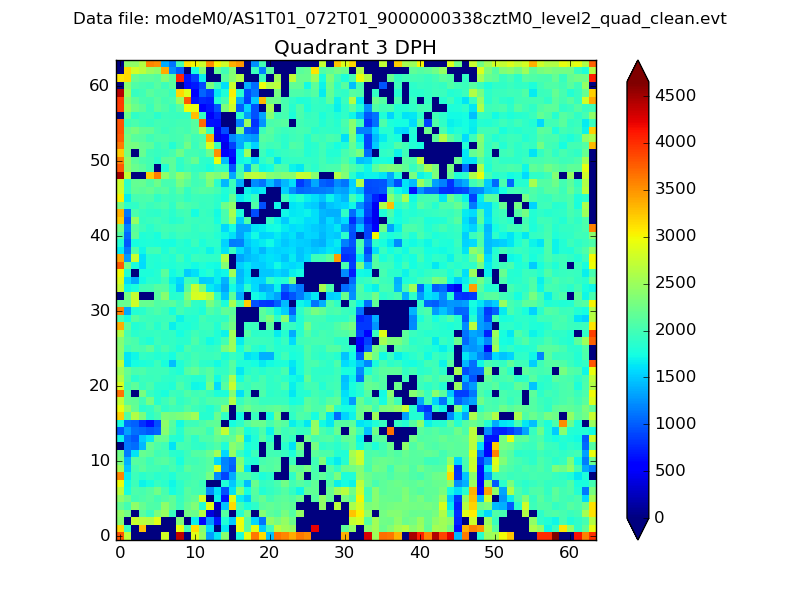 |
 |
Quadrant C |
| Plot type | Count rate plots | Images |
|---|---|---|
| Comparison with Poisson distribution Blue bars denote a histogram of data divided into 1 sec bins. Red curve is a Poisson curve with rate = median count rate of data. |
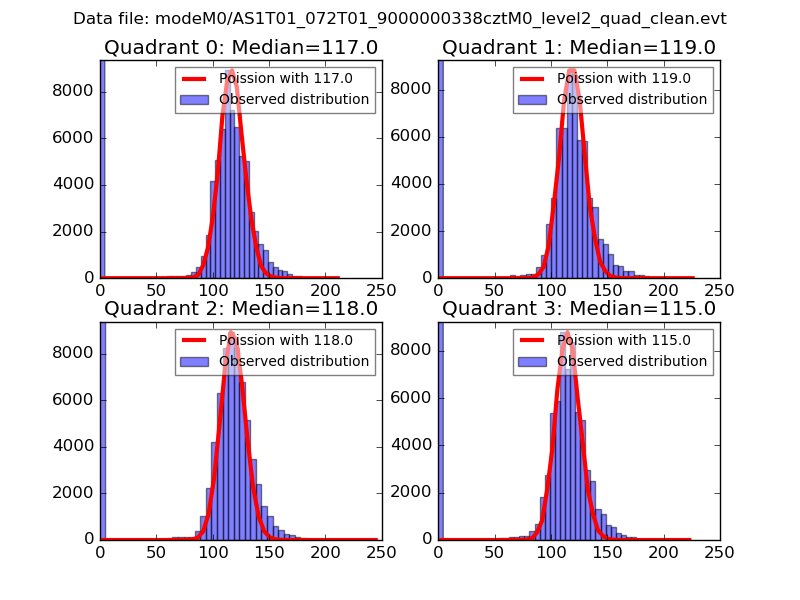 |
 |
| Quadrant-wise count rates Data is divided into 100 sec bins |
 |
|
| Module-wise count rates for Quadrant A Data is divided into 100 sec bins |
 |
 |
| Module-wise count rates for Quadrant B Data is divided into 100 sec bins |
 |
 |
| Module-wise count rates for Quadrant C Data is divided into 100 sec bins |
 |
 |
| Module-wise count rates for Quadrant D Data is divided into 100 sec bins |
 |
 |
| Parameter | Plot |
|---|---|
| CZT HV Monitor |  |
| D_VDD |  |
| Temperature 1 | 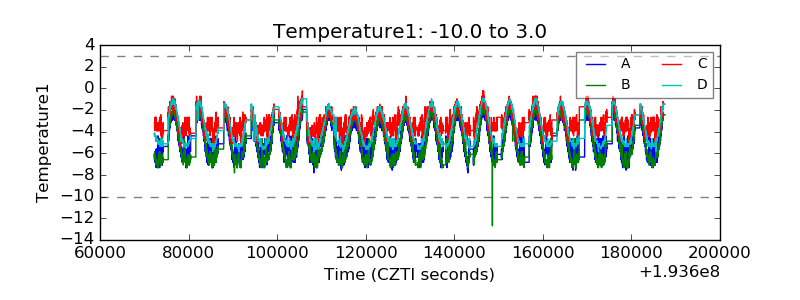 |
| Veto HV Monitor |  |
| Veto LLD |  |
| Alpha Counter | 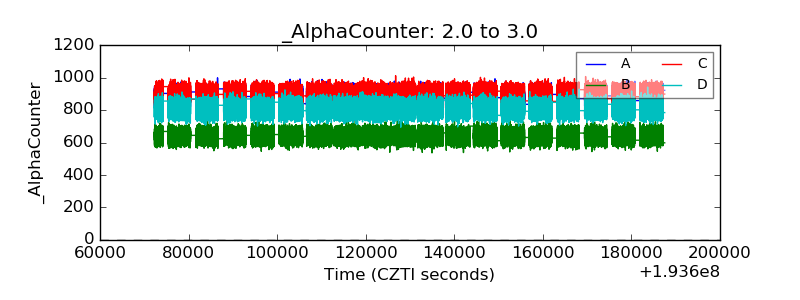 |
| _CPM_Rate |  |
| CZT Counter |  |
| +2.5 Volts monitor | 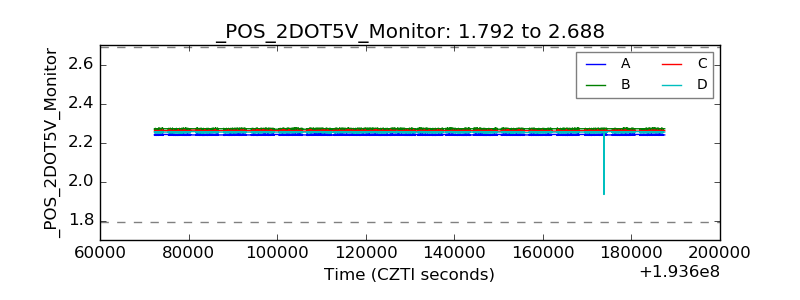 |
| +5 Volts monitor | 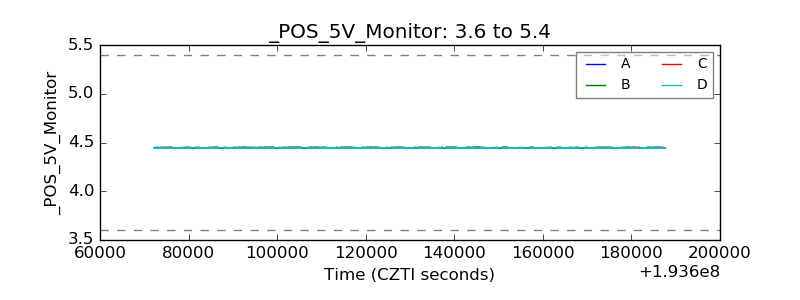 |
| _ROLL_ROT |  |
| _Roll_DEC |  |
| _Roll_RA | 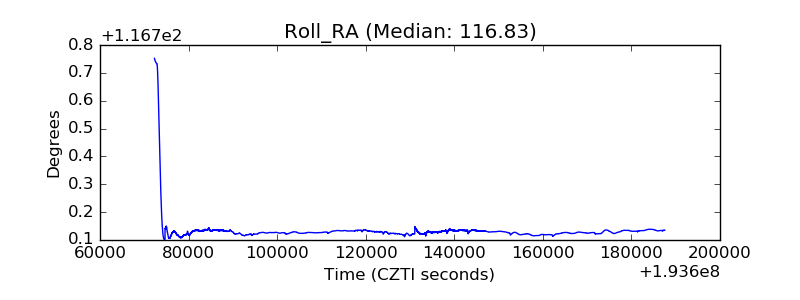 |
| Veto Counter | 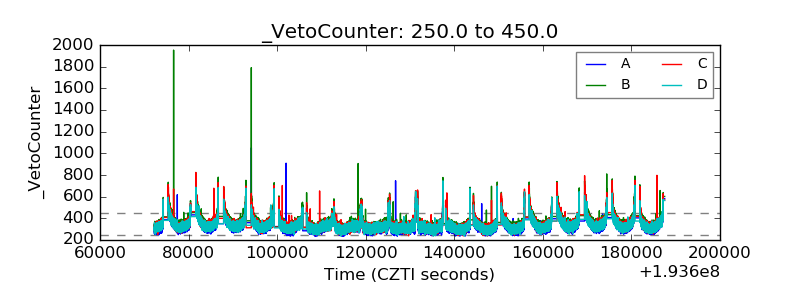 |