| Param | Original file | Final file |
|---|---|---|
| Filename | modeM0/AS1T01_072T01_9000000338_02154cztM0_level2.evt | modeM0/AS1T01_072T01_9000000338_02154cztM0_level2_quad_clean.evt |
| Size (bytes) | 213,857,280 | 43,303,680 |
| Size | 204.0 MB | 41.3 MB |
| Events in quadrant A | 1,443,415 | 269,703 |
| Events in quadrant B | 1,533,017 | 277,339 |
| Events in quadrant C | 1,819,903 | 267,765 |
| Events in quadrant D | 1,455,452 | 263,328 |
| Mode SS | |||
|---|---|---|---|
| Quadrant | BADHDUFLAG | Total packets | Discarded packets |
| A | 0 | 66 | 0 |
| B | 0 | 66 | 0 |
| C | 0 | 66 | 0 |
| D | 0 | 66 | 0 |
| Mode M9 | |||
|---|---|---|---|
| Quadrant | BADHDUFLAG | Total packets | Discarded packets |
| A | 0 | 1 | 0 |
| B | 1 | 1 | 0 |
| C | 1 | -1 | -1 |
| D | 1 | -1 | -1 |
| Mode M0 | |||
|---|---|---|---|
| Quadrant | BADHDUFLAG | Total packets | Discarded packets |
| A | 0 | 6709 | 1 |
| B | 0 | 6826 | 1 |
| C | 0 | 7825 | 1 |
| D | 0 | 6923 | 1 |
| Quadrant | Total seconds | Saturated seconds | Saturation percentage |
|---|---|---|---|
| A | 3276 | 19 | 0.579976% |
| B | 3276 | 21 | 0.641026% |
| C | 3276 | 16 | 0.488400% |
| D | 3276 | 23 | 0.702076% |
Noise dominated data is calculated using 1-second bins in cleaned event files. If a bin has >2000 counts, and if more than 50% of those come from <1% of pixels, then it is considered to be noise-dominated and hence unusable.
| Quadrant | # 1 sec bins | Bins with >0 counts | Bins with >2000 counts | High rate bins dominated by noise | Noise dominated (total time) | Noise dominated (detector-on time) | Marked lightcurve |
|---|---|---|---|---|---|---|---|
| A | 4396 | 3277 | 0 | 0 | 0.00% | 0.00% | 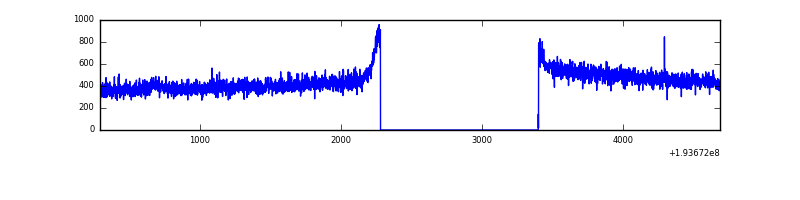 |
| B | 4396 | 3277 | 0 | 0 | 0.00% | 0.00% | 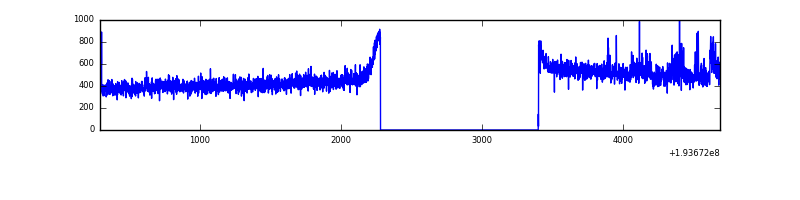 |
| C | 4396 | 3277 | 0 | 0 | 0.00% | 0.00% | 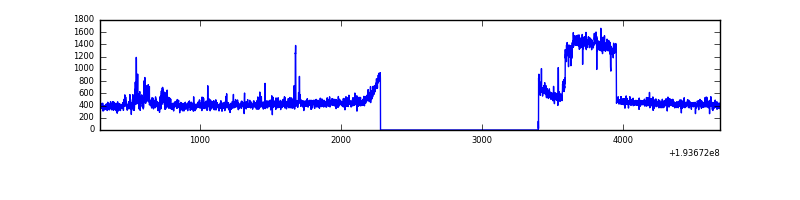 |
| D | 4396 | 3277 | 16 | 16 | 0.36% | 0.49% |  |
Top three noisy pixels from each quadrant. If the there are fewer than three noisy pixels in the level2.evt file, extra rows are filled as -1
| Pixel properties | Quadrant properties | ||||||
|---|---|---|---|---|---|---|---|
| Quadrant | DetID | PixID | Counts | Sigma | Mean | Median | Sigma |
| A | 13 | 9 | 4799 | 59.02 | 373 | 367 | 75.1 |
| A | 3 | 80 | 1939 | 20.93 | 373 | 367 | 75.1 |
| A | 15 | 191 | 1472 | 14.72 | 373 | 367 | 75.1 |
| B | 5 | 68 | 30998 | 424.02 | 386 | 378 | 72.2 |
| B | 0 | 234 | 16668 | 225.58 | 386 | 378 | 72.2 |
| B | 0 | 198 | 8302 | 109.73 | 386 | 378 | 72.2 |
| C | 10 | 82 | 336059 | 4097.44 | 365 | 366 | 81.9 |
| C | 9 | 85 | 50824 | 615.89 | 365 | 366 | 81.9 |
| C | 9 | 236 | 1786 | 17.33 | 365 | 366 | 81.9 |
| D | 2 | 31 | 65085 | 780.89 | 359 | 350 | 82.9 |
| D | 13 | 53 | 32491 | 387.71 | 359 | 350 | 82.9 |
| D | 5 | 233 | 4834 | 54.09 | 359 | 350 | 82.9 |
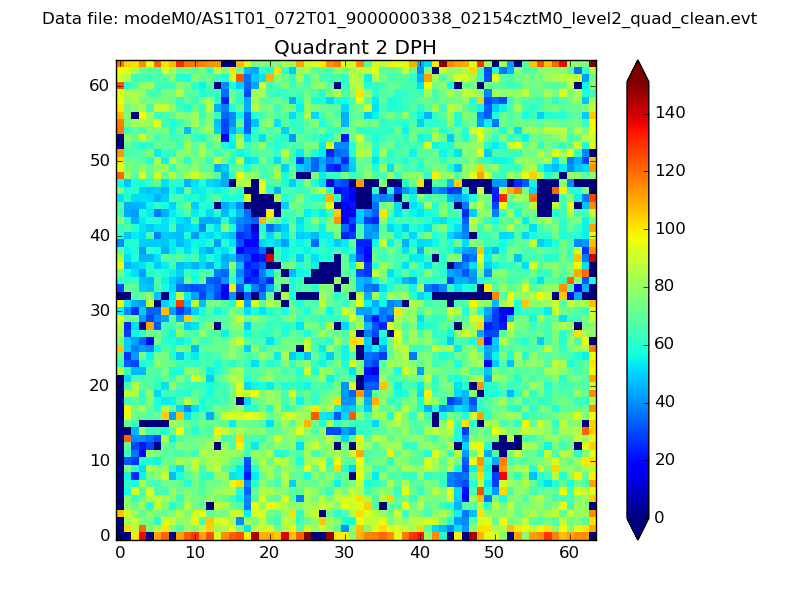
Histogram calculated using DETX and DETY for each event in the final _common_clean file
| Quadrant A | 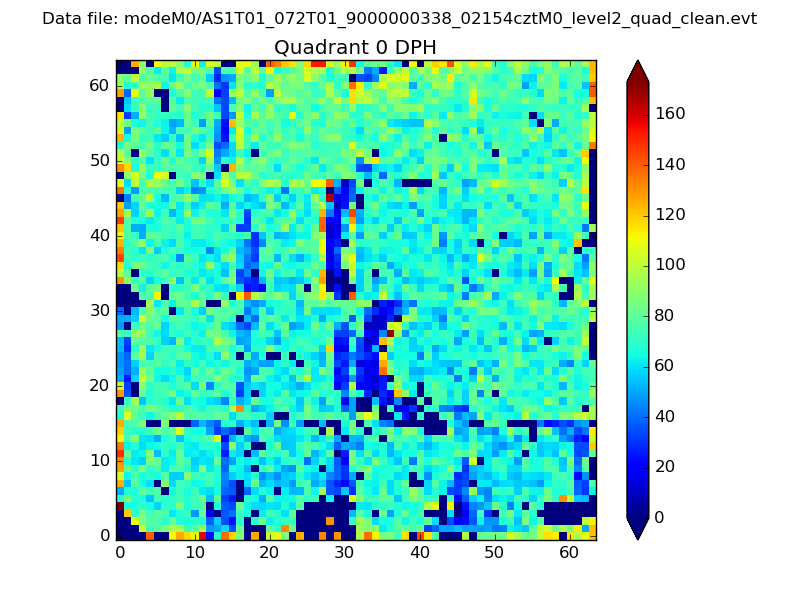 |
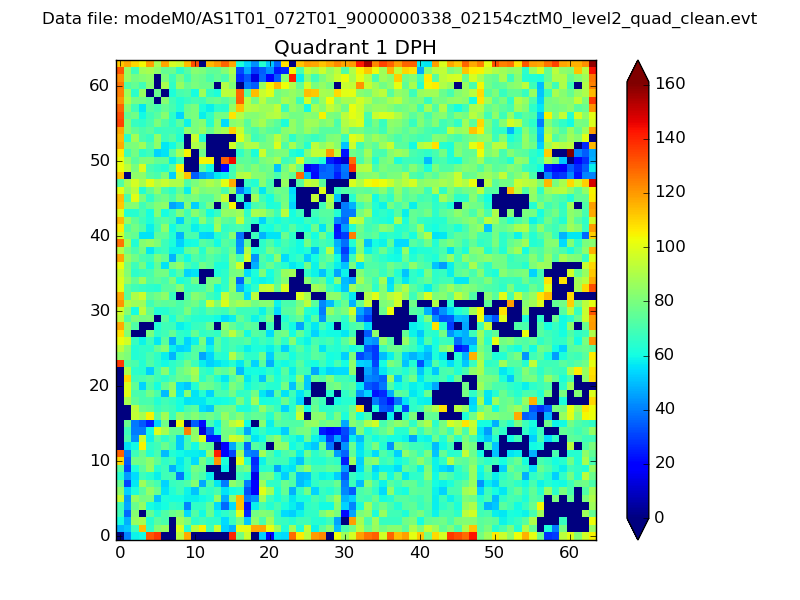 |
Quadrant B |
|---|---|---|---|
| Quadrant D | 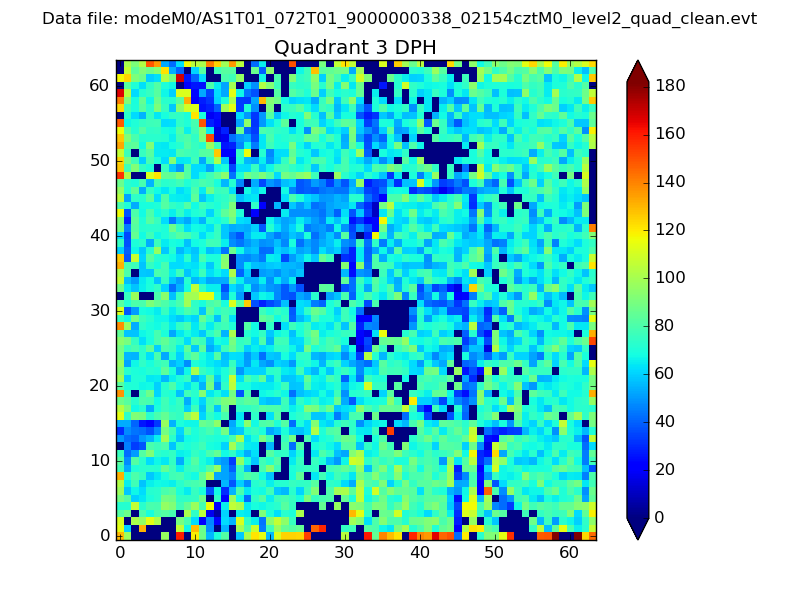 |
 |
Quadrant C |
| Plot type | Count rate plots | Images |
|---|---|---|
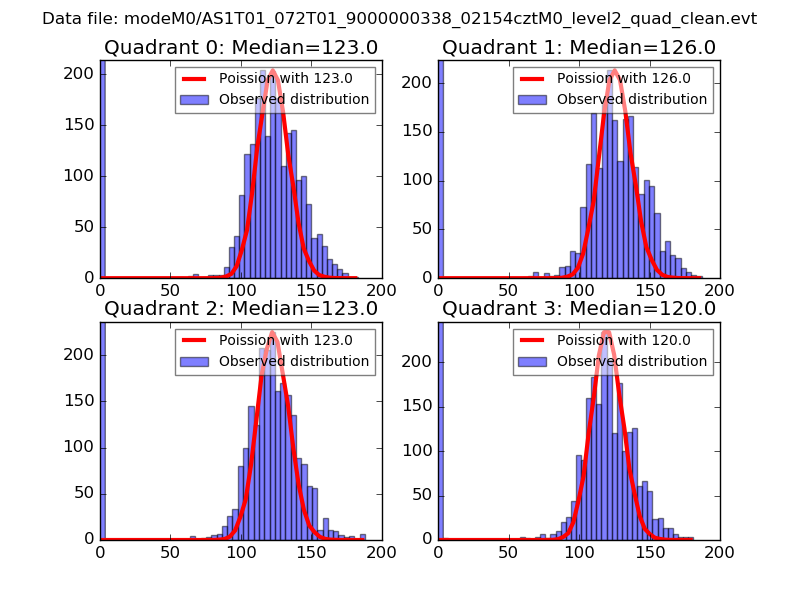
| Comparison with Poisson distribution Blue bars denote a histogram of data divided into 1 sec bins. Red curve is a Poisson curve with rate = median count rate of data. |
 |
 |
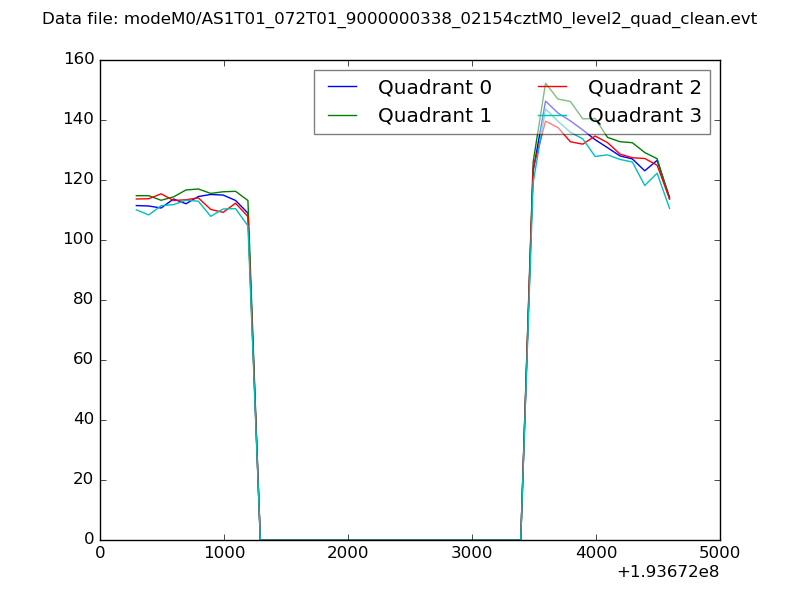
| Quadrant-wise count rates Data is divided into 100 sec bins |
 |
|
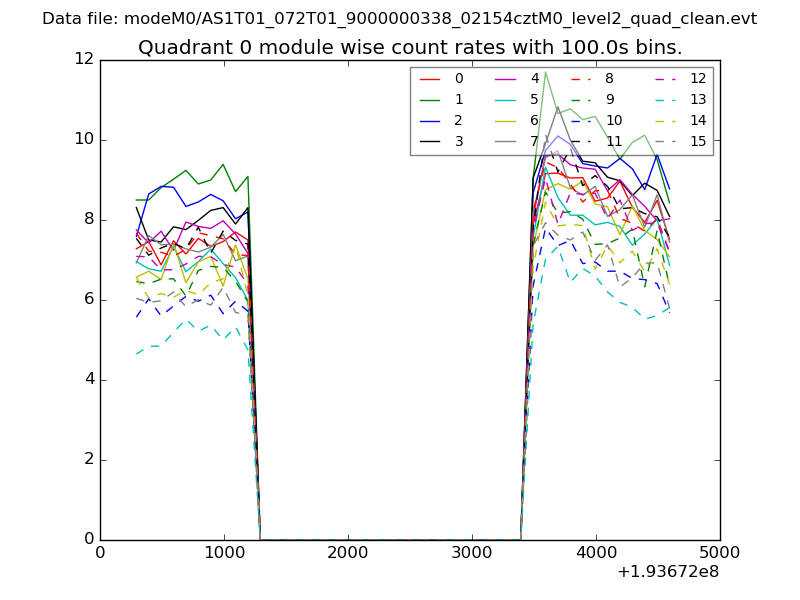
| Module-wise count rates for Quadrant A Data is divided into 100 sec bins |
 |
 |
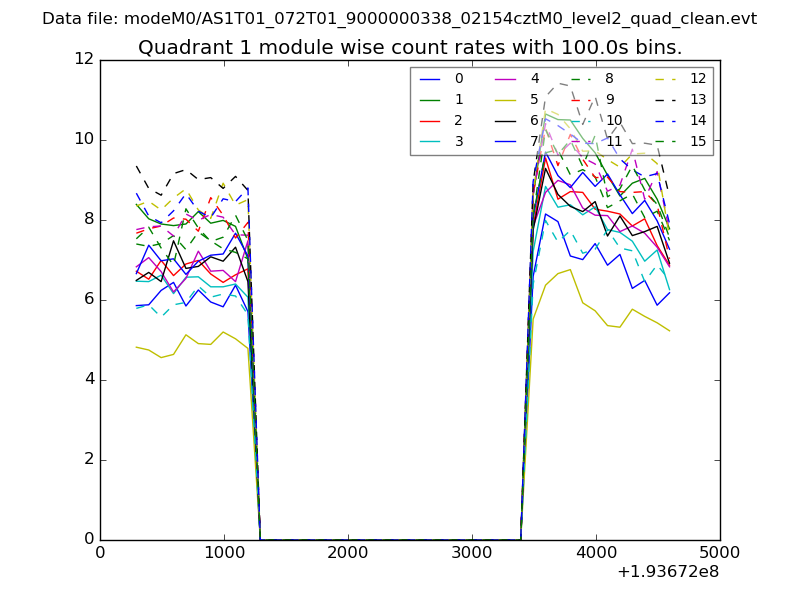
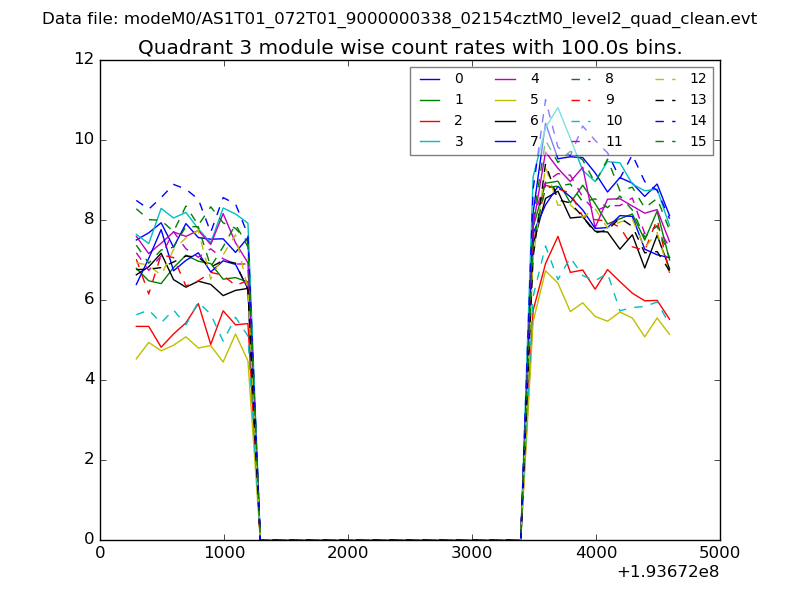
| Module-wise count rates for Quadrant B Data is divided into 100 sec bins |
 |
 |
| Module-wise count rates for Quadrant C Data is divided into 100 sec bins |
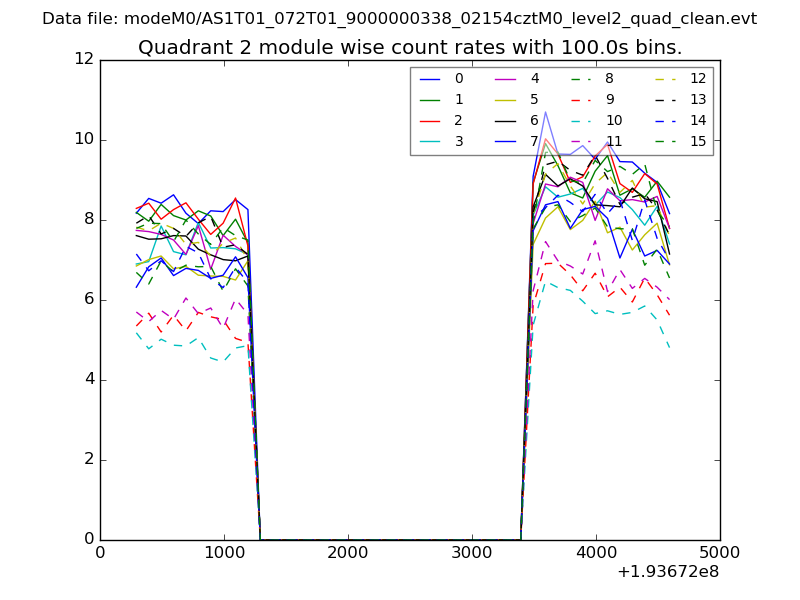 |
 |
| Module-wise count rates for Quadrant D Data is divided into 100 sec bins |
 |
 |
| Parameter | Plot |
|---|---|
| CZT HV Monitor | 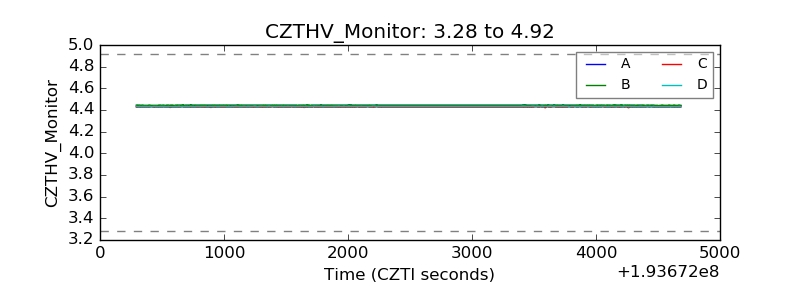 |
| D_VDD | 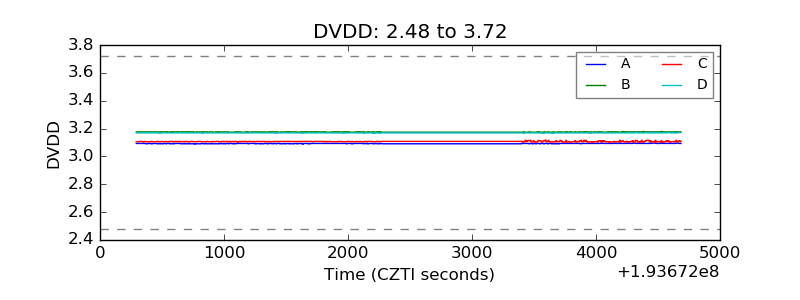 |
| Temperature 1 | 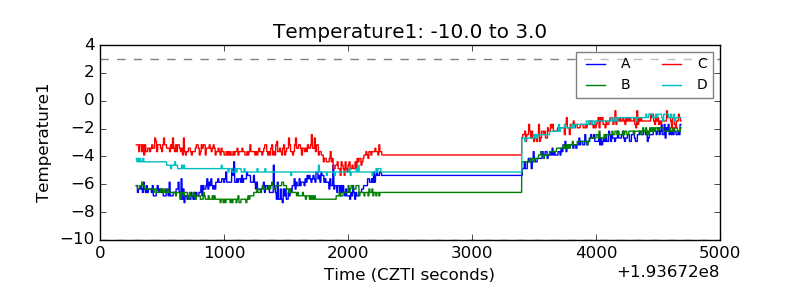 |
| Veto HV Monitor | 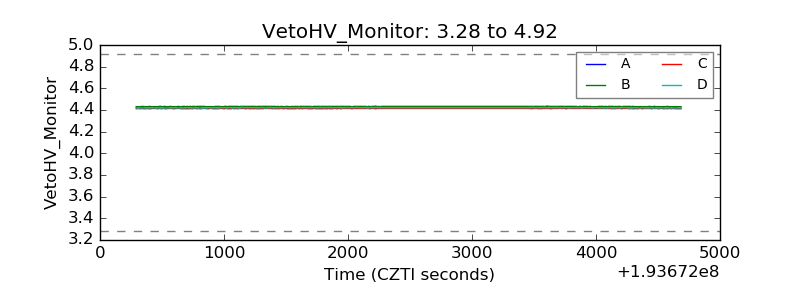 |
| Veto LLD | 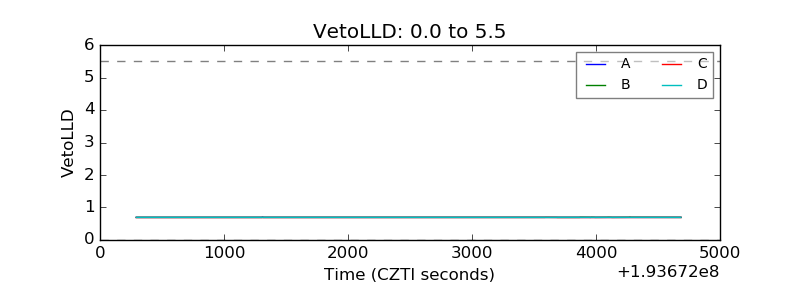 |
| Alpha Counter | 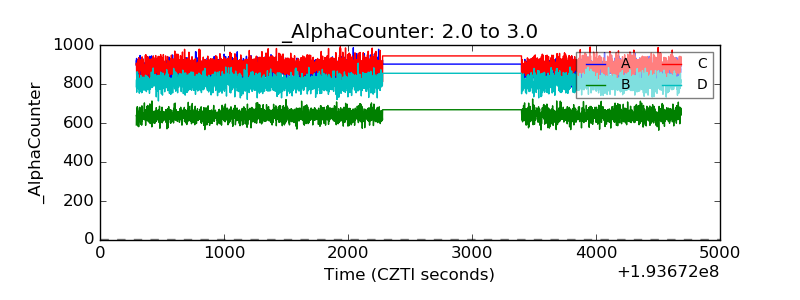 |
| _CPM_Rate | 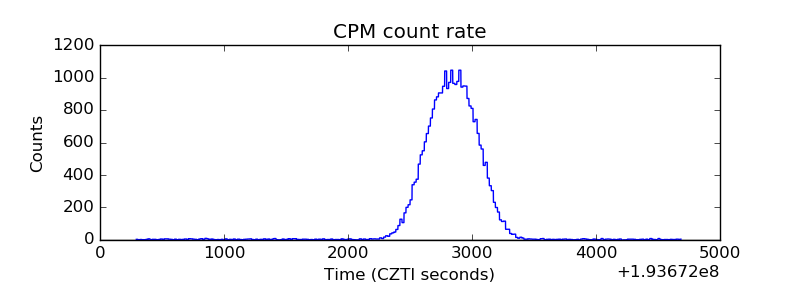 |
| CZT Counter | 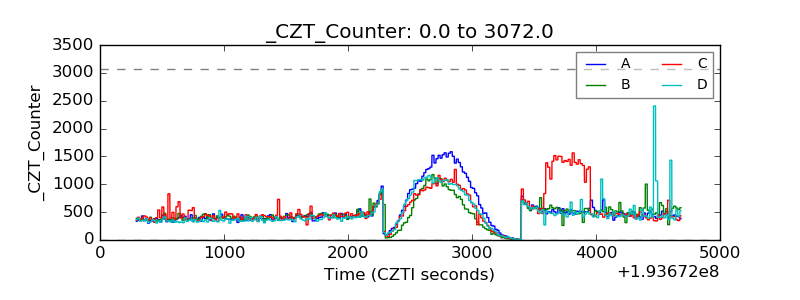 |
| +2.5 Volts monitor |  |
| +5 Volts monitor |  |
| _ROLL_ROT | 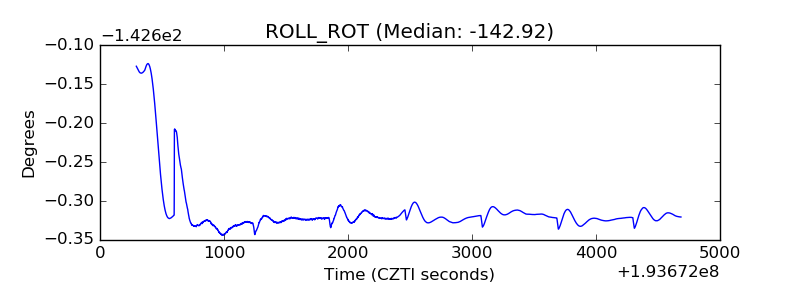 |
| _Roll_DEC | 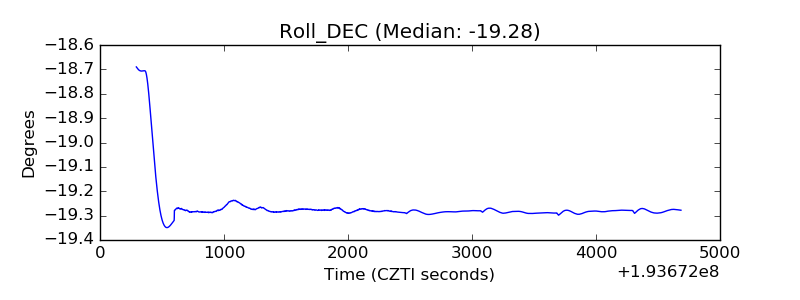 |
| _Roll_RA | 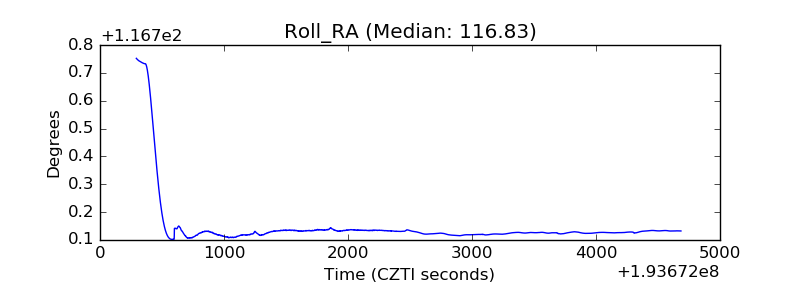 |
| Veto Counter | 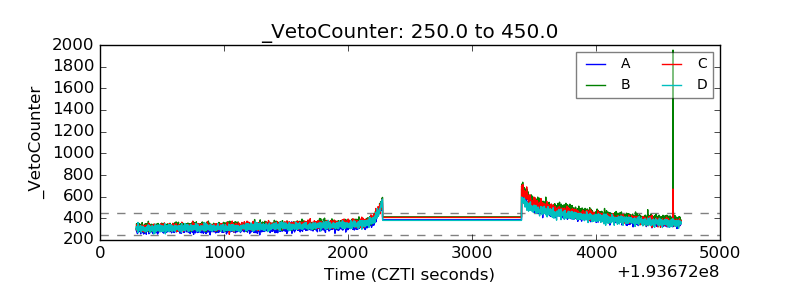 |