| Param | Original file | Final file |
|---|---|---|
| Filename | modeM0/AS1T01_072T03_9000000340cztM0_level2.fits | modeM0/AS1T01_072T03_9000000340cztM0_level2_quad_clean.evt |
| Size (bytes) | 1,074,510,720 | 1,058,762,880 |
| Size | 1.0 GB | 1009.7 MB |
| Events in quadrant A | 6,617,104 | 6,595,472 |
| Events in quadrant B | 6,354,436 | 6,407,668 |
| Events in quadrant C | 5,529,946 | 4,952,496 |
| Events in quadrant D | 5,248,690 | 5,337,922 |
| Mode M9 | |||
|---|---|---|---|
| Quadrant | BADHDUFLAG | Total packets | Discarded packets |
| A | 0 | 166 | 0 |
| B | 0 | 166 | 0 |
| C | 0 | 166 | 0 |
| D | 0 | 166 | 0 |
| Mode M0 | |||
|---|---|---|---|
| Quadrant | BADHDUFLAG | Total packets | Discarded packets |
| A | 0 | 287828 | 0 |
| B | 0 | 357898 | 0 |
| C | 0 | 445371 | 0 |
| D | 0 | 337318 | 0 |
| Mode SS | |||
|---|---|---|---|
| Quadrant | BADHDUFLAG | Total packets | Discarded packets |
| A | 0 | 2642 | 0 |
| B | 0 | 2642 | 0 |
| C | 0 | 2642 | 0 |
| D | 0 | 2642 | 0 |
| Quadrant | Total seconds | Saturated seconds | Saturation percentage |
|---|---|---|---|
| A | 129095 | 1585 | 1.227778% |
| B | 129298 | 6065 | 4.690714% |
| C | 129177 | 28558 | 22.107651% |
| D | 124311 | 10788 | 8.678234% |
Noise dominated data is calculated using 1-second bins in cleaned event files. If a bin has >2000 counts, and if more than 50% of those come from <1% of pixels, then it is considered to be noise-dominated and hence unusable.
| Quadrant | # 1 sec bins | Bins with >0 counts | Bins with >2000 counts | High rate bins dominated by noise | Noise dominated (total time) | Noise dominated (detector-on time) | Marked lightcurve |
|---|---|---|---|---|---|---|---|
| A | 146421 | 129091 | 0 | 0 | 0.00% | 0.00% | 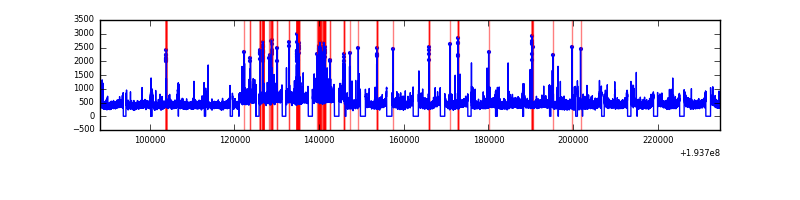 |
| B | 146421 | 129271 | 0 | 0 | 0.00% | 0.00% | 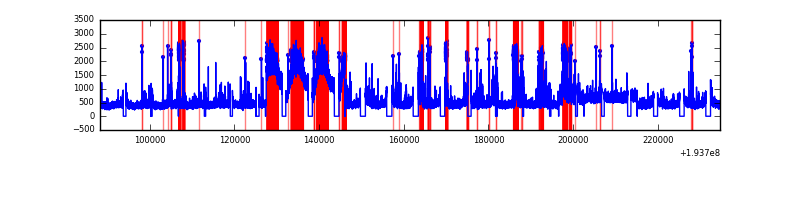 |
| C | 146421 | 128173 | 0 | 0 | 0.00% | 0.00% | 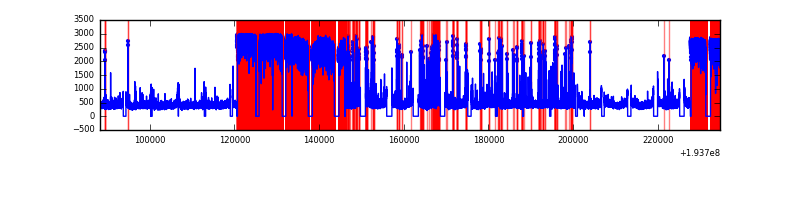 |
| D | 146421 | 124283 | 0 | 0 | 0.00% | 0.00% | 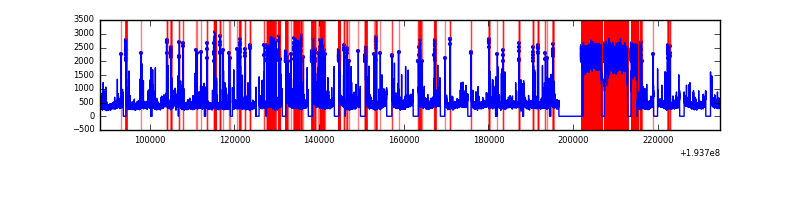 |
Top three noisy pixels from each quadrant. If the there are fewer than three noisy pixels in the level2.evt file, extra rows are filled as -1
| Pixel properties | Quadrant properties | ||||||
|---|---|---|---|---|---|---|---|
| Quadrant | DetID | PixID | Counts | Sigma | Mean | Median | Sigma |
| A | 14 | 188 | 6283 | 10.83 | 1717 | 1591 | 433.2 |
| A | 0 | 29 | 6231 | 10.71 | 1717 | 1591 | 433.2 |
| A | 7 | 110 | 5693 | 9.47 | 1717 | 1591 | 433.2 |
| B | 2 | 9 | 5542 | 12.49 | 1675 | 1584 | 317.0 |
| B | 10 | 225 | 4495 | 9.18 | 1675 | 1584 | 317.0 |
| B | 5 | 128 | 4452 | 9.05 | 1675 | 1584 | 317.0 |
| C | 4 | 226 | 4040 | 6.94 | 1473 | 1351 | 387.2 |
| C | 2 | 127 | 4028 | 6.91 | 1473 | 1351 | 387.2 |
| C | 1 | 81 | 3783 | 6.28 | 1473 | 1351 | 387.2 |
| D | 1 | 19 | 3903 | 6.65 | 1497 | 1360 | 382.3 |
| D | 6 | 231 | 3860 | 6.54 | 1497 | 1360 | 382.3 |
| D | 7 | 5 | 3830 | 6.46 | 1497 | 1360 | 382.3 |
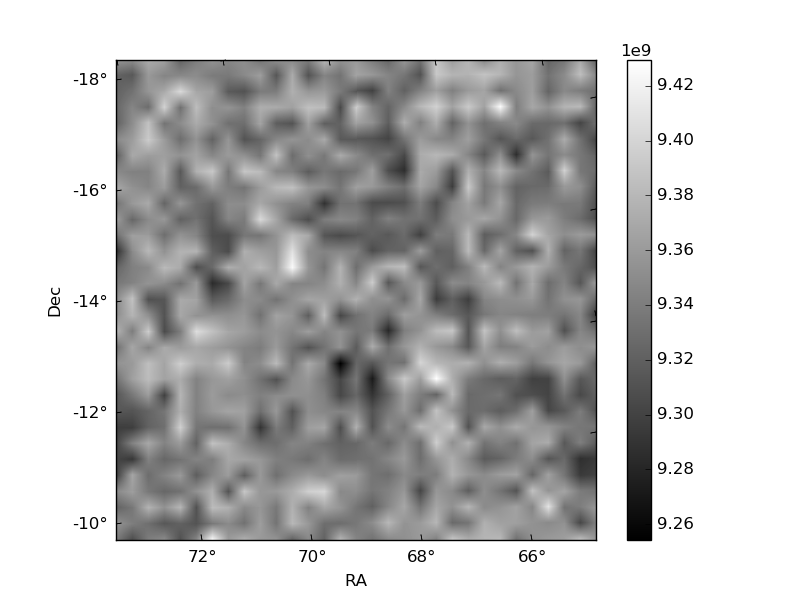
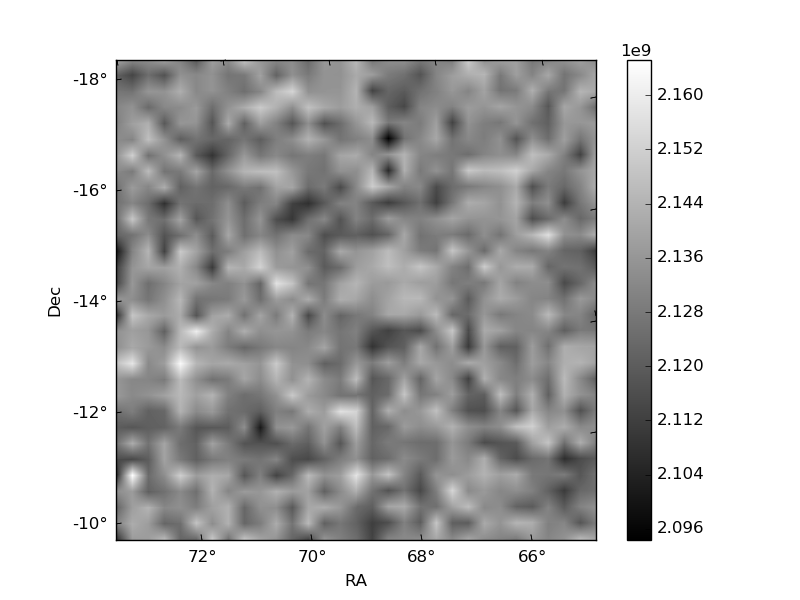
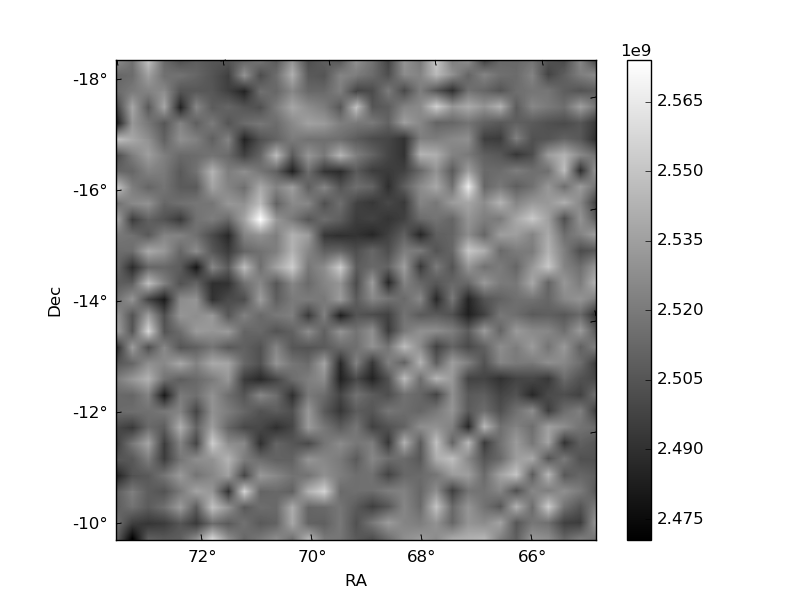
Histogram calculated using DETX and DETY for each event in the final _common_clean file
| Quadrant A | 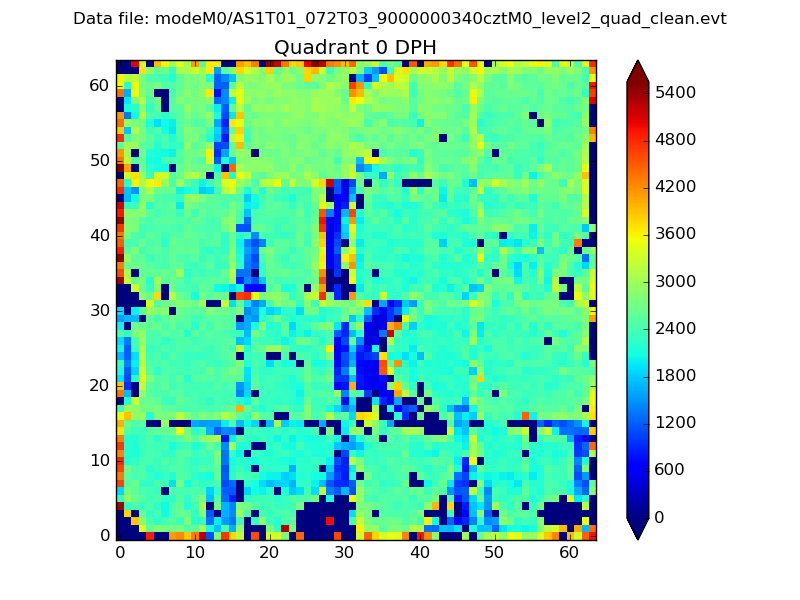 |
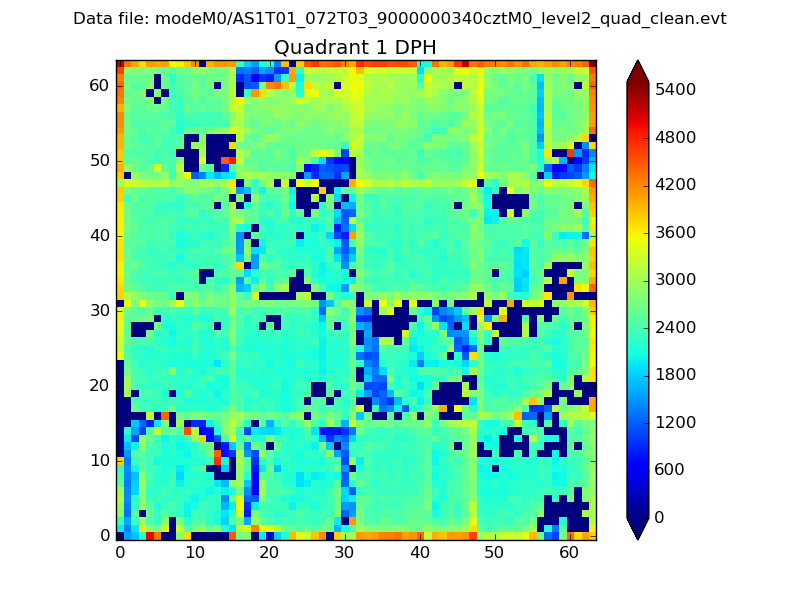 |
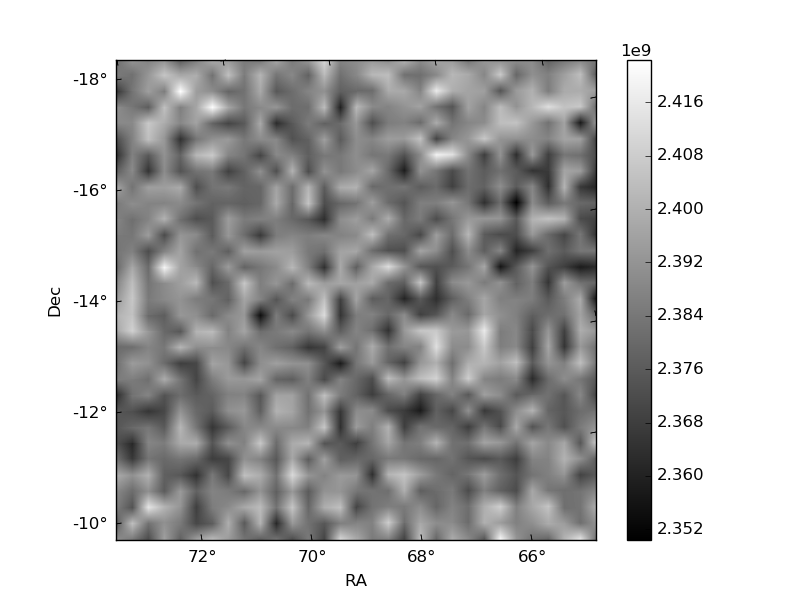
Quadrant B |
|---|---|---|---|
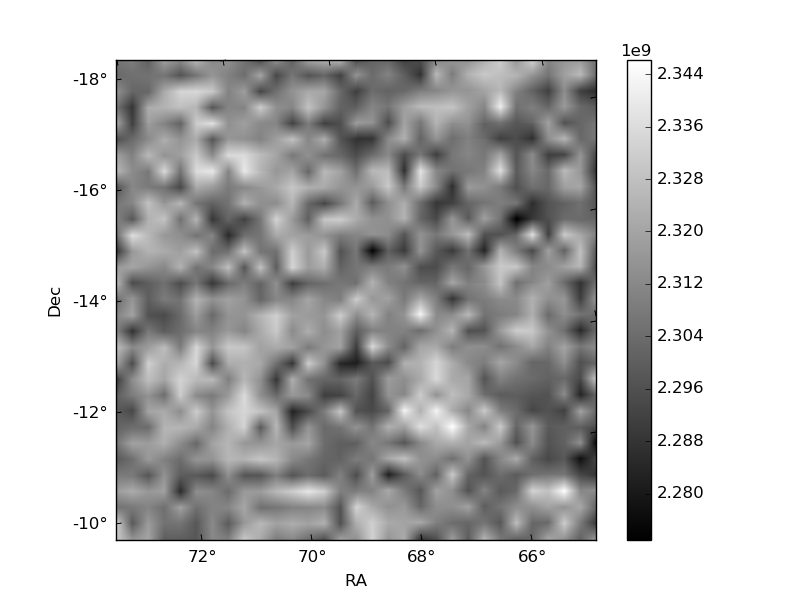
| Quadrant D | 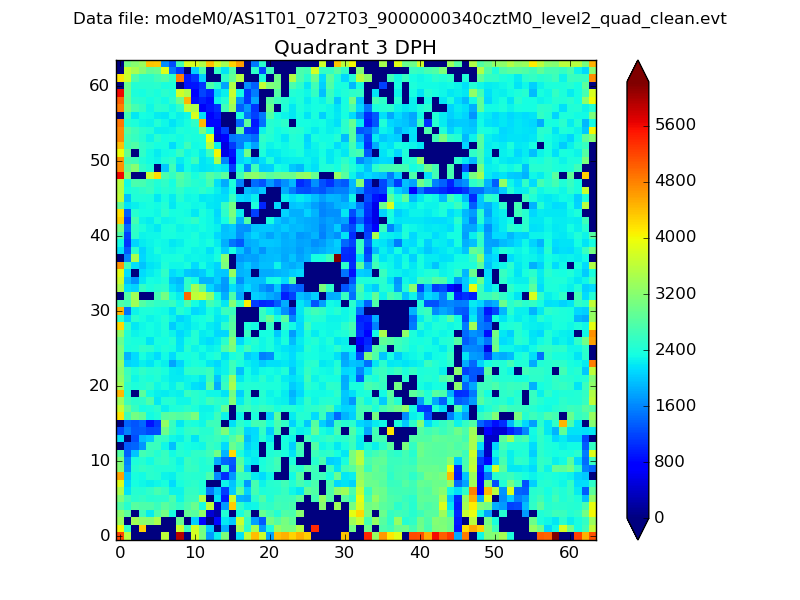 |
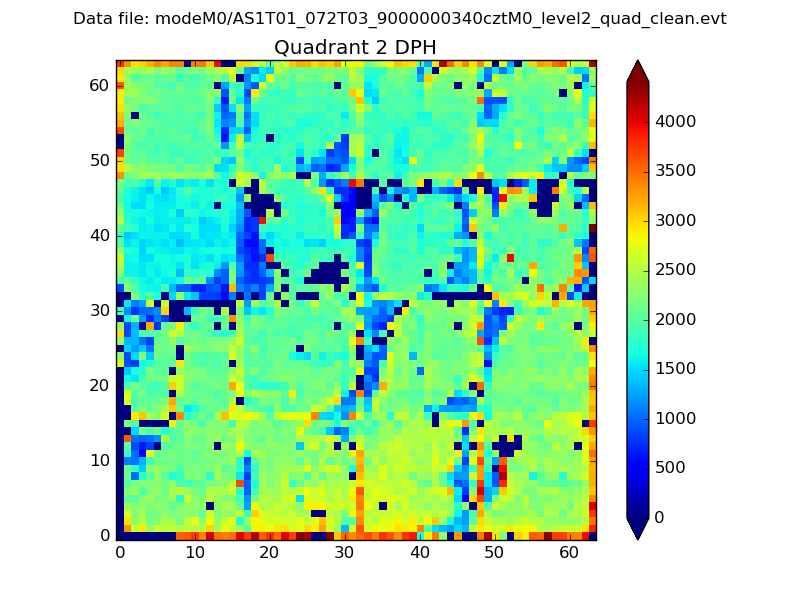 |
Quadrant C |
| Plot type | Count rate plots | Images |
|---|---|---|
| Comparison with Poisson distribution Blue bars denote a histogram of data divided into 1 sec bins. Red curve is a Poisson curve with rate = median count rate of data. |
 |
 |
| Quadrant-wise count rates Data is divided into 100 sec bins |
 |
|
| Module-wise count rates for Quadrant A Data is divided into 100 sec bins |
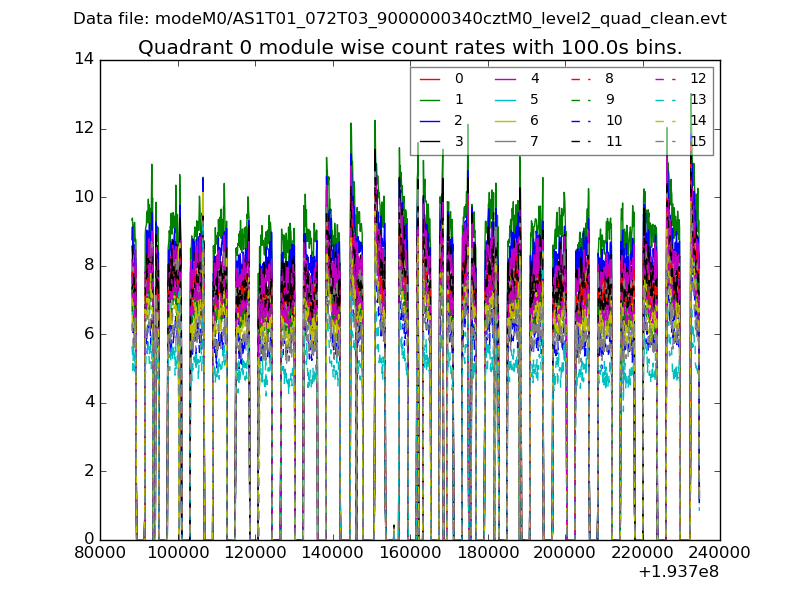 |
 |
| Module-wise count rates for Quadrant B Data is divided into 100 sec bins |
 |
 |
| Module-wise count rates for Quadrant C Data is divided into 100 sec bins |
 |
 |
| Module-wise count rates for Quadrant D Data is divided into 100 sec bins |
 |
 |
| Parameter | Plot |
|---|---|
| CZT HV Monitor |  |
| D_VDD | 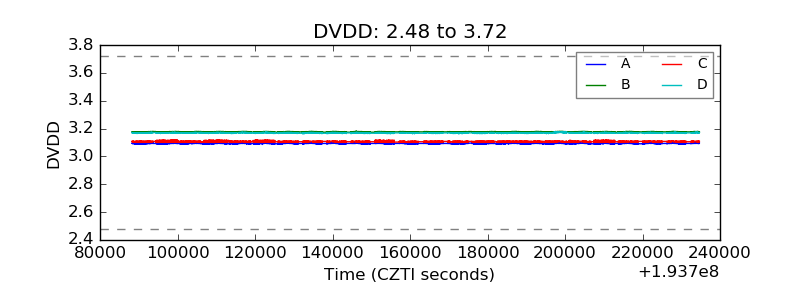 |
| Temperature 1 | 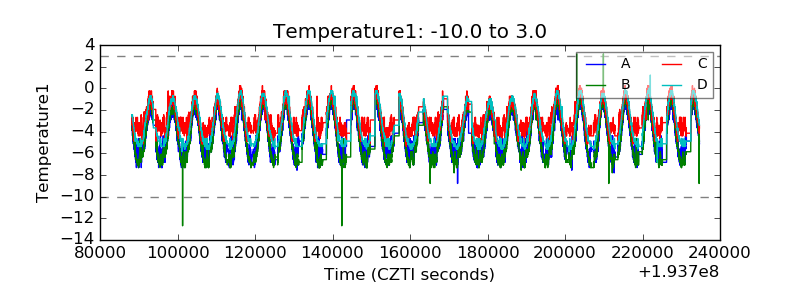 |
| Veto HV Monitor | 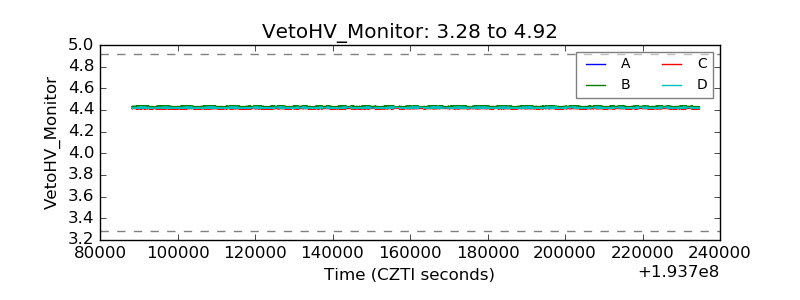 |
| Veto LLD | 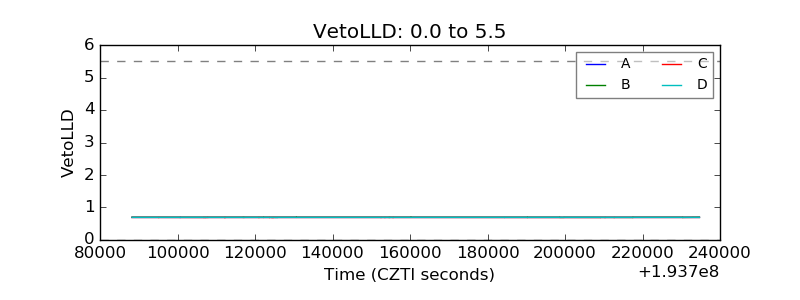 |
| Alpha Counter |  |
| _CPM_Rate | 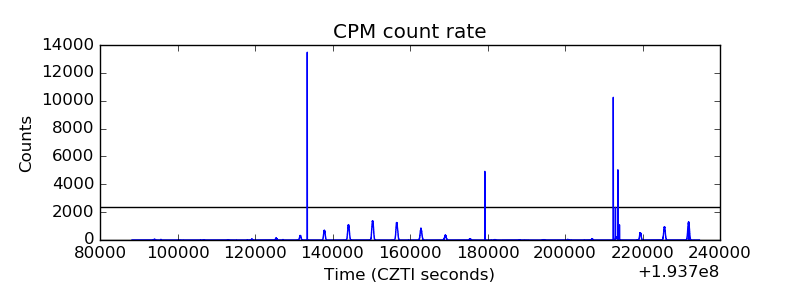 |
| CZT Counter | 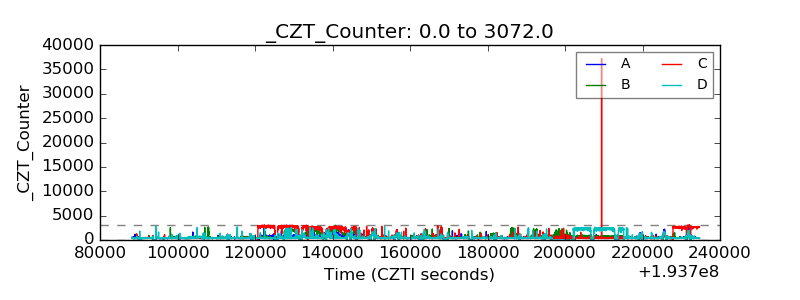 |
| +2.5 Volts monitor | 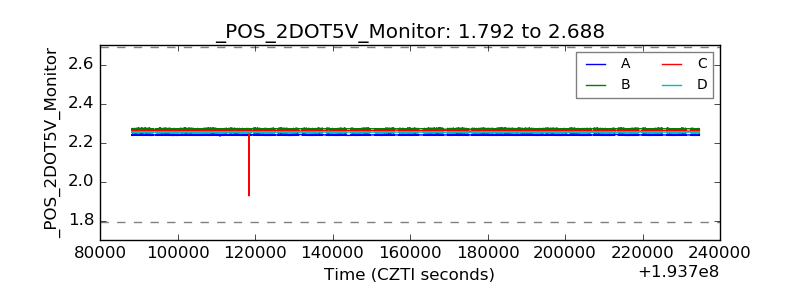 |
| +5 Volts monitor | 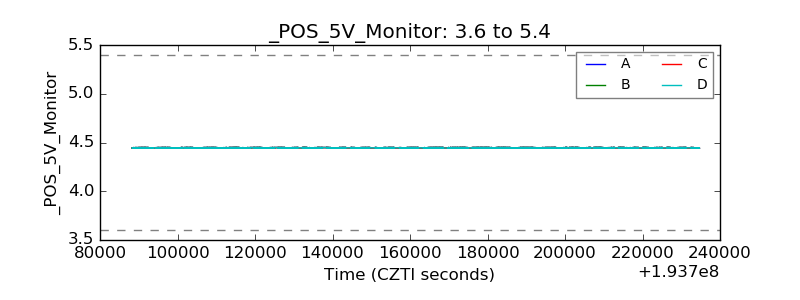 |
| _ROLL_ROT | 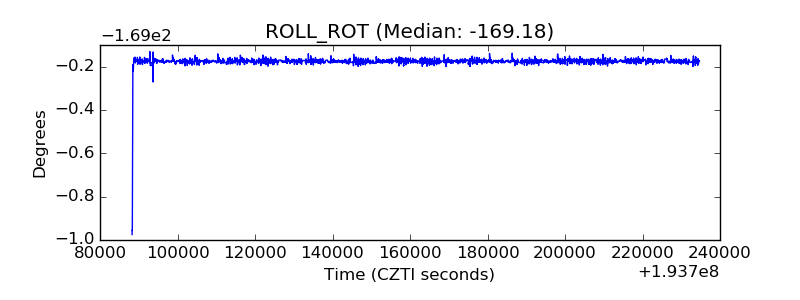 |
| _Roll_DEC | 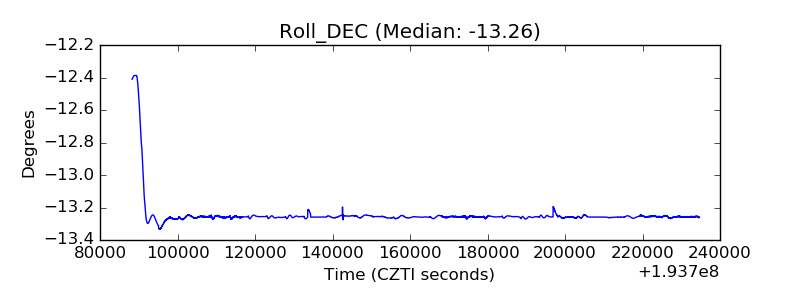 |
| _Roll_RA | 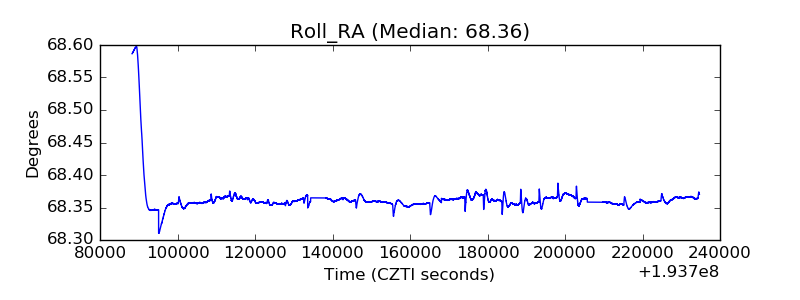 |
| Veto Counter |  |