| Param | Original file | Final file |
|---|---|---|
| Filename | modeM0/AS1T01_072T03_9000000340_02190cztM0_level2.evt | modeM0/AS1T01_072T03_9000000340_02190cztM0_level2_quad_clean.evt |
| Size (bytes) | 533,154,240 | 117,705,600 |
| Size | 508.5 MB | 112.3 MB |
| Events in quadrant A | 3,501,021 | 762,045 |
| Events in quadrant B | 4,803,836 | 754,208 |
| Events in quadrant C | 3,729,296 | 767,625 |
| Events in quadrant D | 3,585,779 | 741,318 |
| Mode M9 | |||
|---|---|---|---|
| Quadrant | BADHDUFLAG | Total packets | Discarded packets |
| A | 0 | 1 | 0 |
| B | 0 | 1 | 0 |
| C | 0 | 1 | 0 |
| D | 0 | 1 | 0 |
| Mode M0 | |||
|---|---|---|---|
| Quadrant | BADHDUFLAG | Total packets | Discarded packets |
| A | 0 | 16194 | 3 |
| B | 0 | 19868 | 2 |
| C | 0 | 16737 | 2 |
| D | 0 | 16415 | 2 |
| Mode SS | |||
|---|---|---|---|
| Quadrant | BADHDUFLAG | Total packets | Discarded packets |
| A | 0 | 158 | 0 |
| B | 0 | 158 | 0 |
| C | 0 | 158 | 0 |
| D | 0 | 158 | 0 |
| Quadrant | Total seconds | Saturated seconds | Saturation percentage |
|---|---|---|---|
| A | 7760 | 95 | 1.224227% |
| B | 7760 | 585 | 7.538660% |
| C | 7760 | 110 | 1.417526% |
| D | 7760 | 61 | 0.786082% |
Noise dominated data is calculated using 1-second bins in cleaned event files. If a bin has >2000 counts, and if more than 50% of those come from <1% of pixels, then it is considered to be noise-dominated and hence unusable.
| Quadrant | # 1 sec bins | Bins with >0 counts | Bins with >2000 counts | High rate bins dominated by noise | Noise dominated (total time) | Noise dominated (detector-on time) | Marked lightcurve |
|---|---|---|---|---|---|---|---|
| A | 7924 | 7760 | 0 | 0 | 0.00% | 0.00% | 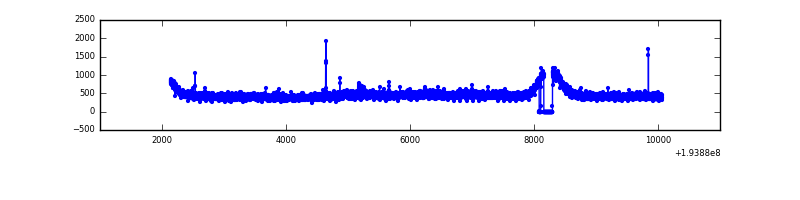 |
| B | 7925 | 7761 | 379 | 379 | 4.78% | 4.88% | 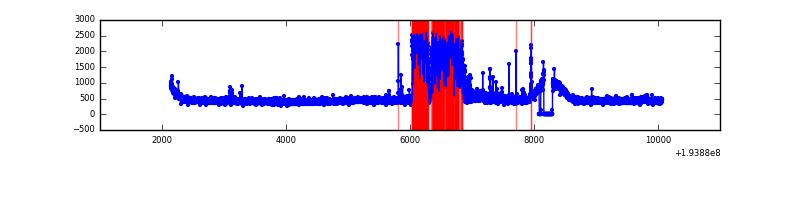 |
| C | 7925 | 7762 | 29 | 29 | 0.37% | 0.37% | 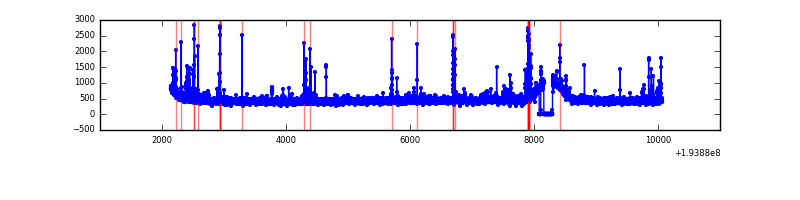 |
| D | 7925 | 7762 | 9 | 9 | 0.11% | 0.12% | 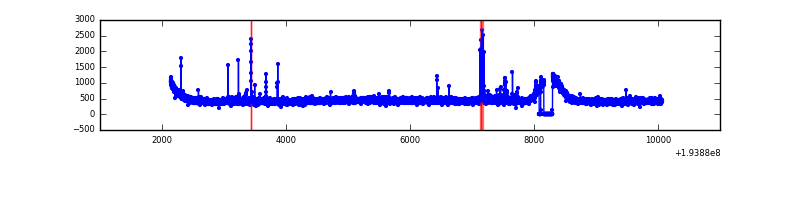 |
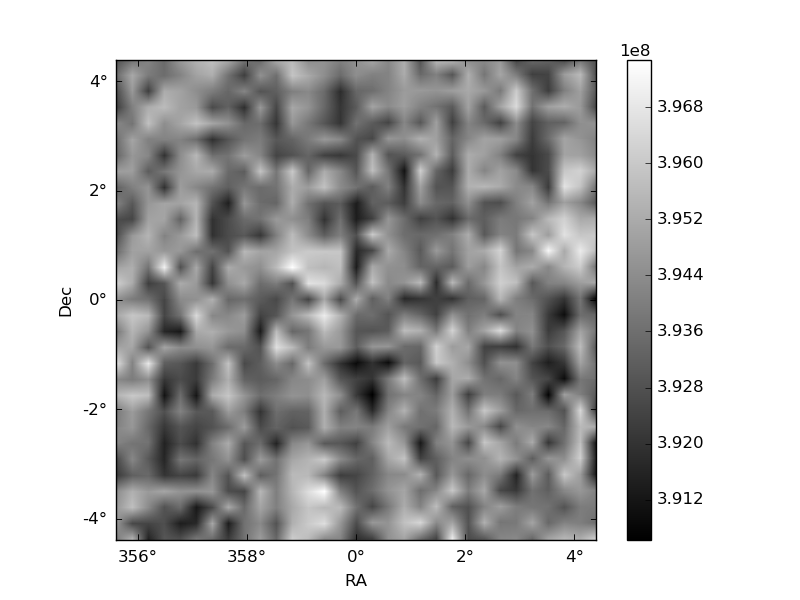
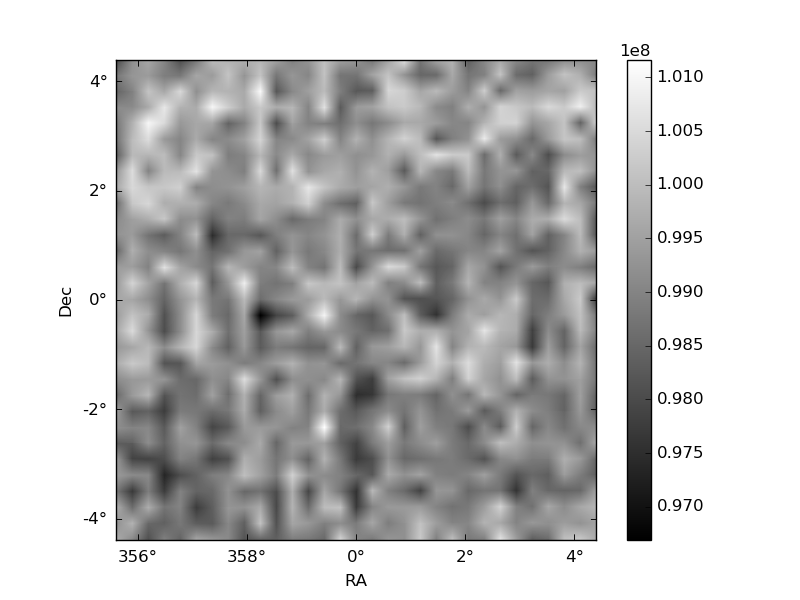
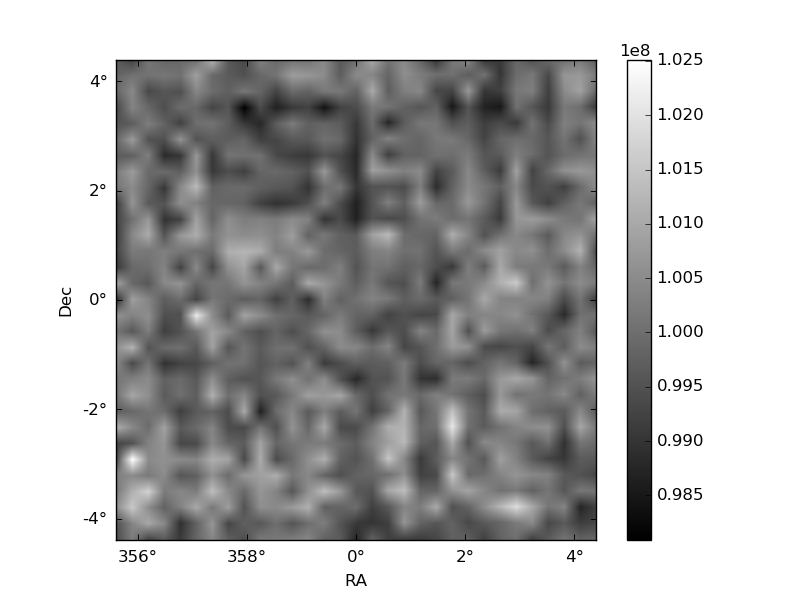
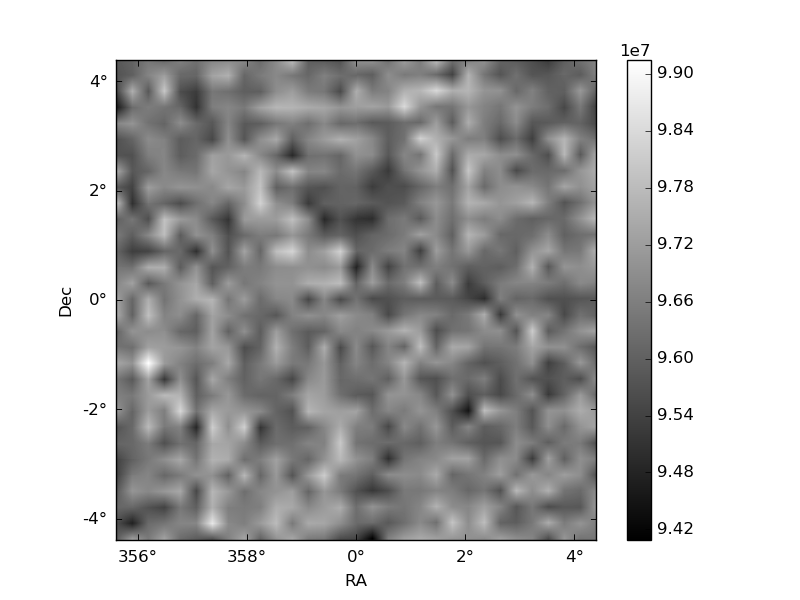
Histogram calculated using DETX and DETY for each event in the final _common_clean file
| Quadrant A | 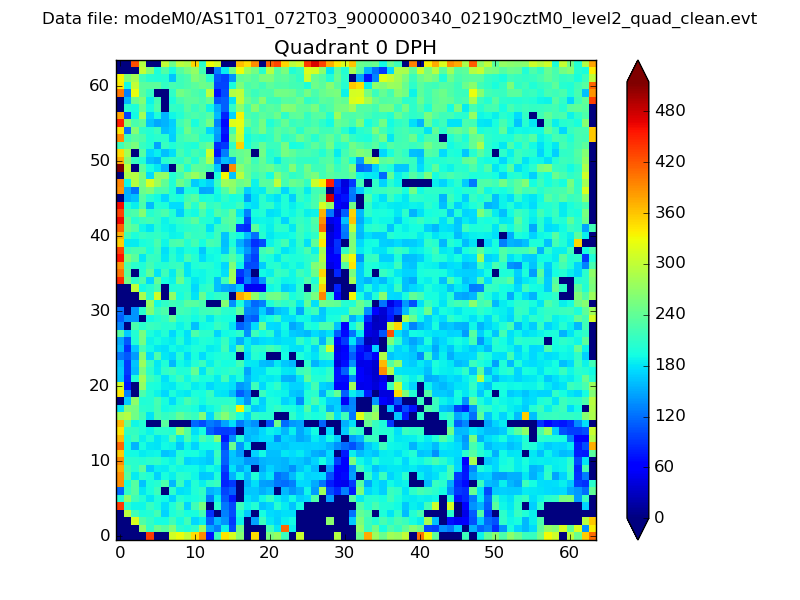 |
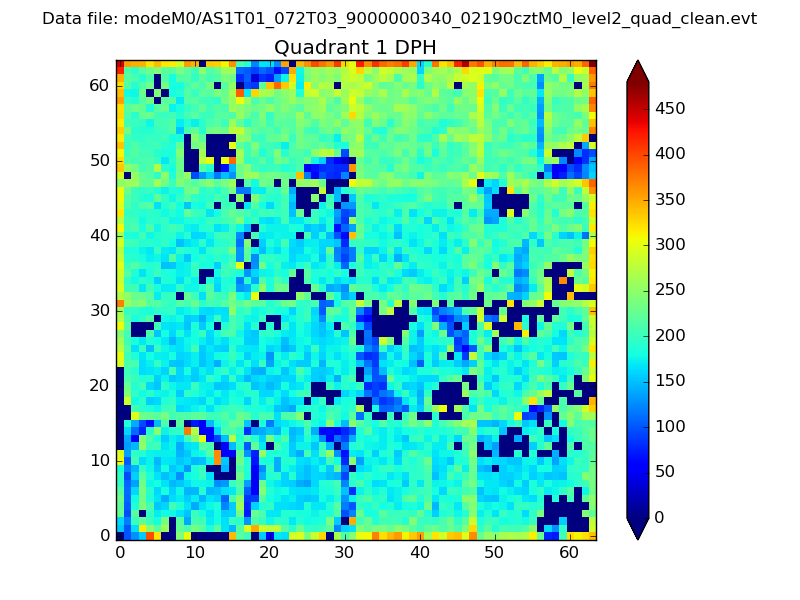 |
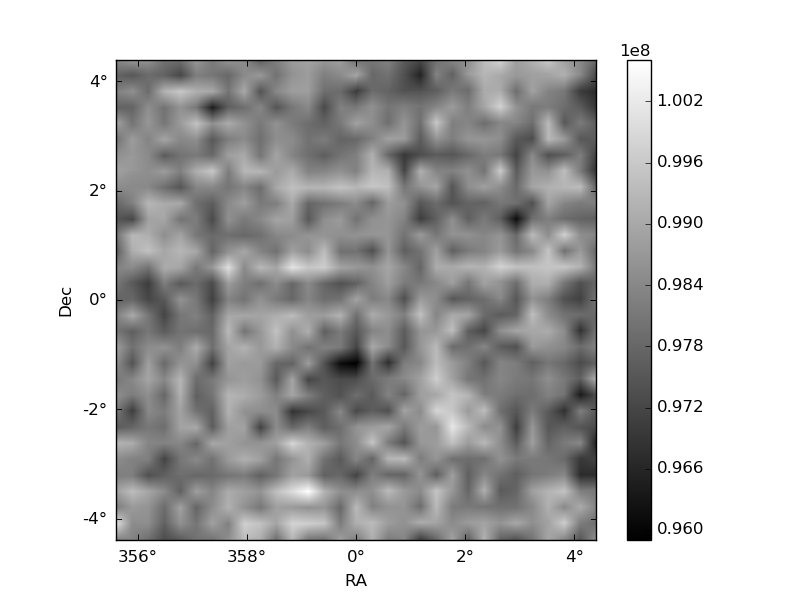
Quadrant B |
|---|---|---|---|
| Quadrant D | 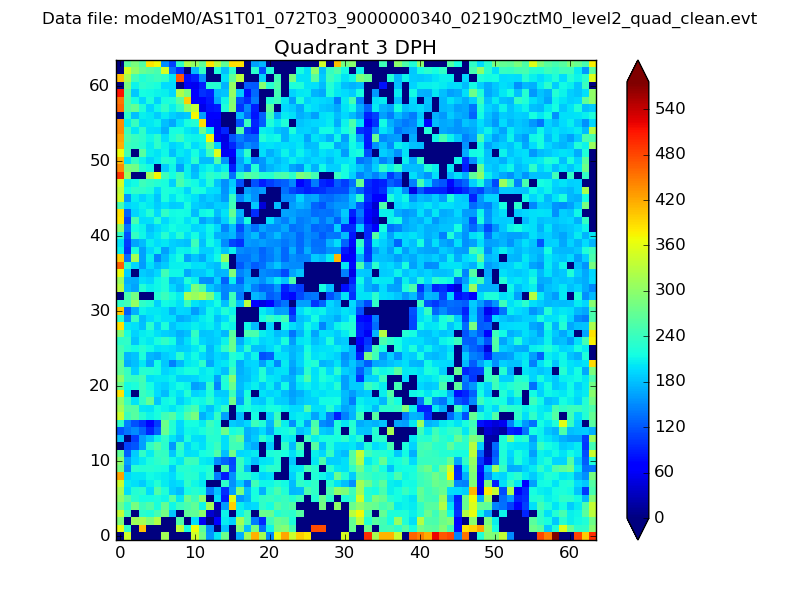 |
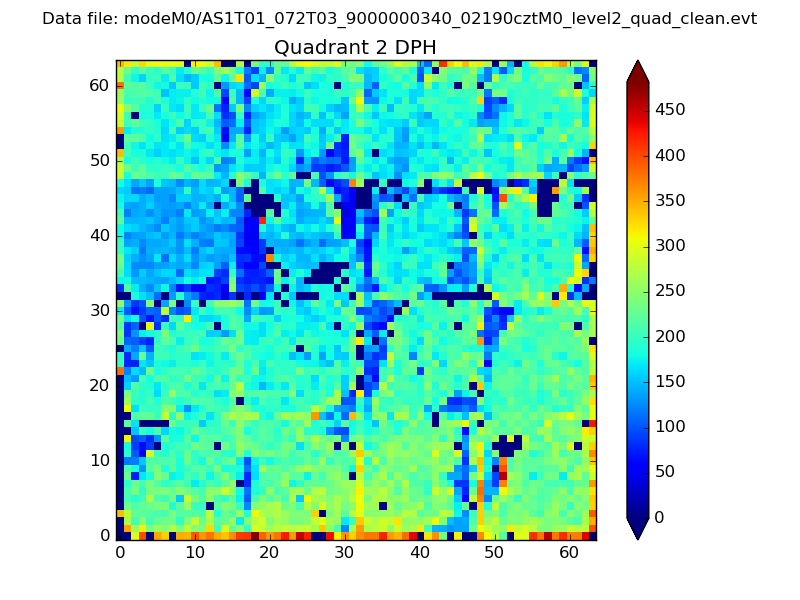 |
Quadrant C |
| Plot type | Count rate plots | Images |
|---|---|---|
| Comparison with Poisson distribution Blue bars denote a histogram of data divided into 1 sec bins. Red curve is a Poisson curve with rate = median count rate of data. |
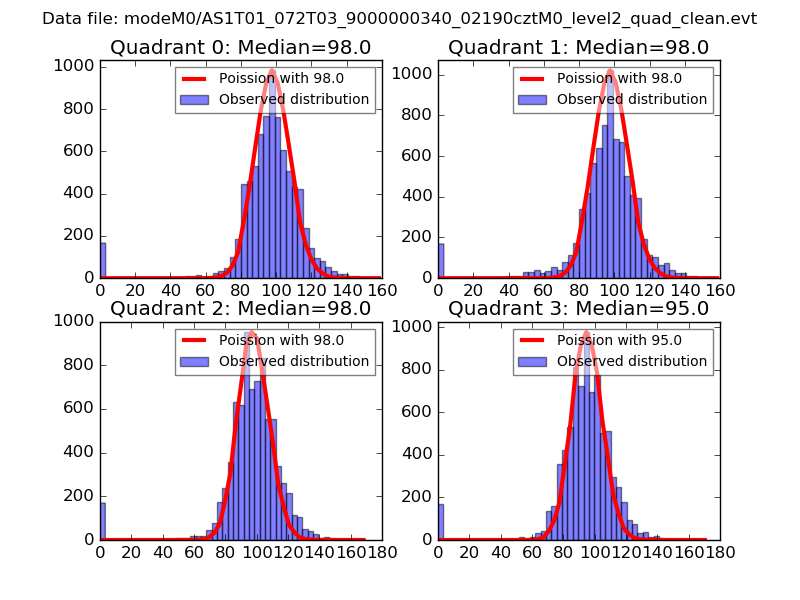 |
 |
| Quadrant-wise count rates Data is divided into 100 sec bins |
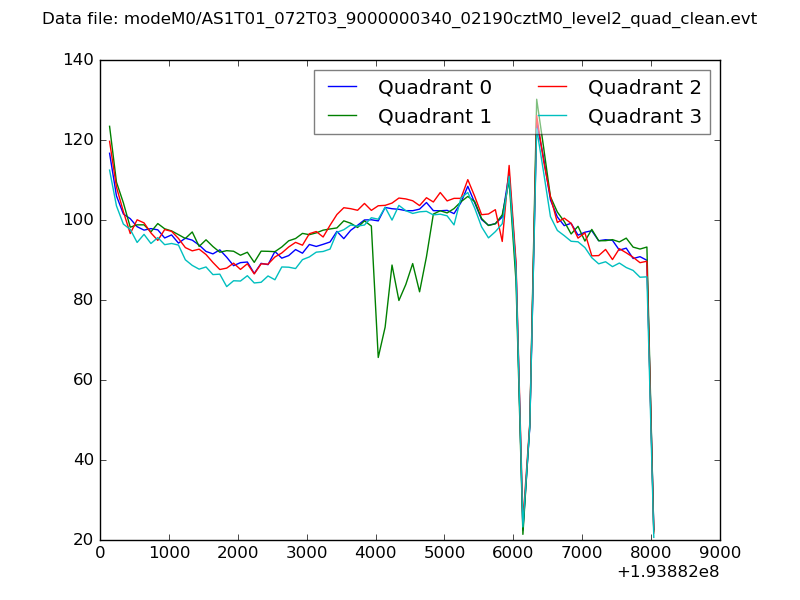 |
|
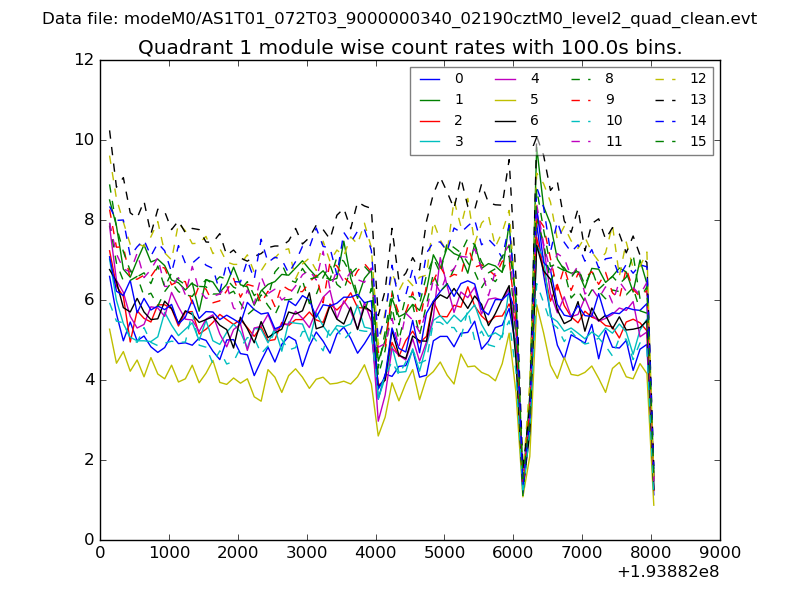
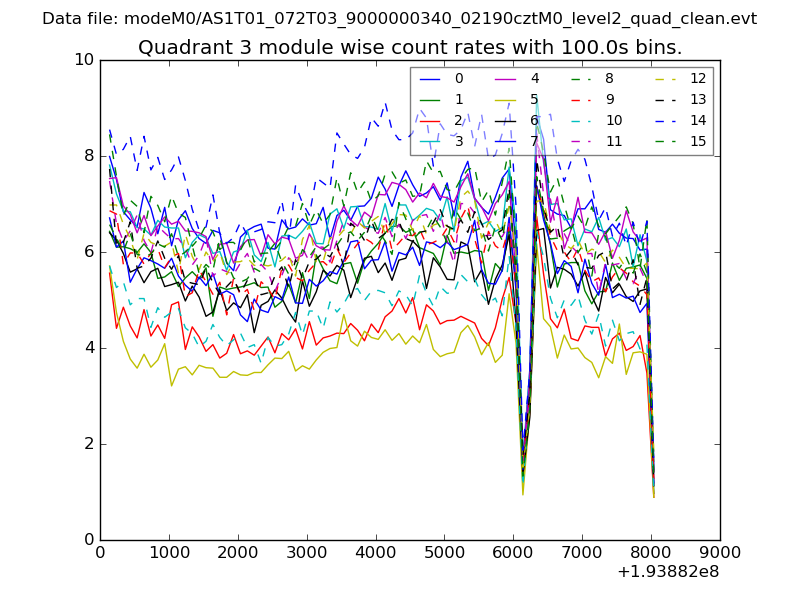
| Module-wise count rates for Quadrant A Data is divided into 100 sec bins |
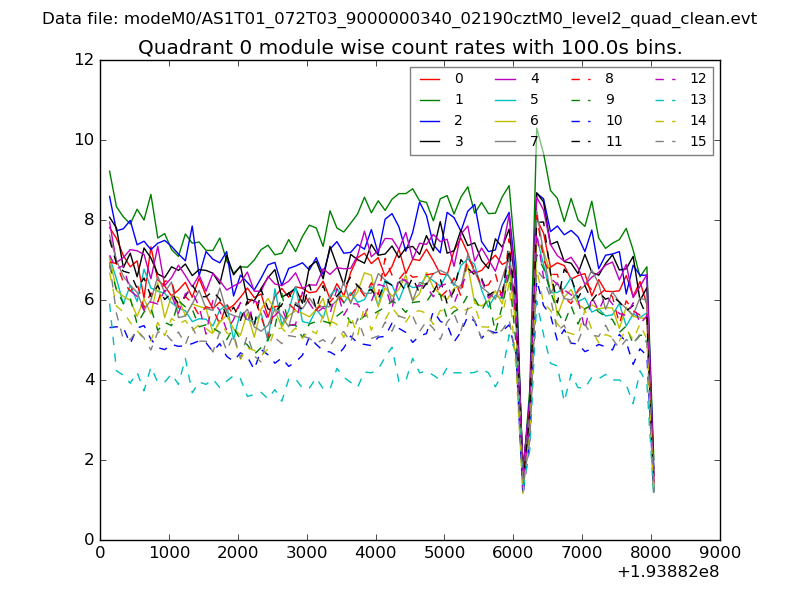 |
 |
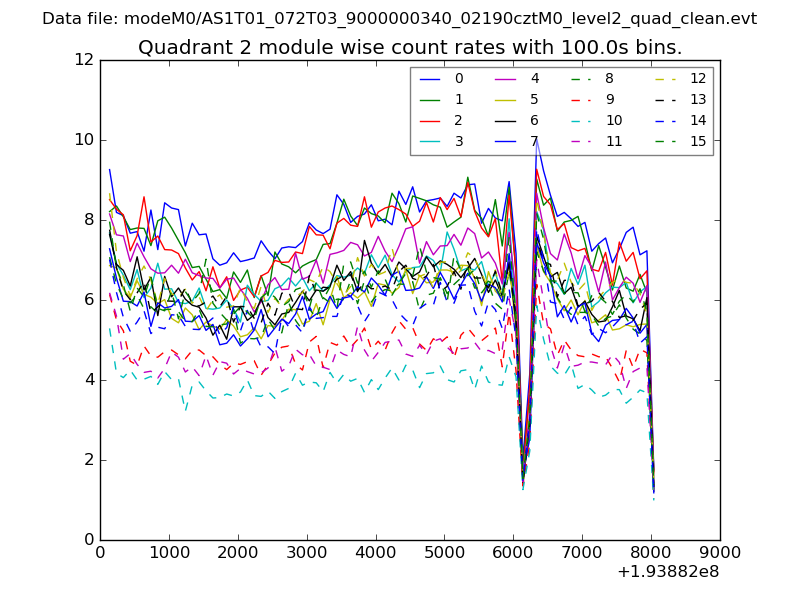
| Module-wise count rates for Quadrant B Data is divided into 100 sec bins |
 |
 |
| Module-wise count rates for Quadrant C Data is divided into 100 sec bins |
 |
 |
| Module-wise count rates for Quadrant D Data is divided into 100 sec bins |
 |
 |
| Parameter | Plot |
|---|---|
| CZT HV Monitor | 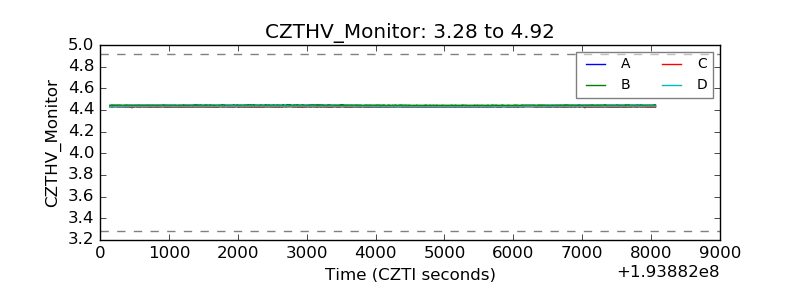 |
| D_VDD | 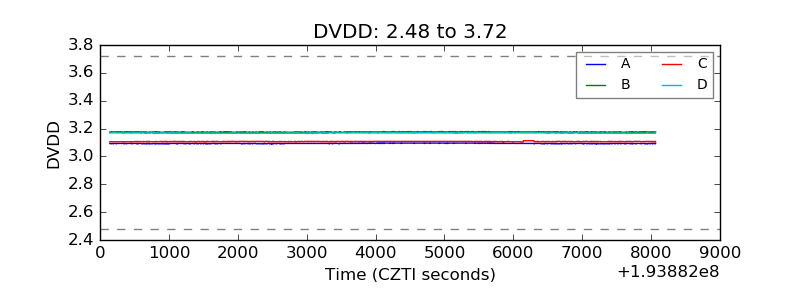 |
| Temperature 1 | 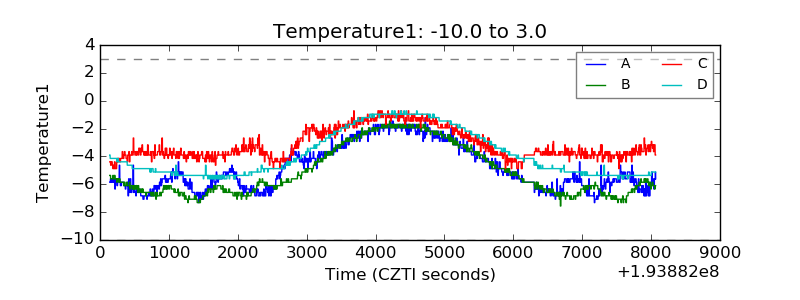 |
| Veto HV Monitor | 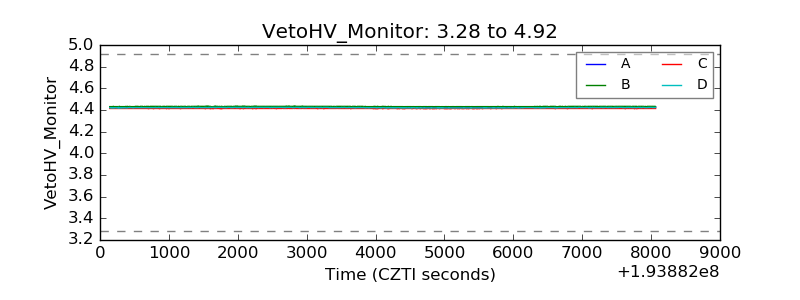 |
| Veto LLD | 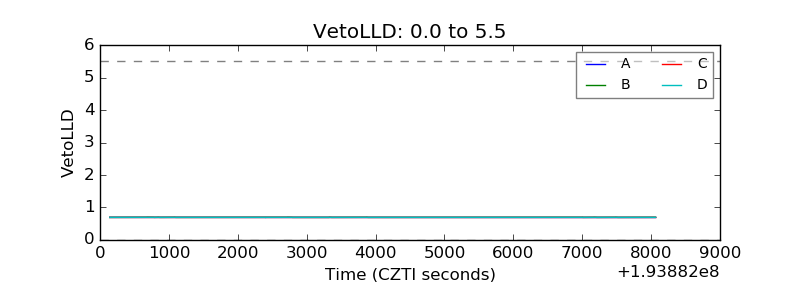 |
| Alpha Counter | 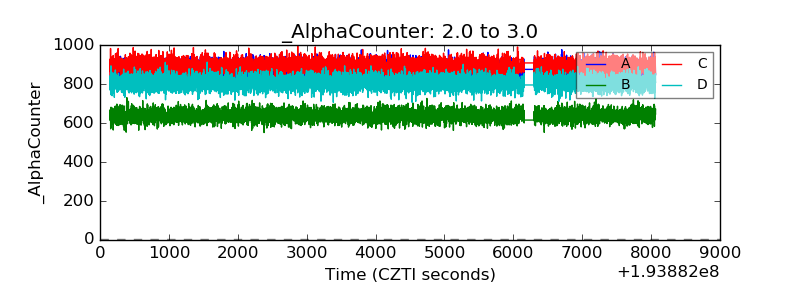 |
| _CPM_Rate | 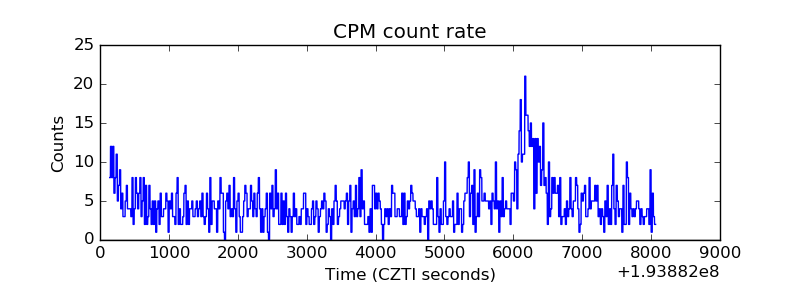 |
| CZT Counter | 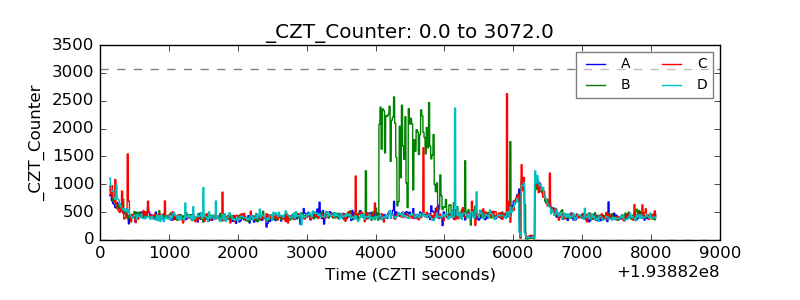 |
| +2.5 Volts monitor |  |
| +5 Volts monitor |  |
| _ROLL_ROT | 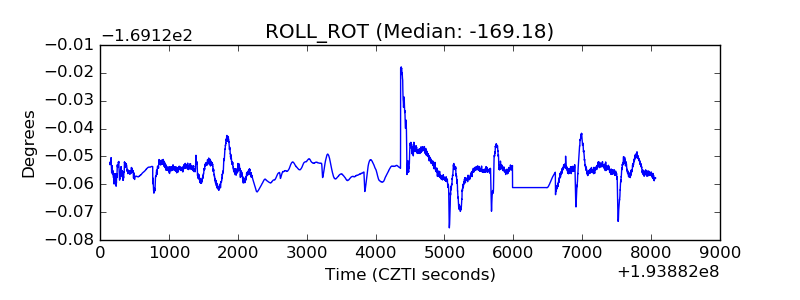 |
| _Roll_DEC | 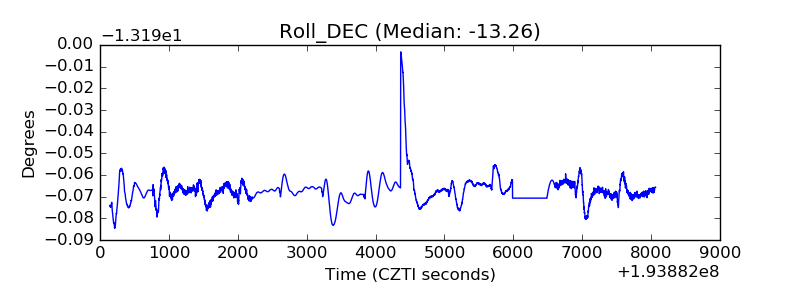 |
| _Roll_RA | 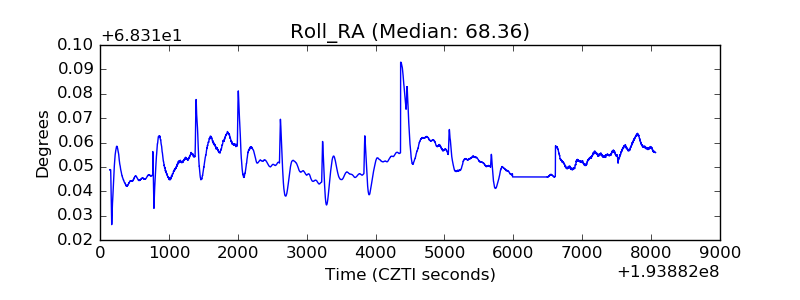 |
| Veto Counter | 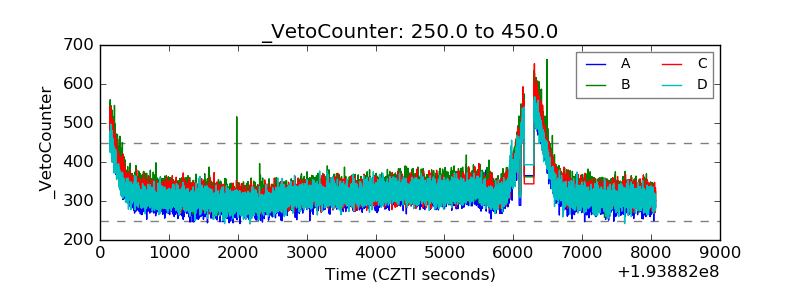 |