| Param | Original file | Final file |
|---|---|---|
| Filename | modeM0/AS1T01_072T04_9000000342cztM0_level2.fits | modeM0/AS1T01_072T04_9000000342cztM0_level2_quad_clean.evt |
| Size (bytes) | 537,088,320 | 530,421,120 |
| Size | 512.2 MB | 505.8 MB |
| Events in quadrant A | 3,511,772 | 3,445,852 |
| Events in quadrant B | 3,409,600 | 3,674,363 |
| Events in quadrant C | 1,334,074 | 738,638 |
| Events in quadrant D | 2,603,058 | 2,844,940 |
| Mode M0 | |||
|---|---|---|---|
| Quadrant | BADHDUFLAG | Total packets | Discarded packets |
| A | 0 | 232989 | 0 |
| B | 0 | 219295 | 0 |
| C | 0 | 530577 | 0 |
| D | 0 | 270327 | 0 |
| Mode SS | |||
|---|---|---|---|
| Quadrant | BADHDUFLAG | Total packets | Discarded packets |
| A | 0 | 1578 | 0 |
| B | 0 | 1578 | 0 |
| C | 0 | 1578 | 0 |
| D | 0 | 1578 | 0 |
| Mode M9 | |||
|---|---|---|---|
| Quadrant | BADHDUFLAG | Total packets | Discarded packets |
| A | 0 | 16 | 0 |
| B | 0 | 15 | 0 |
| C | 0 | 15 | 0 |
| D | 0 | 18 | 0 |
| Quadrant | Total seconds | Saturated seconds | Saturation percentage |
|---|---|---|---|
| A | 78094 | 12535 | 16.051169% |
| B | 78042 | 10136 | 12.987878% |
| C | 78255 | 61072 | 78.042298% |
| D | 78132 | 16465 | 21.073312% |
Noise dominated data is calculated using 1-second bins in cleaned event files. If a bin has >2000 counts, and if more than 50% of those come from <1% of pixels, then it is considered to be noise-dominated and hence unusable.
| Quadrant | # 1 sec bins | Bins with >0 counts | Bins with >2000 counts | High rate bins dominated by noise | Noise dominated (total time) | Noise dominated (detector-on time) | Marked lightcurve |
|---|---|---|---|---|---|---|---|
| A | 91324 | 77986 | 0 | 0 | 0.00% | 0.00% |  |
| B | 91324 | 77943 | 0 | 0 | 0.00% | 0.00% |  |
| C | 91325 | 62239 | 0 | 0 | 0.00% | 0.00% |  |
| D | 91324 | 73416 | 0 | 0 | 0.00% | 0.00% |  |
Top three noisy pixels from each quadrant. If the there are fewer than three noisy pixels in the level2.evt file, extra rows are filled as -1
| Pixel properties | Quadrant properties | ||||||
|---|---|---|---|---|---|---|---|
| Quadrant | DetID | PixID | Counts | Sigma | Mean | Median | Sigma |
| A | 5 | 61 | 4212 | 13.58 | 933 | 867 | 246.3 |
| A | 0 | 29 | 3479 | 10.6 | 933 | 867 | 246.3 |
| A | 14 | 188 | 3270 | 9.76 | 933 | 867 | 246.3 |
| B | 2 | 61 | 3624 | 15.06 | 916 | 868 | 183.0 |
| B | 2 | 9 | 3115 | 12.28 | 916 | 868 | 183.0 |
| B | 1 | 226 | 2783 | 10.46 | 916 | 868 | 183.0 |
| C | 0 | 226 | 1599 | 9.74 | 365 | 331 | 130.1 |
| C | 13 | 226 | 1546 | 9.34 | 365 | 331 | 130.1 |
| C | 0 | 61 | 1285 | 7.33 | 365 | 331 | 130.1 |
| D | 11 | 82 | 2089 | 6.83 | 763 | 689 | 205.1 |
| D | 8 | 61 | 2081 | 6.79 | 763 | 689 | 205.1 |
| D | 6 | 231 | 2058 | 6.68 | 763 | 689 | 205.1 |
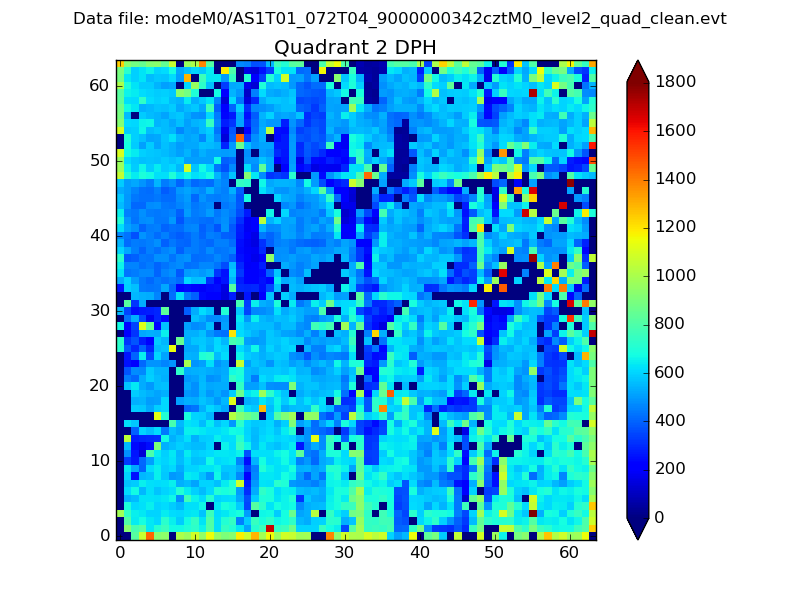
Histogram calculated using DETX and DETY for each event in the final _common_clean file
| Quadrant A |  |
 |
Quadrant B |
|---|---|---|---|
| Quadrant D |  |
 |
Quadrant C |
| Plot type | Count rate plots | Images |
|---|---|---|
| Comparison with Poisson distribution Blue bars denote a histogram of data divided into 1 sec bins. Red curve is a Poisson curve with rate = median count rate of data. |
 |
 |
| Quadrant-wise count rates Data is divided into 100 sec bins |
 |
|
| Module-wise count rates for Quadrant A Data is divided into 100 sec bins |
 |
 |
| Module-wise count rates for Quadrant B Data is divided into 100 sec bins |
 |
 |
| Module-wise count rates for Quadrant C Data is divided into 100 sec bins |
 |
 |
| Module-wise count rates for Quadrant D Data is divided into 100 sec bins |
 |
 |
| Parameter | Plot |
|---|---|
| CZT HV Monitor |  |
| D_VDD | 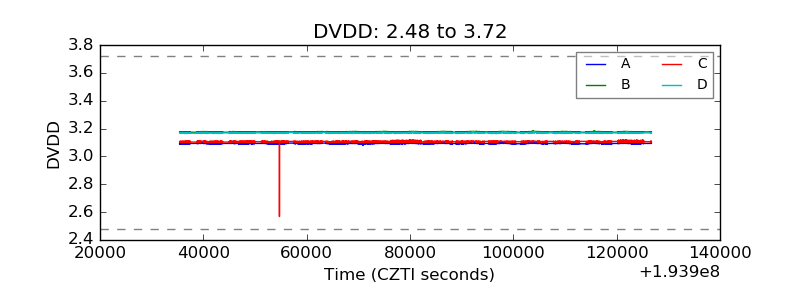 |
| Temperature 1 |  |
| Veto HV Monitor |  |
| Veto LLD |  |
| Alpha Counter |  |
| _CPM_Rate |  |
| CZT Counter |  |
| +2.5 Volts monitor |  |
| +5 Volts monitor |  |
| _ROLL_ROT |  |
| _Roll_DEC |  |
| _Roll_RA |  |
| Veto Counter |  |