| Param | Original file | Final file |
|---|---|---|
| Filename | modeM0/AS1T01_072T04_9000000342_02199cztM0_level2.evt | modeM0/AS1T01_072T04_9000000342_02199cztM0_level2_quad_clean.evt |
| Size (bytes) | 523,569,600 | 24,318,720 |
| Size | 499.3 MB | 23.2 MB |
| Events in quadrant A | 3,111,992 | 128,751 |
| Events in quadrant B | 1,691,083 | 178,739 |
| Events in quadrant C | 9,216,364 | 10,015 |
| Events in quadrant D | 1,596,805 | 167,208 |
| Mode M0 | |||
|---|---|---|---|
| Quadrant | BADHDUFLAG | Total packets | Discarded packets |
| A | 0 | 11727 | 2 |
| B | 0 | 7328 | 1 |
| C | 0 | 29999 | 1 |
| D | 0 | 7317 | 1 |
| Mode SS | |||
|---|---|---|---|
| Quadrant | BADHDUFLAG | Total packets | Discarded packets |
| A | 0 | 72 | 0 |
| B | 0 | 72 | 0 |
| C | 0 | 72 | 0 |
| D | 0 | 72 | 0 |
| Mode M9 | |||
|---|---|---|---|
| Quadrant | BADHDUFLAG | Total packets | Discarded packets |
| A | 0 | 13 | 0 |
| B | 0 | 13 | 0 |
| C | 0 | 13 | 0 |
| D | 0 | 13 | 0 |
| Quadrant | Total seconds | Saturated seconds | Saturation percentage |
|---|---|---|---|
| A | 3530 | 696 | 19.716714% |
| B | 3530 | 50 | 1.416431% |
| C | 3530 | 3530 | 100.000000% |
| D | 3530 | 48 | 1.359773% |
Noise dominated data is calculated using 1-second bins in cleaned event files. If a bin has >2000 counts, and if more than 50% of those come from <1% of pixels, then it is considered to be noise-dominated and hence unusable.
| Quadrant | # 1 sec bins | Bins with >0 counts | Bins with >2000 counts | High rate bins dominated by noise | Noise dominated (total time) | Noise dominated (detector-on time) | Marked lightcurve |
|---|---|---|---|---|---|---|---|
| A | 4766 | 3530 | 505 | 505 | 10.60% | 14.31% | 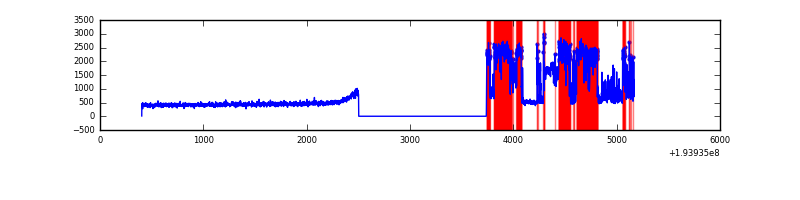 |
| B | 4766 | 3530 | 0 | 0 | 0.00% | 0.00% | 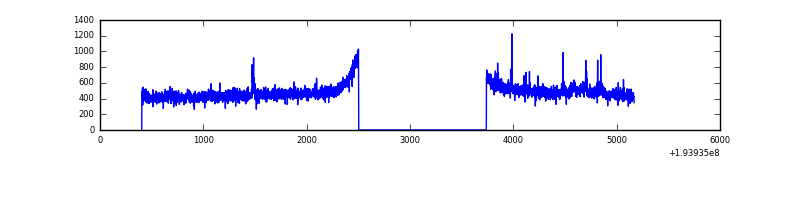 |
| C | 4766 | 3531 | 3492 | 3492 | 73.27% | 98.90% | 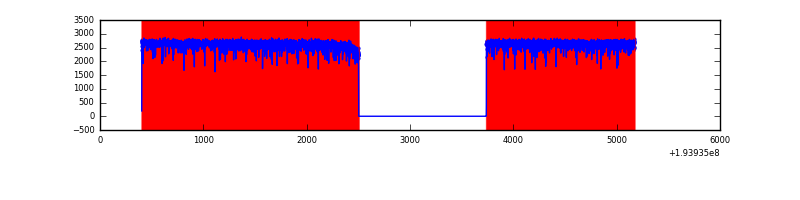 |
| D | 4766 | 3530 | 0 | 0 | 0.00% | 0.00% | 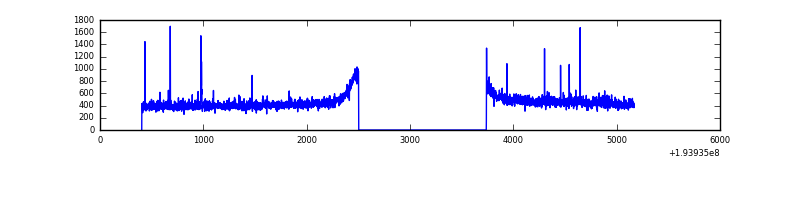 |
Top three noisy pixels from each quadrant. If the there are fewer than three noisy pixels in the level2.evt file, extra rows are filled as -1
| Pixel properties | Quadrant properties | ||||||
|---|---|---|---|---|---|---|---|
| Quadrant | DetID | PixID | Counts | Sigma | Mean | Median | Sigma |
| A | 15 | 171 | 1627659 | 20552.12 | 382 | 374 | 79.2 |
| A | 10 | 2 | 5619 | 66.24 | 382 | 374 | 79.2 |
| A | 12 | 194 | 4339 | 50.08 | 382 | 374 | 79.2 |
| B | 4 | 158 | 18184 | 211.8 | 430 | 419 | 83.9 |
| B | 6 | 219 | 7917 | 89.39 | 430 | 419 | 83.9 |
| B | 12 | 111 | 5286 | 58.03 | 430 | 419 | 83.9 |
| C | 7 | 111 | 3037223 | 78446.15 | 58 | 53 | 38.7 |
| C | 0 | 187 | 1320678 | 34110.03 | 58 | 53 | 38.7 |
| C | 7 | 247 | 688569 | 17783.47 | 58 | 53 | 38.7 |
| D | 9 | 64 | 16526 | 164.73 | 410 | 401 | 97.9 |
| D | 15 | 194 | 7636 | 73.91 | 410 | 401 | 97.9 |
| D | 5 | 233 | 5250 | 49.54 | 410 | 401 | 97.9 |
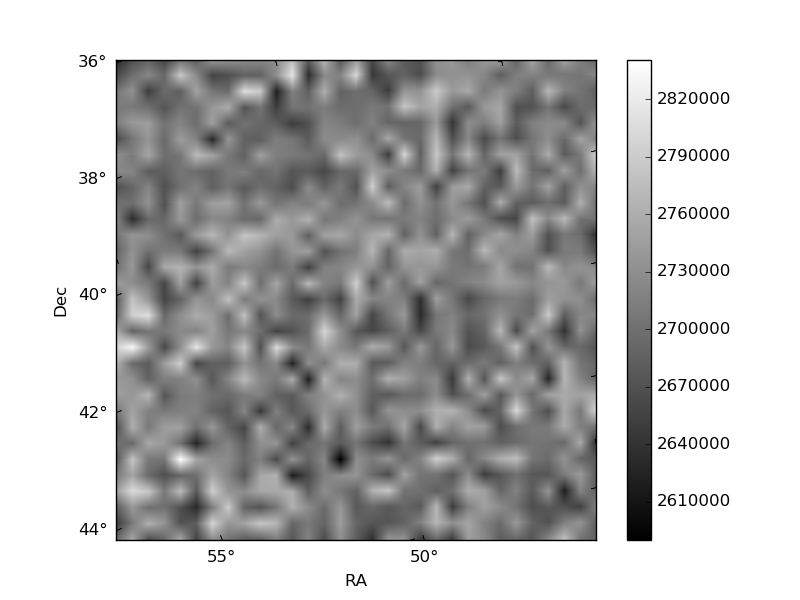
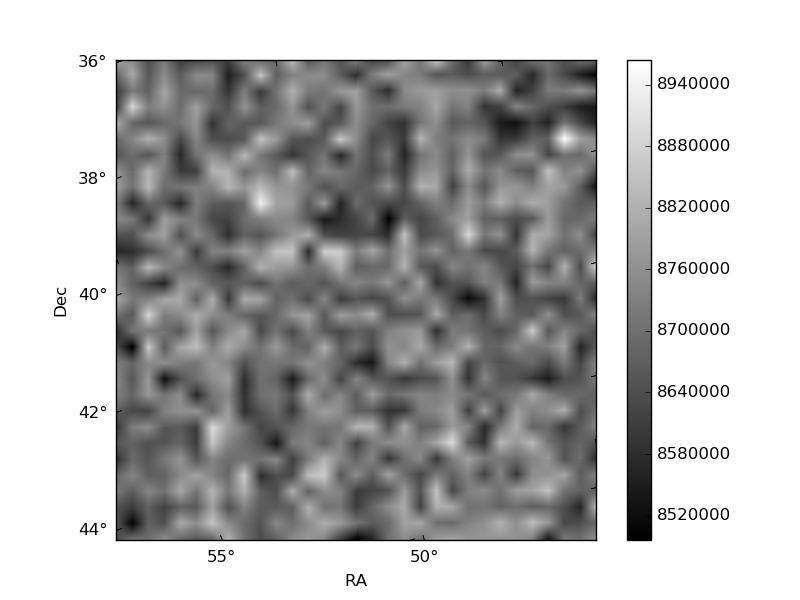
Histogram calculated using DETX and DETY for each event in the final _common_clean file
| Quadrant A | 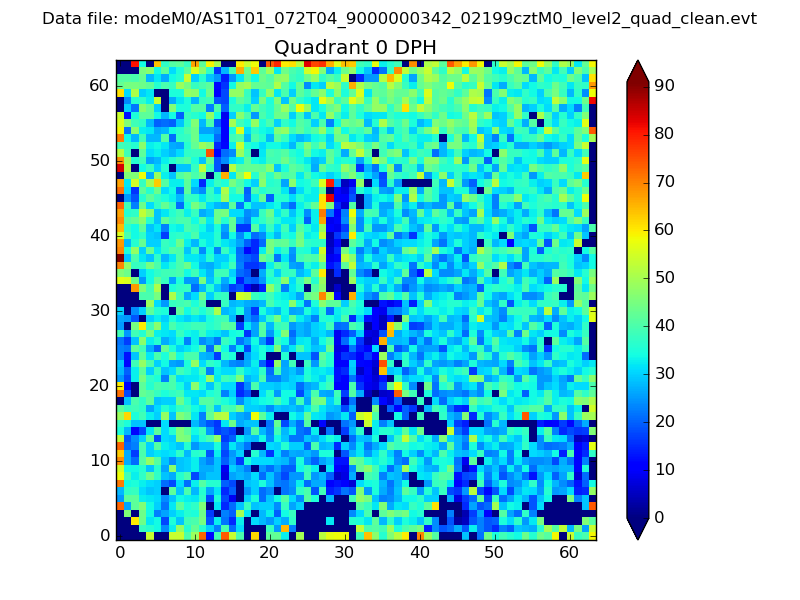 |
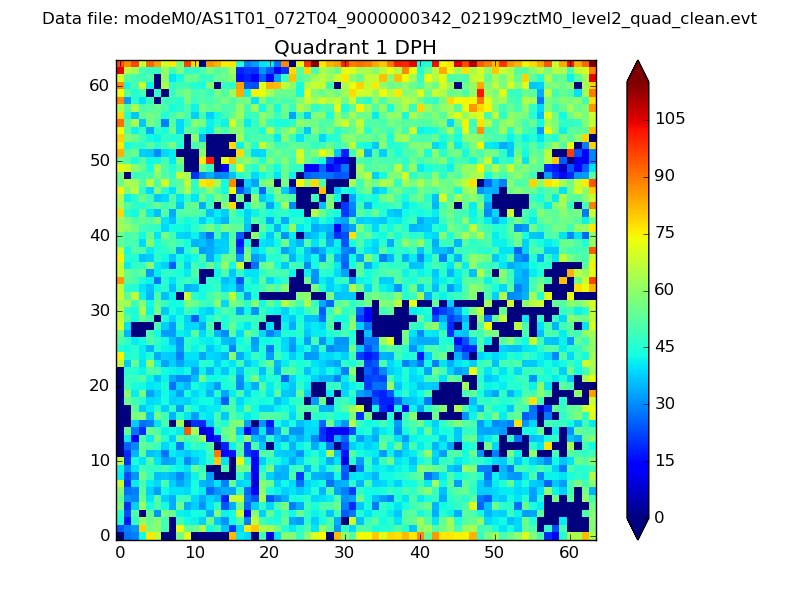 |
Quadrant B |
|---|---|---|---|
| Quadrant D | 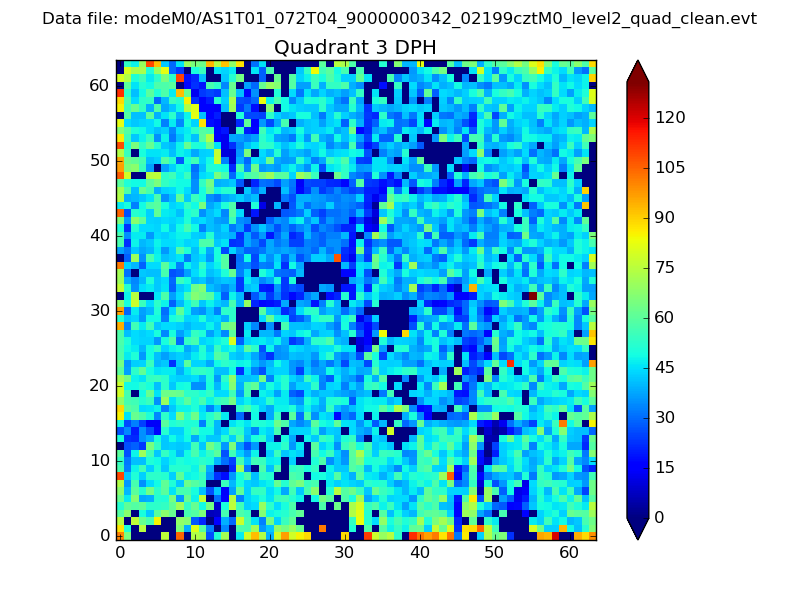 |
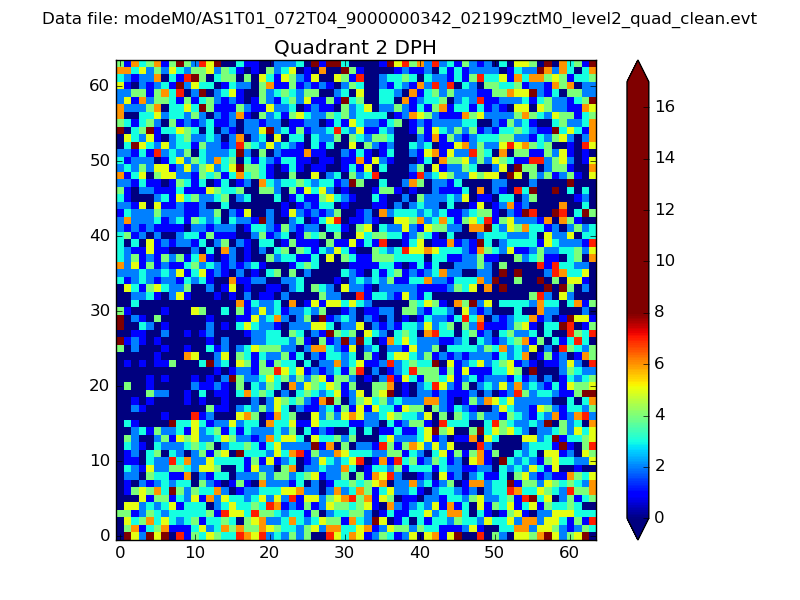 |
Quadrant C |
| Plot type | Count rate plots | Images |
|---|---|---|
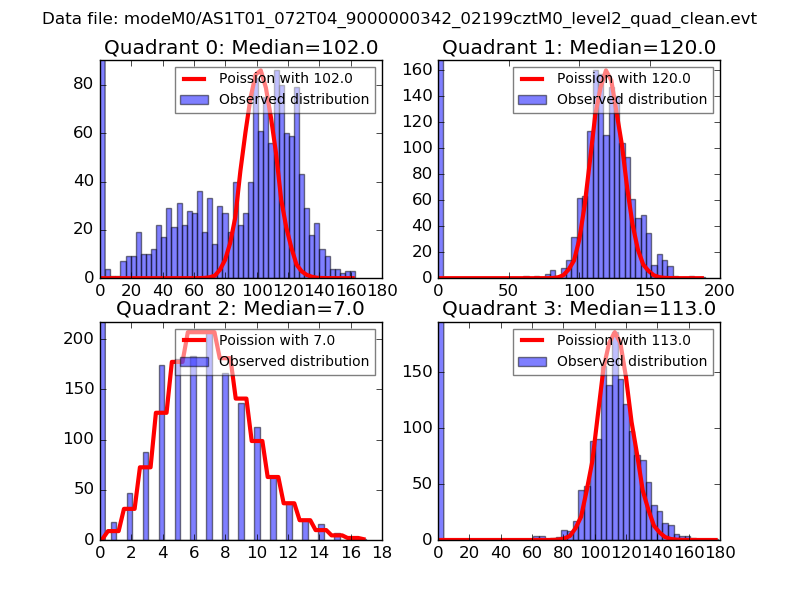
| Comparison with Poisson distribution Blue bars denote a histogram of data divided into 1 sec bins. Red curve is a Poisson curve with rate = median count rate of data. |
 |
 |
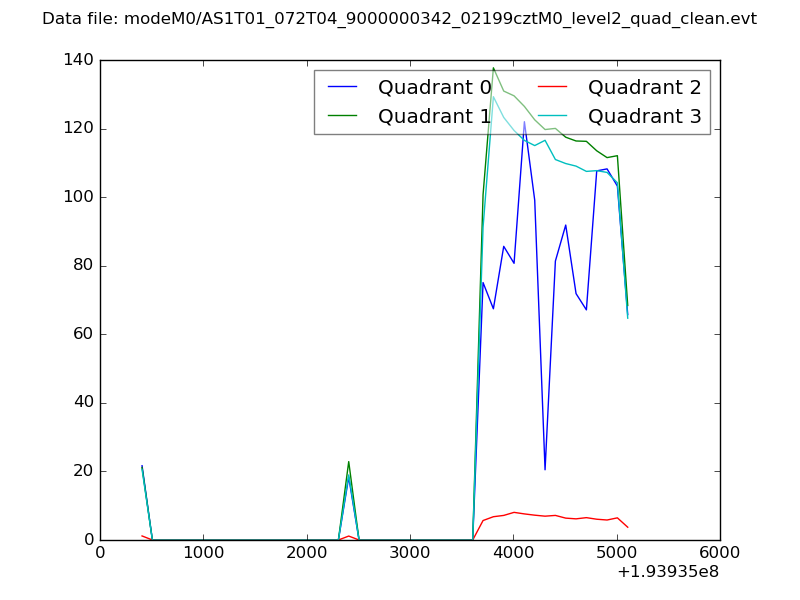
| Quadrant-wise count rates Data is divided into 100 sec bins |
 |
|
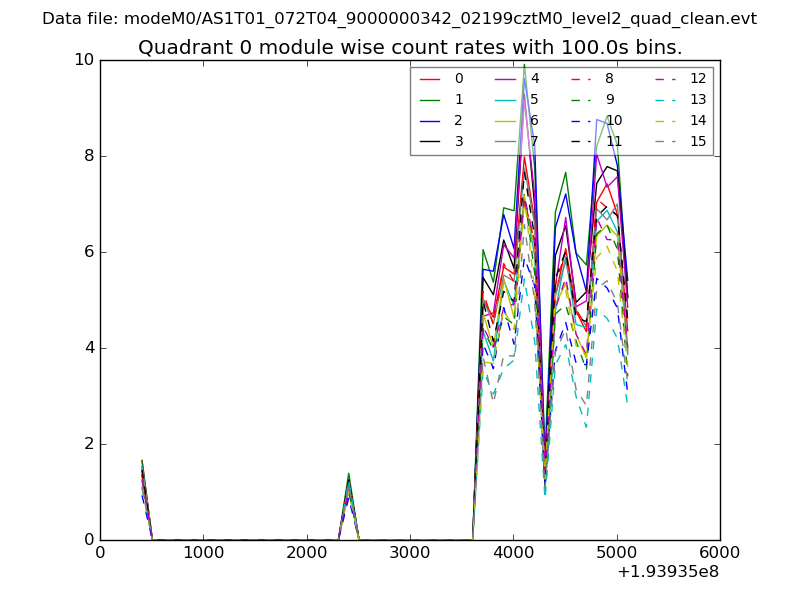
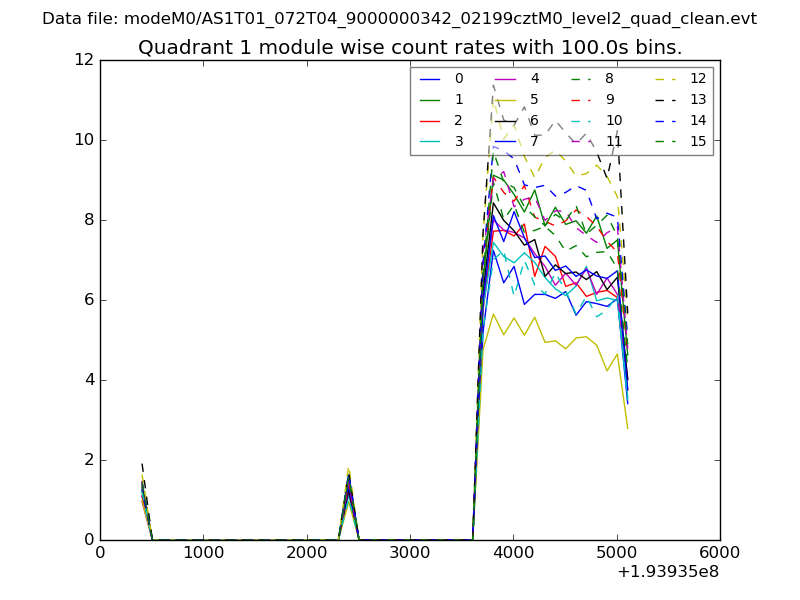
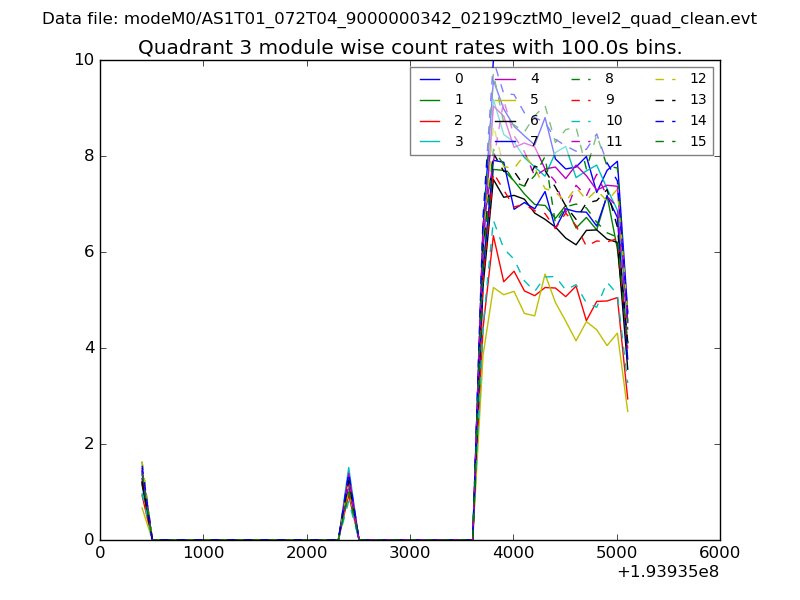
| Module-wise count rates for Quadrant A Data is divided into 100 sec bins |
 |
 |
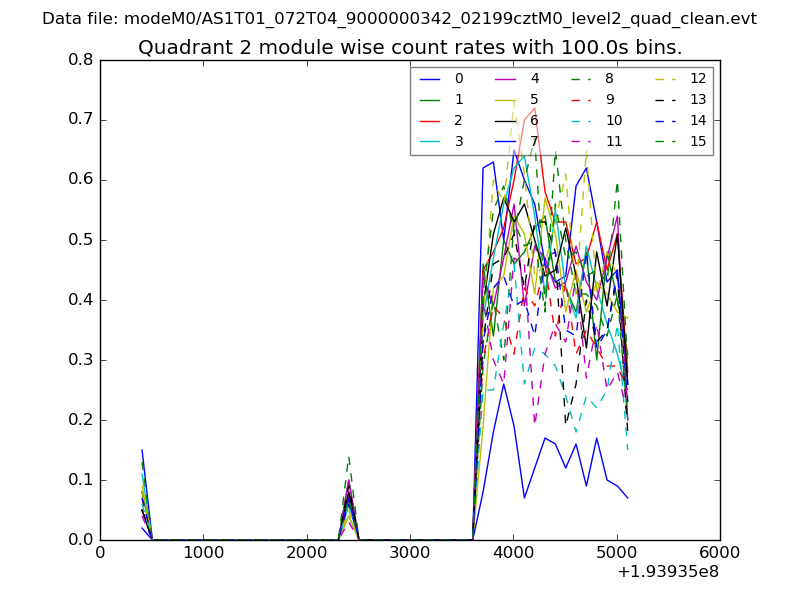
| Module-wise count rates for Quadrant B Data is divided into 100 sec bins |
 |
 |
| Module-wise count rates for Quadrant C Data is divided into 100 sec bins |
 |
 |
| Module-wise count rates for Quadrant D Data is divided into 100 sec bins |
 |
 |
| Parameter | Plot |
|---|---|
| CZT HV Monitor | 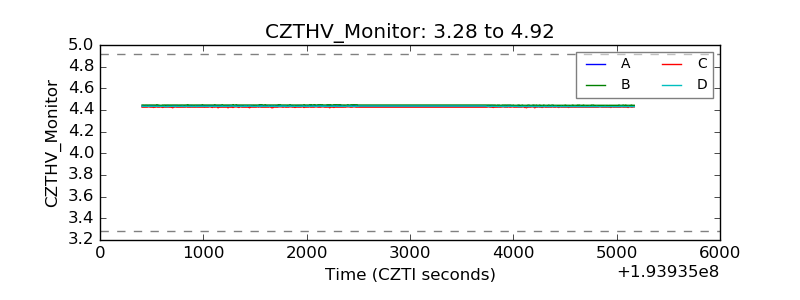 |
| D_VDD | 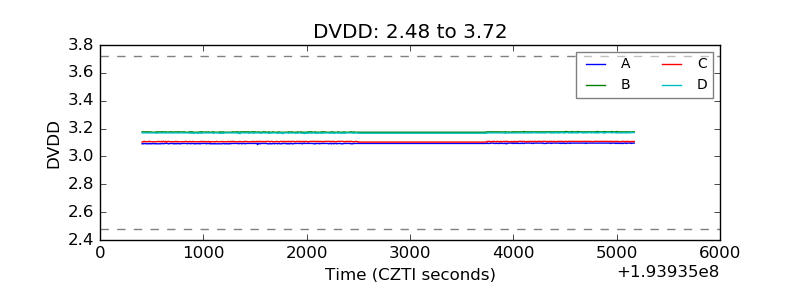 |
| Temperature 1 | 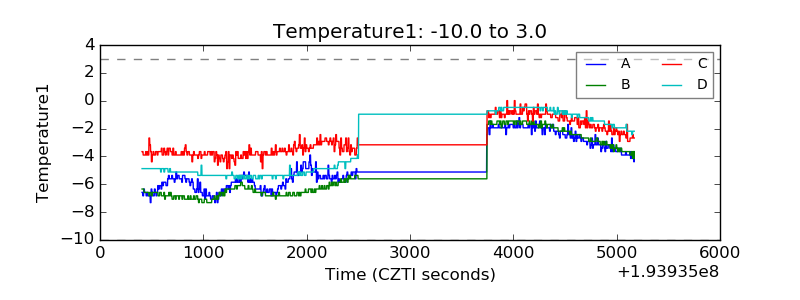 |
| Veto HV Monitor | 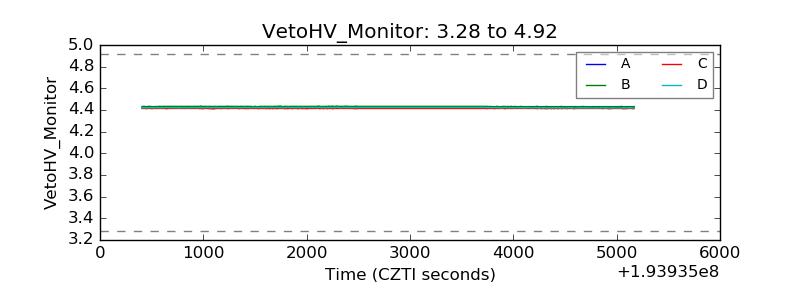 |
| Veto LLD | 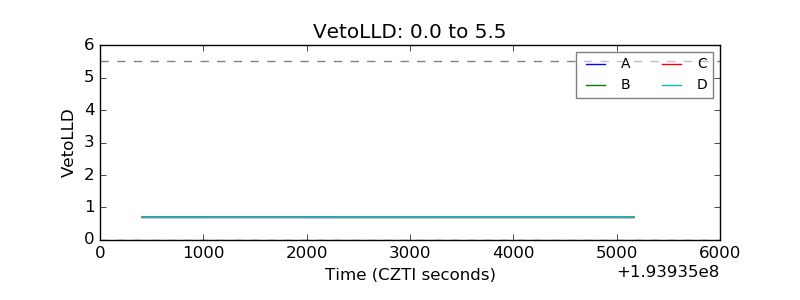 |
| Alpha Counter | 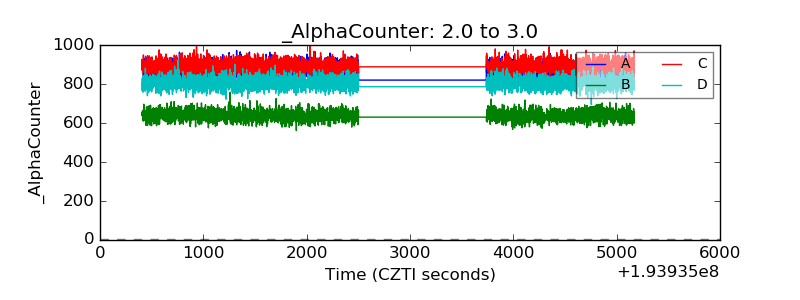 |
| _CPM_Rate | 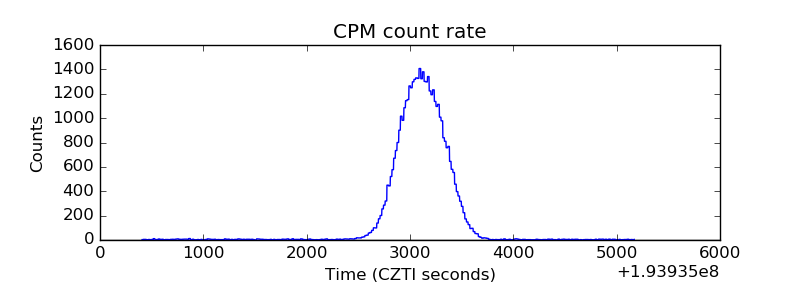 |
| CZT Counter | 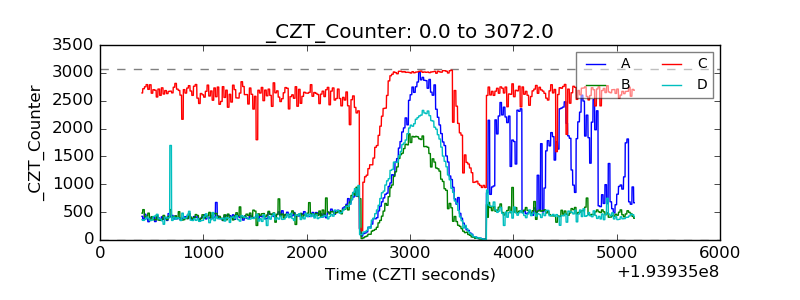 |
| +2.5 Volts monitor |  |
| +5 Volts monitor | 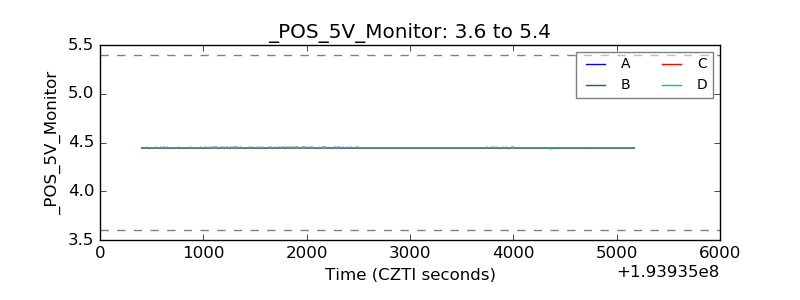 |
| _ROLL_ROT | 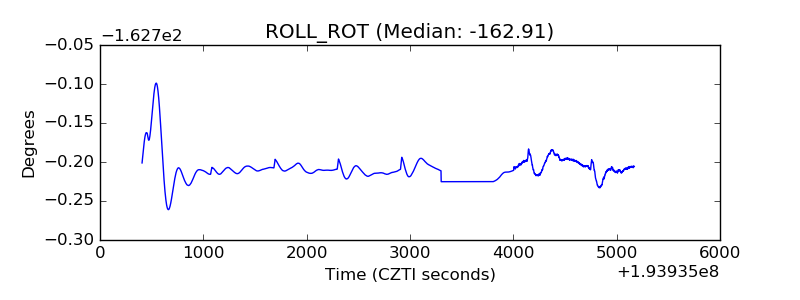 |
| _Roll_DEC | 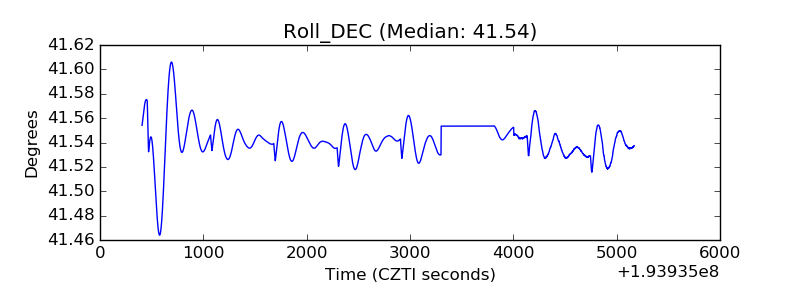 |
| _Roll_RA | 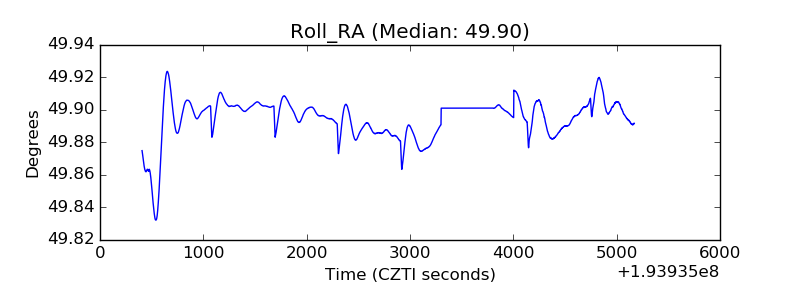 |
| Veto Counter | 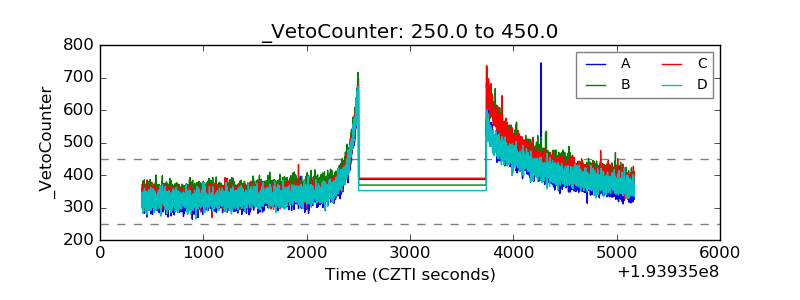 |