| Param | Original file | Final file |
|---|---|---|
| Filename | modeM0/AS1T01_072T04_9000000342_02202cztM0_level2.evt | modeM0/AS1T01_072T04_9000000342_02202cztM0_level2_quad_clean.evt |
| Size (bytes) | 981,259,200 | 66,401,280 |
| Size | 935.8 MB | 63.3 MB |
| Events in quadrant A | 4,020,884 | 513,290 |
| Events in quadrant B | 2,989,819 | 559,933 |
| Events in quadrant C | 17,267,955 | 31,477 |
| Events in quadrant D | 4,994,134 | 443,840 |
| Mode M0 | |||
|---|---|---|---|
| Quadrant | BADHDUFLAG | Total packets | Discarded packets |
| A | 0 | 16672 | 2 |
| B | 0 | 13608 | 2 |
| C | 0 | 56253 | 20 |
| D | 0 | 19946 | 2 |
| Mode SS | |||
|---|---|---|---|
| Quadrant | BADHDUFLAG | Total packets | Discarded packets |
| A | 0 | 132 | 0 |
| B | 0 | 132 | 0 |
| C | 0 | 132 | 0 |
| D | 0 | 132 | 0 |
| Mode M9 | |||
|---|---|---|---|
| Quadrant | BADHDUFLAG | Total packets | Discarded packets |
| A | 0 | 1 | 0 |
| B | 1 | 1 | 0 |
| C | 1 | -1 | -1 |
| D | 1 | -1 | -1 |
| Quadrant | Total seconds | Saturated seconds | Saturation percentage |
|---|---|---|---|
| A | 6583 | 471 | 7.154793% |
| B | 6583 | 39 | 0.592435% |
| C | 6581 | 6581 | 100.000000% |
| D | 6584 | 979 | 14.869380% |
Noise dominated data is calculated using 1-second bins in cleaned event files. If a bin has >2000 counts, and if more than 50% of those come from <1% of pixels, then it is considered to be noise-dominated and hence unusable.
| Quadrant | # 1 sec bins | Bins with >0 counts | Bins with >2000 counts | High rate bins dominated by noise | Noise dominated (total time) | Noise dominated (detector-on time) | Marked lightcurve |
|---|---|---|---|---|---|---|---|
| A | 7533 | 6584 | 381 | 381 | 5.06% | 5.79% | 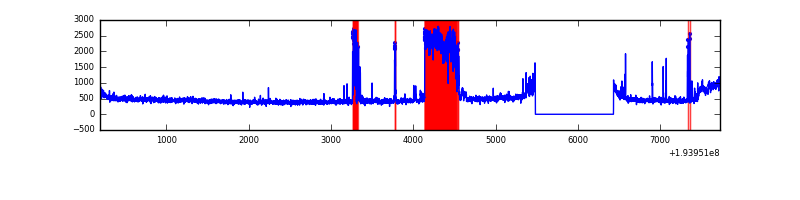 |
| B | 7533 | 6583 | 2 | 2 | 0.03% | 0.03% | 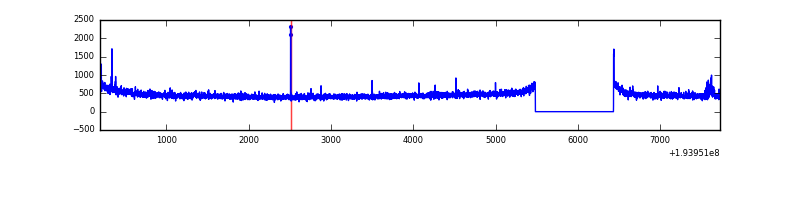 |
| C | 7533 | 6583 | 6535 | 6535 | 86.75% | 99.27% | 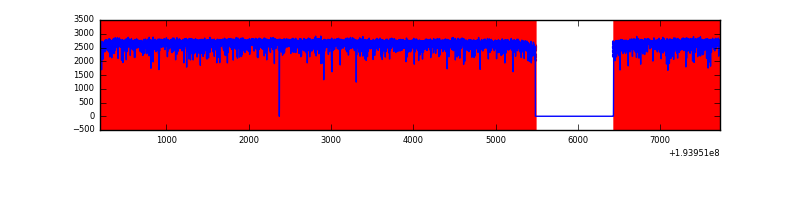 |
| D | 7533 | 6583 | 964 | 964 | 12.80% | 14.64% | 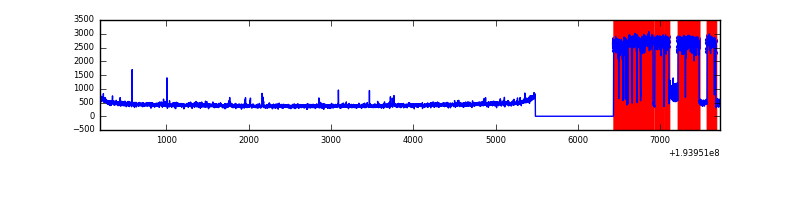 |
Top three noisy pixels from each quadrant. If the there are fewer than three noisy pixels in the level2.evt file, extra rows are filled as -1
| Pixel properties | Quadrant properties | ||||||
|---|---|---|---|---|---|---|---|
| Quadrant | DetID | PixID | Counts | Sigma | Mean | Median | Sigma |
| A | 15 | 171 | 1265681 | 8715.41 | 707 | 689 | 145.1 |
| A | 10 | 2 | 24986 | 167.4 | 707 | 689 | 145.1 |
| A | 12 | 194 | 8085 | 50.96 | 707 | 689 | 145.1 |
| B | 6 | 219 | 21312 | 142.1 | 756 | 736 | 144.8 |
| B | 4 | 158 | 20814 | 138.66 | 756 | 736 | 144.8 |
| B | 4 | 200 | 11642 | 75.32 | 756 | 736 | 144.8 |
| C | 7 | 111 | 5698786 | 87123.95 | 105 | 96 | 65.4 |
| C | 0 | 187 | 2520736 | 38536.6 | 105 | 96 | 65.4 |
| C | 7 | 247 | 1322209 | 20213.02 | 105 | 96 | 65.4 |
| D | 7 | 223 | 2504205 | 16218.93 | 648 | 631 | 154.4 |
| D | 15 | 194 | 11902 | 73.02 | 648 | 631 | 154.4 |
| D | 14 | 226 | 7443 | 44.13 | 648 | 631 | 154.4 |
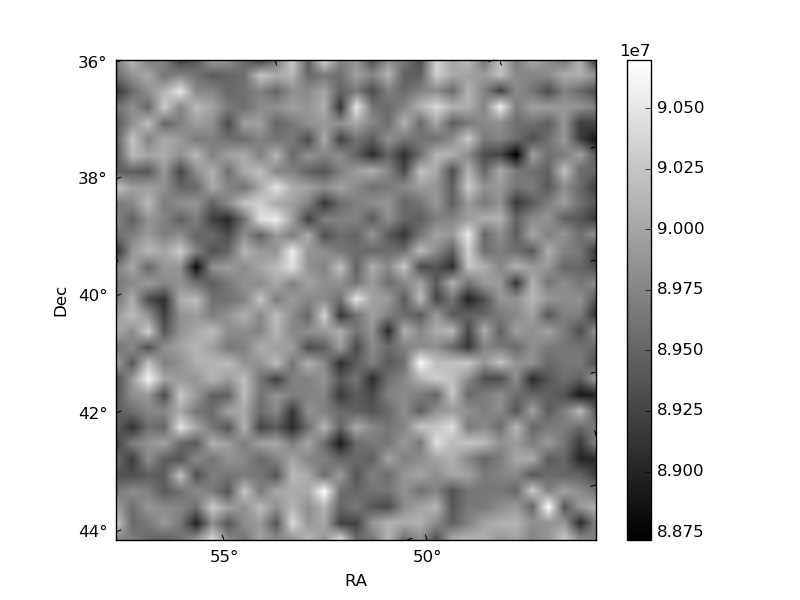
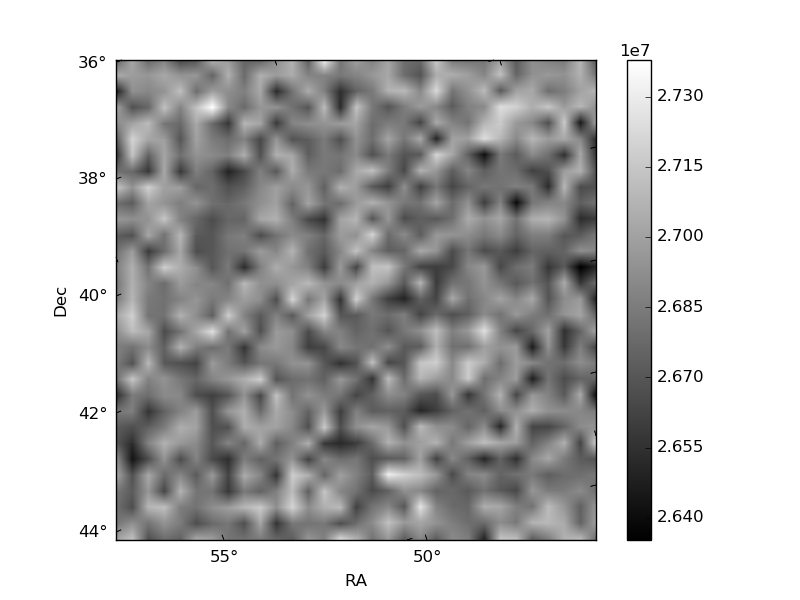
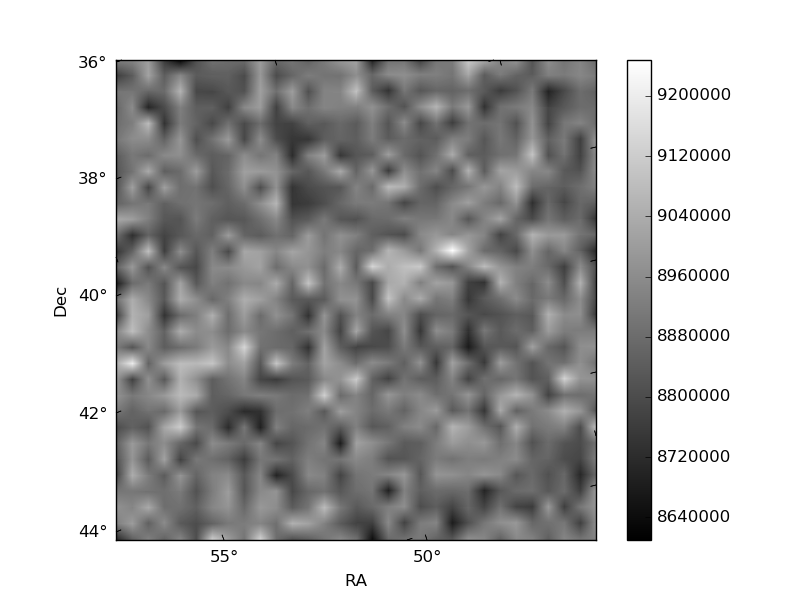
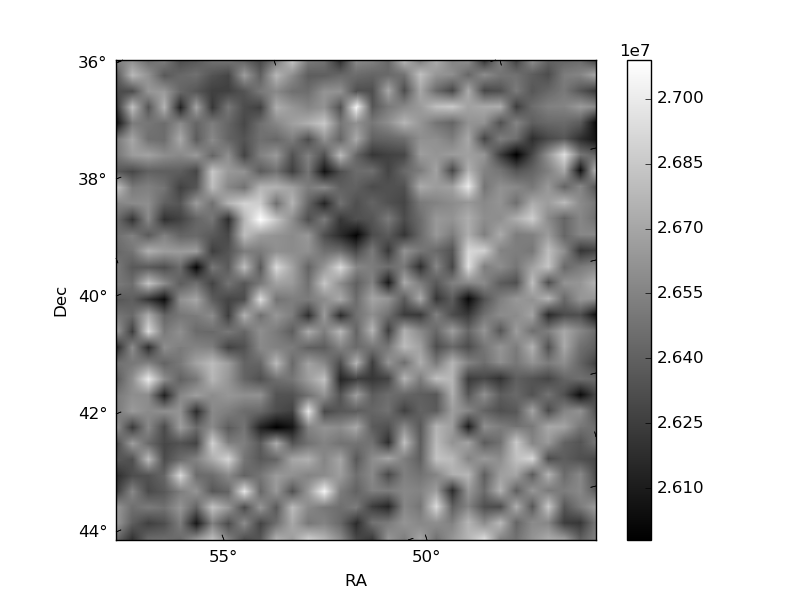
Histogram calculated using DETX and DETY for each event in the final _common_clean file
| Quadrant A | 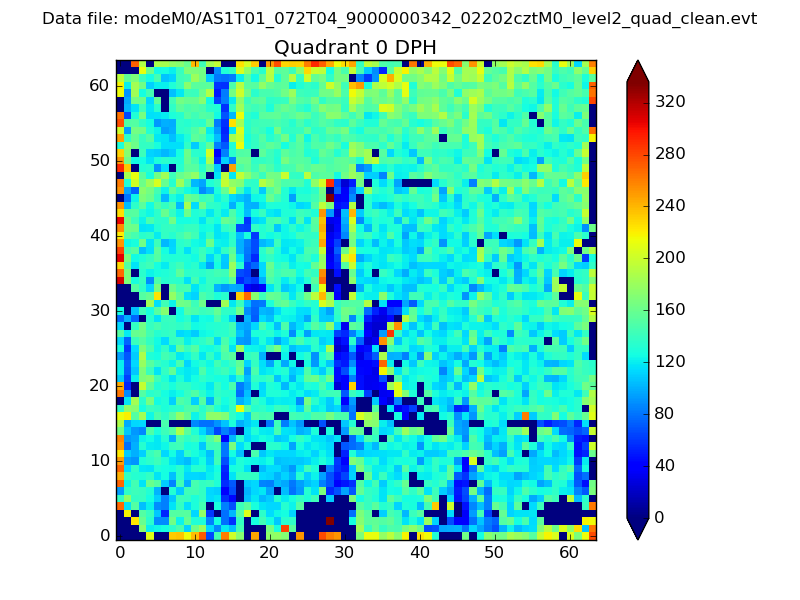 |
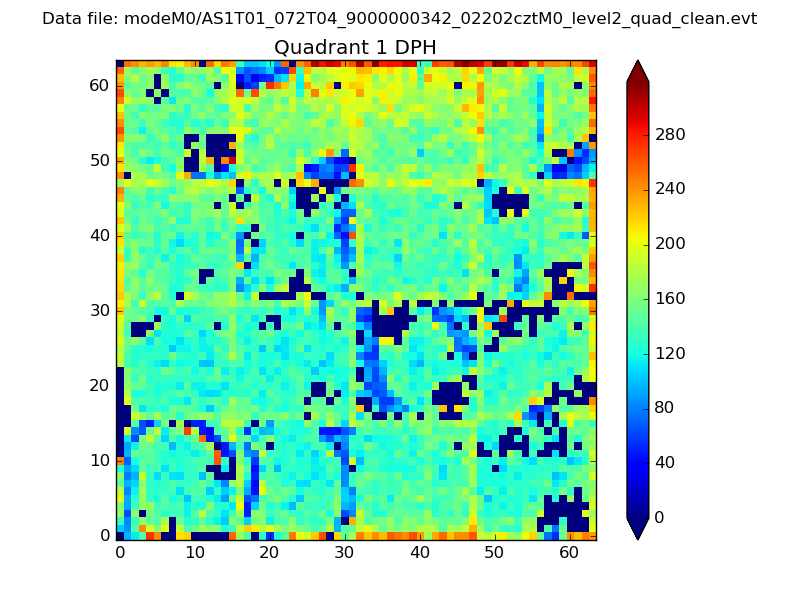 |
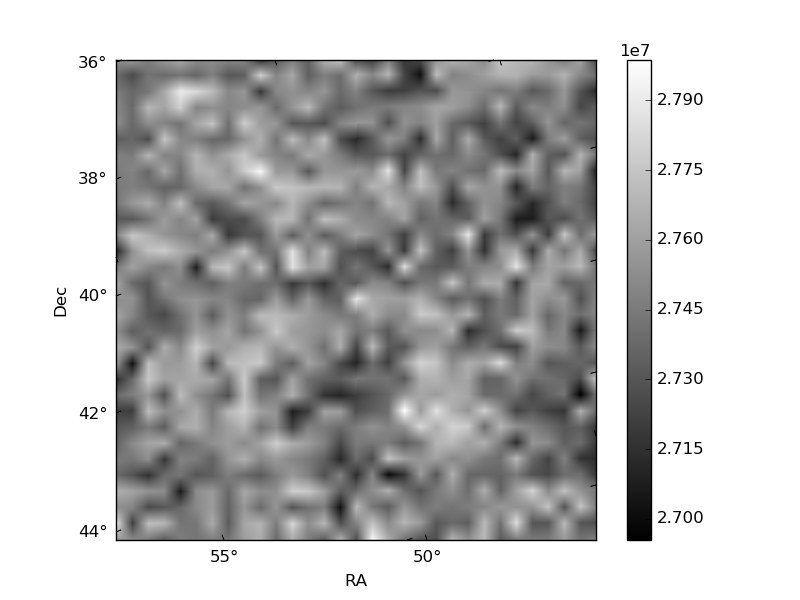
Quadrant B |
|---|---|---|---|
| Quadrant D | 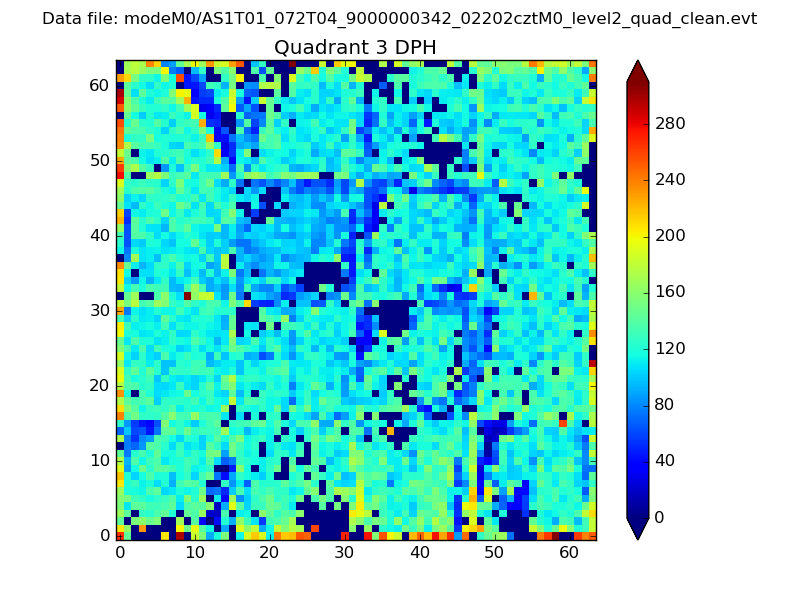 |
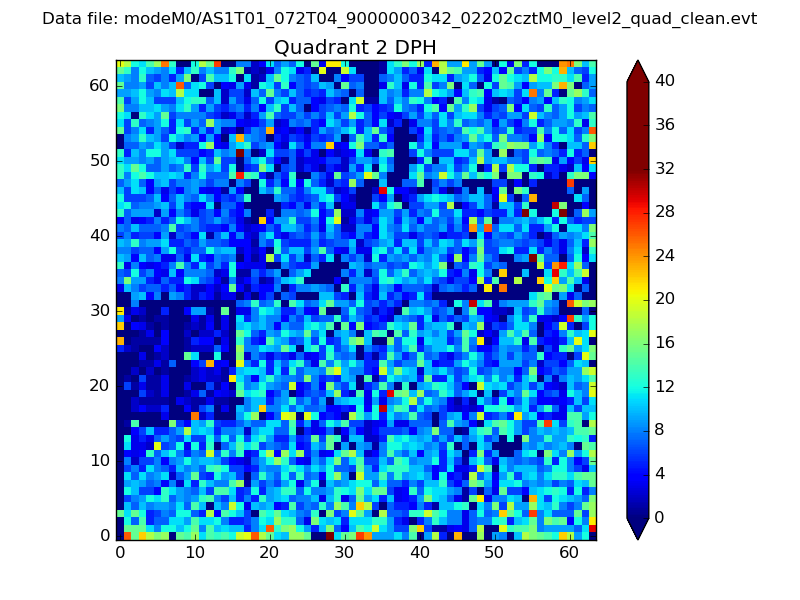 |
Quadrant C |
| Plot type | Count rate plots | Images |
|---|---|---|
| Comparison with Poisson distribution Blue bars denote a histogram of data divided into 1 sec bins. Red curve is a Poisson curve with rate = median count rate of data. |
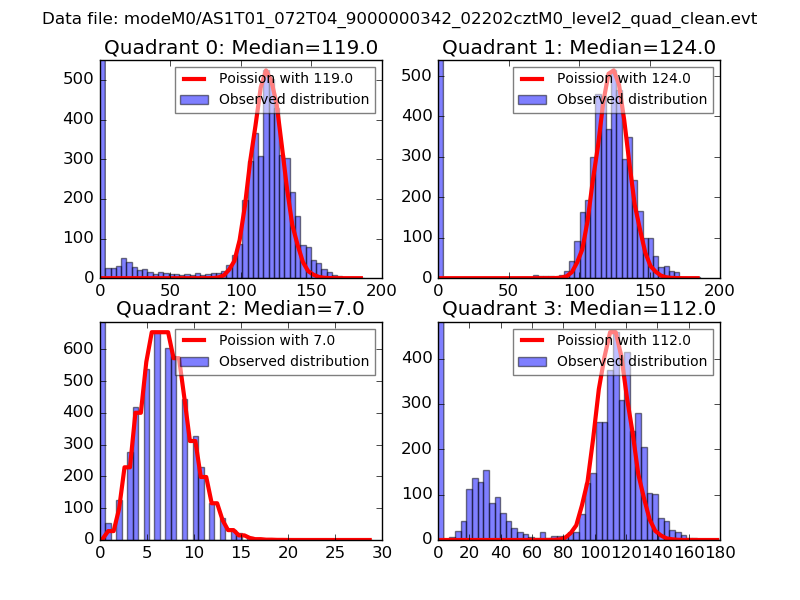 |
 |
| Quadrant-wise count rates Data is divided into 100 sec bins |
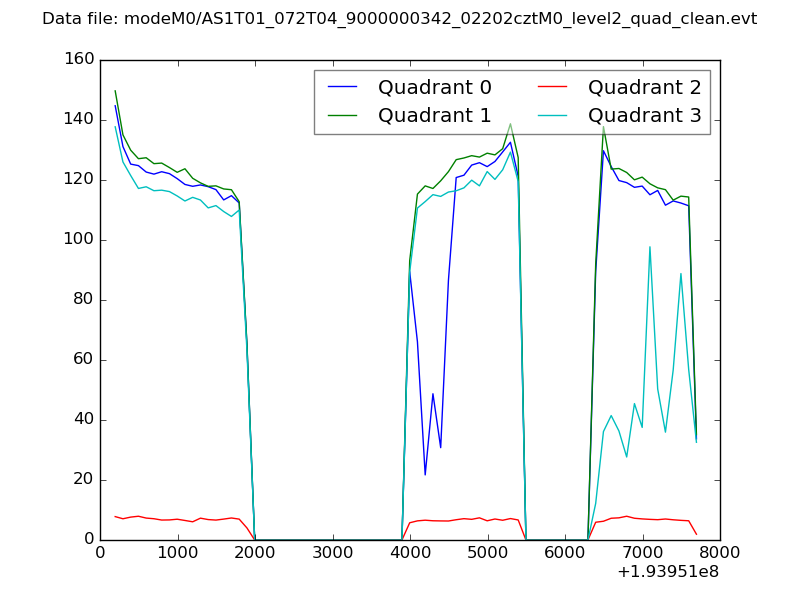 |
|
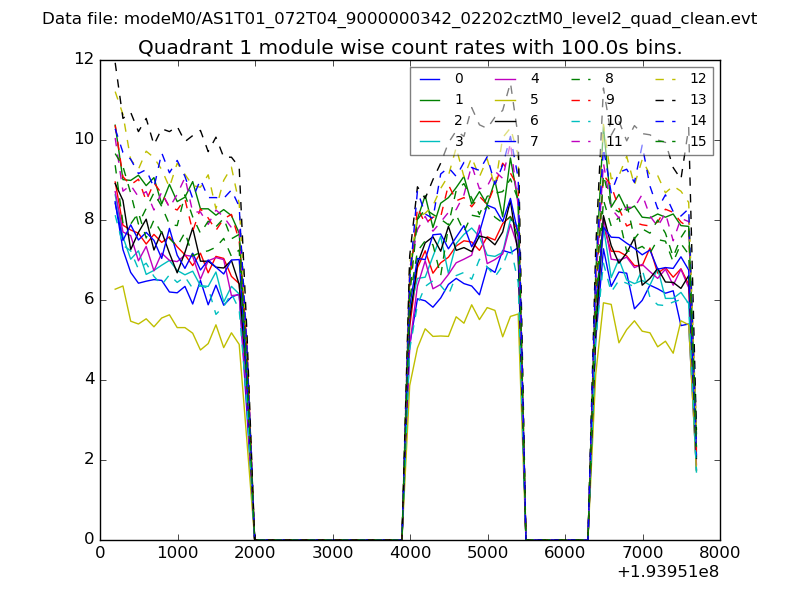
| Module-wise count rates for Quadrant A Data is divided into 100 sec bins |
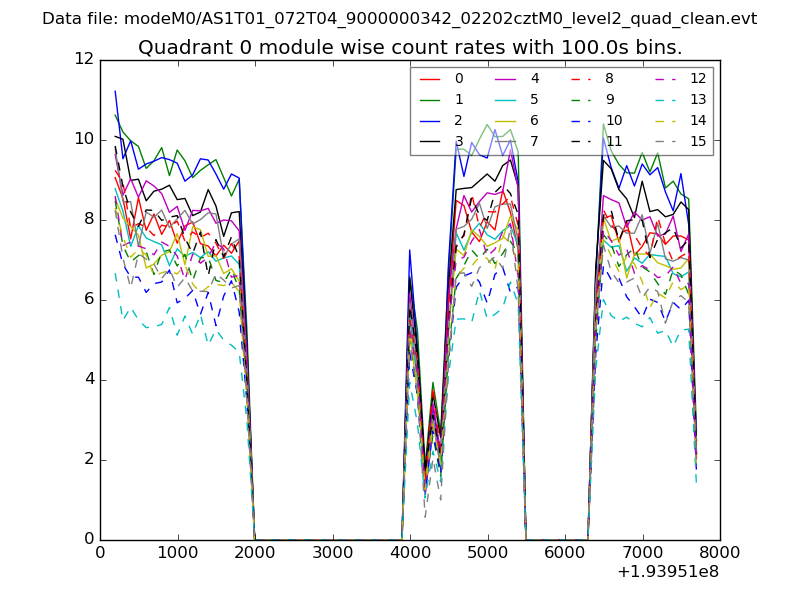 |
 |
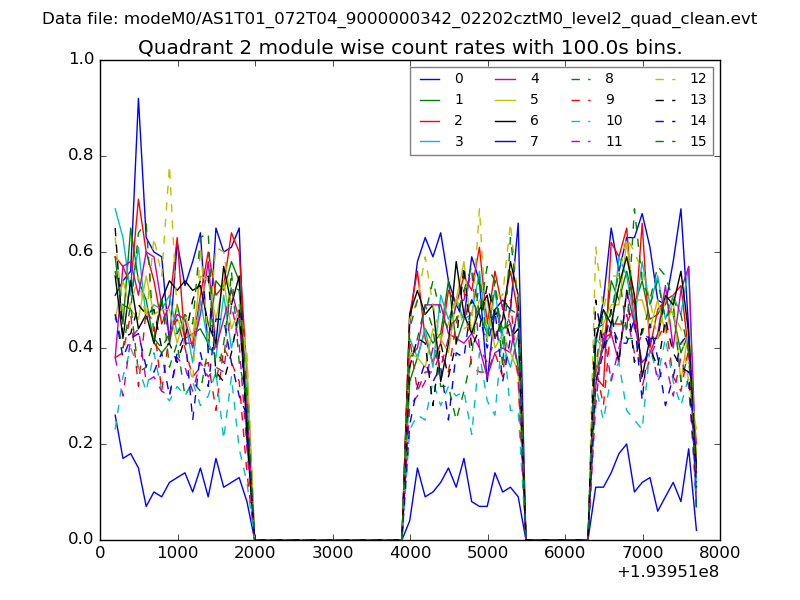
| Module-wise count rates for Quadrant B Data is divided into 100 sec bins |
 |
 |
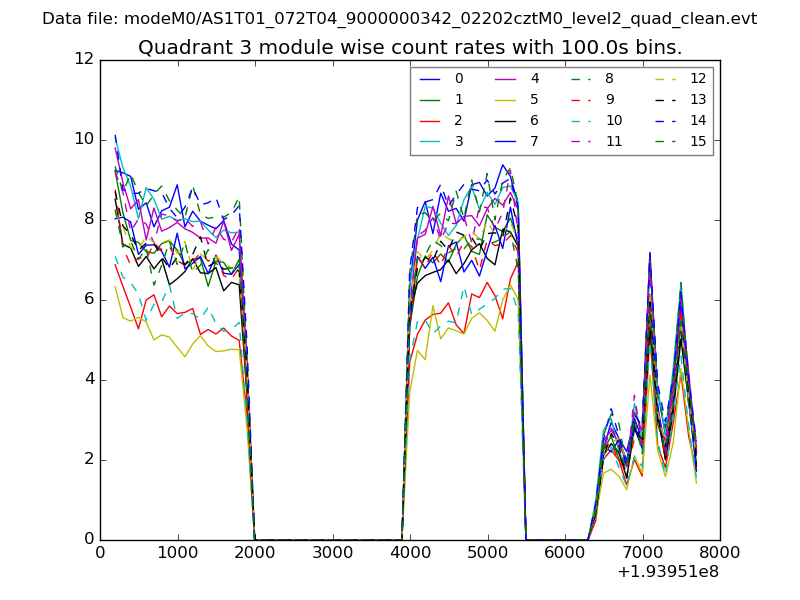
| Module-wise count rates for Quadrant C Data is divided into 100 sec bins |
 |
 |
| Module-wise count rates for Quadrant D Data is divided into 100 sec bins |
 |
 |
| Parameter | Plot |
|---|---|
| CZT HV Monitor | 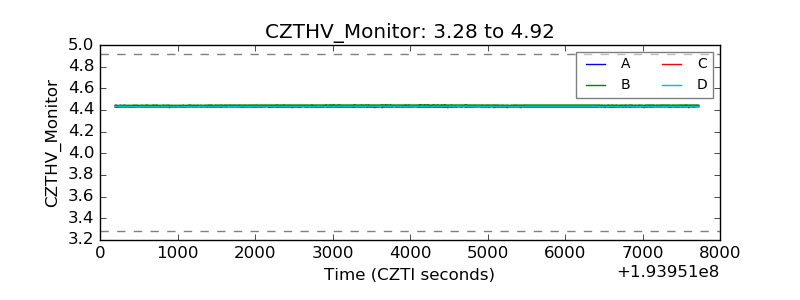 |
| D_VDD | 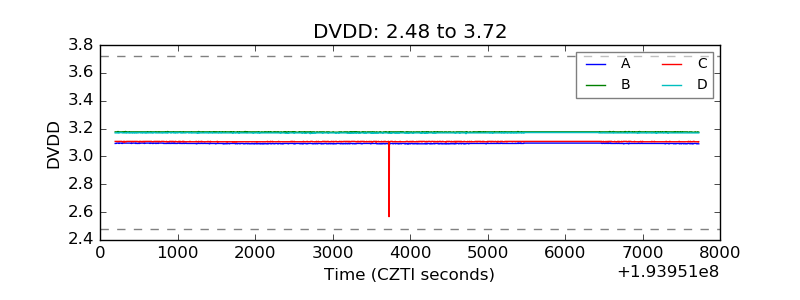 |
| Temperature 1 | 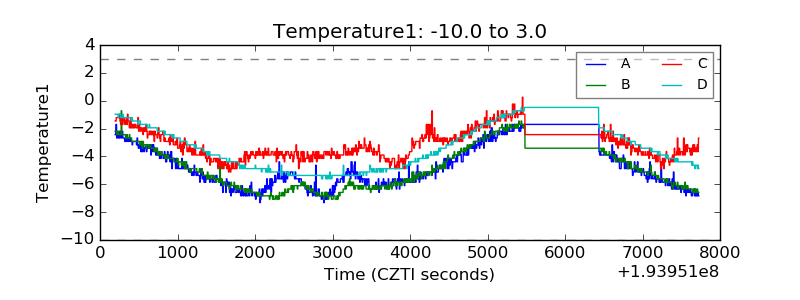 |
| Veto HV Monitor | 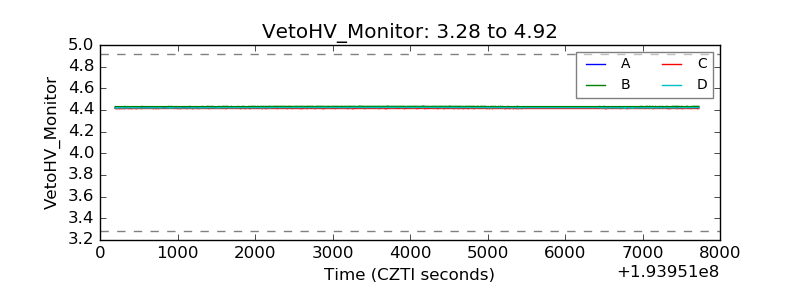 |
| Veto LLD | 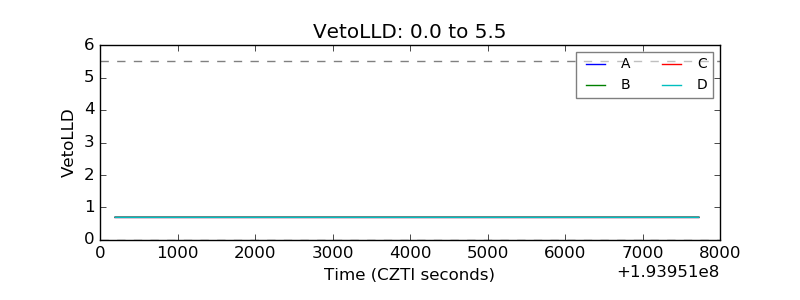 |
| Alpha Counter | 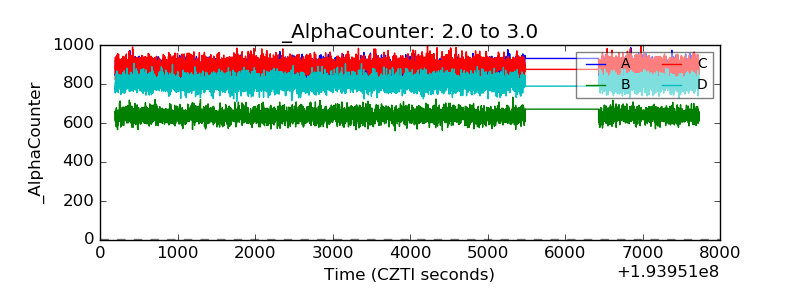 |
| _CPM_Rate | 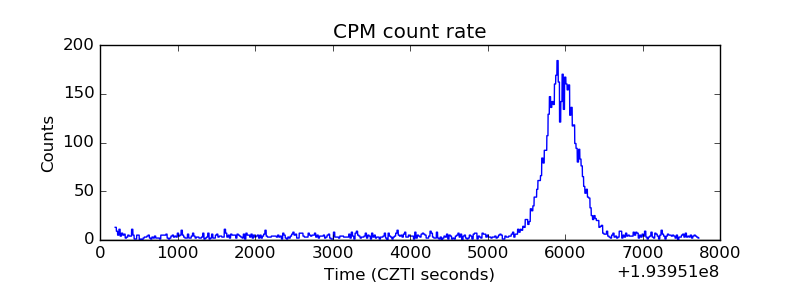 |
| CZT Counter | 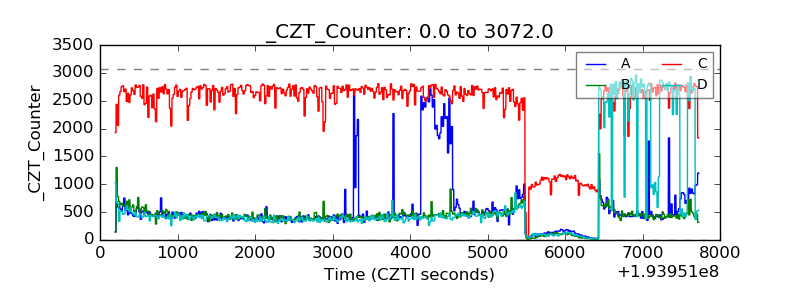 |
| +2.5 Volts monitor |  |
| +5 Volts monitor | 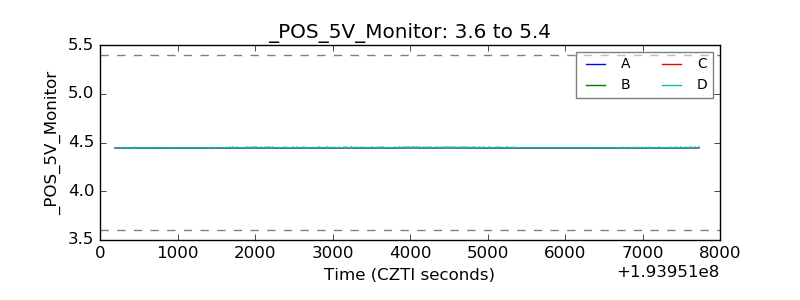 |
| _ROLL_ROT | 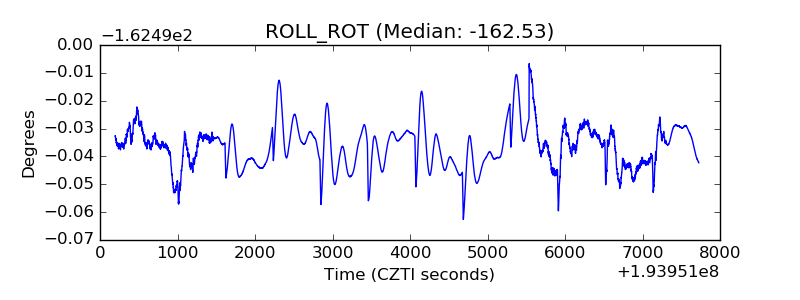 |
| _Roll_DEC | 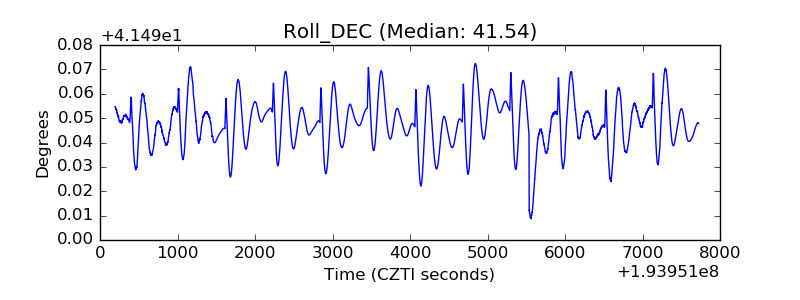 |
| _Roll_RA | 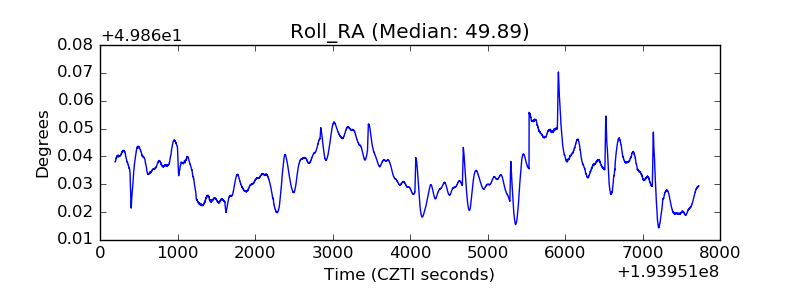 |
| Veto Counter | 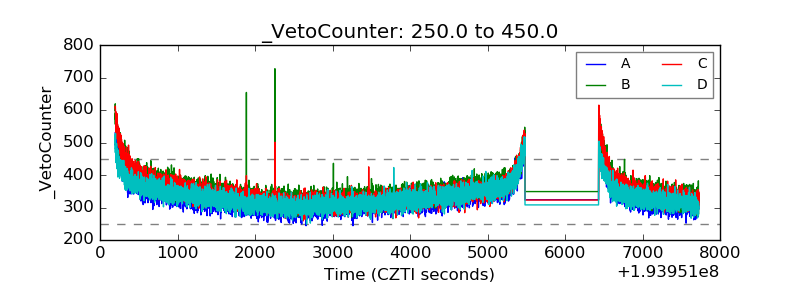 |