| Param | Original file | Final file |
|---|---|---|
| Filename | modeM0/AS1T01_072T04_9000000342_02203cztM0_level2.evt | modeM0/AS1T01_072T04_9000000342_02203cztM0_level2_quad_clean.evt |
| Size (bytes) | 1,137,553,920 | 67,890,240 |
| Size | 1.1 GB | 64.7 MB |
| Events in quadrant A | 3,906,247 | 541,849 |
| Events in quadrant B | 3,183,017 | 559,689 |
| Events in quadrant C | 18,596,871 | 31,796 |
| Events in quadrant D | 8,287,667 | 425,966 |
| Mode M0 | |||
|---|---|---|---|
| Quadrant | BADHDUFLAG | Total packets | Discarded packets |
| A | 0 | 16746 | 2 |
| B | 0 | 14593 | 6 |
| C | 0 | 60583 | 2 |
| D | 0 | 29646 | 2 |
| Mode SS | |||
|---|---|---|---|
| Quadrant | BADHDUFLAG | Total packets | Discarded packets |
| A | 0 | 140 | 0 |
| B | 0 | 140 | 0 |
| C | 0 | 140 | 0 |
| D | 0 | 140 | 0 |
| Mode M9 | |||
|---|---|---|---|
| Quadrant | BADHDUFLAG | Total packets | Discarded packets |
| A | 0 | 1 | 0 |
| B | 1 | 1 | 0 |
| C | 1 | -1 | -1 |
| D | 1 | -1 | -1 |
| Quadrant | Total seconds | Saturated seconds | Saturation percentage |
|---|---|---|---|
| A | 7089 | 218 | 3.075187% |
| B | 7087 | 56 | 0.790179% |
| C | 7089 | 7089 | 100.000000% |
| D | 7089 | 1808 | 25.504302% |
Noise dominated data is calculated using 1-second bins in cleaned event files. If a bin has >2000 counts, and if more than 50% of those come from <1% of pixels, then it is considered to be noise-dominated and hence unusable.
| Quadrant | # 1 sec bins | Bins with >0 counts | Bins with >2000 counts | High rate bins dominated by noise | Noise dominated (total time) | Noise dominated (detector-on time) | Marked lightcurve |
|---|---|---|---|---|---|---|---|
| A | 7669 | 7089 | 152 | 152 | 1.98% | 2.14% | 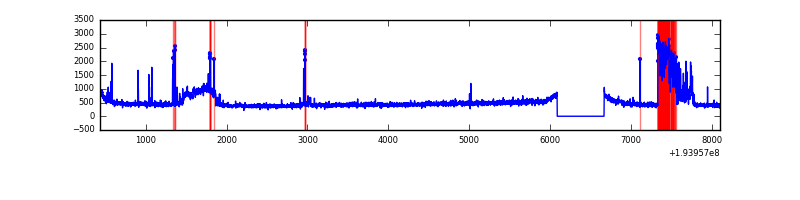 |
| B | 7668 | 7087 | 0 | 0 | 0.00% | 0.00% | 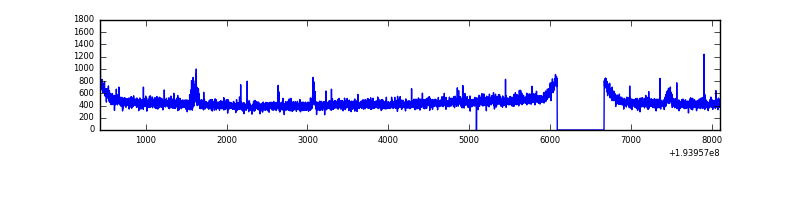 |
| C | 7669 | 7090 | 7035 | 7035 | 91.73% | 99.22% | 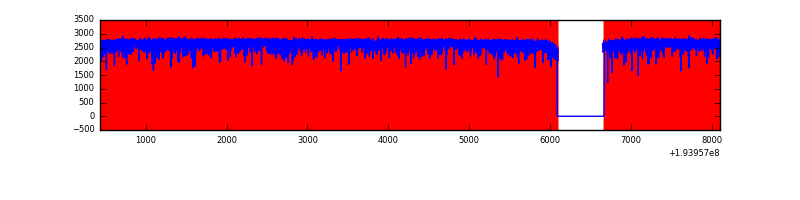 |
| D | 7668 | 7088 | 1952 | 1952 | 25.46% | 27.54% | 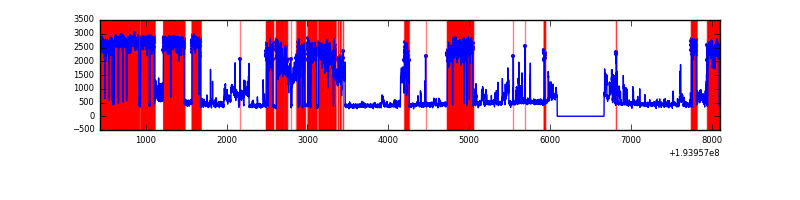 |
Top three noisy pixels from each quadrant. If the there are fewer than three noisy pixels in the level2.evt file, extra rows are filled as -1
| Pixel properties | Quadrant properties | ||||||
|---|---|---|---|---|---|---|---|
| Quadrant | DetID | PixID | Counts | Sigma | Mean | Median | Sigma |
| A | 15 | 171 | 838871 | 5185.51 | 790 | 769 | 161.6 |
| A | 10 | 2 | 25108 | 150.59 | 790 | 769 | 161.6 |
| A | 12 | 194 | 9024 | 51.08 | 790 | 769 | 161.6 |
| B | 6 | 219 | 38878 | 240.96 | 813 | 789 | 158.1 |
| B | 12 | 111 | 10642 | 62.33 | 813 | 789 | 158.1 |
| B | 11 | 111 | 9296 | 53.82 | 813 | 789 | 158.1 |
| C | 7 | 111 | 6173744 | 86167.56 | 113 | 103 | 71.6 |
| C | 0 | 187 | 2722127 | 37992.2 | 113 | 103 | 71.6 |
| C | 7 | 247 | 1428682 | 19939.15 | 113 | 103 | 71.6 |
| D | 7 | 223 | 5693482 | 35338.62 | 676 | 659 | 161.1 |
| D | 15 | 194 | 12101 | 71.03 | 676 | 659 | 161.1 |
| D | 2 | 54 | 7835 | 44.55 | 676 | 659 | 161.1 |
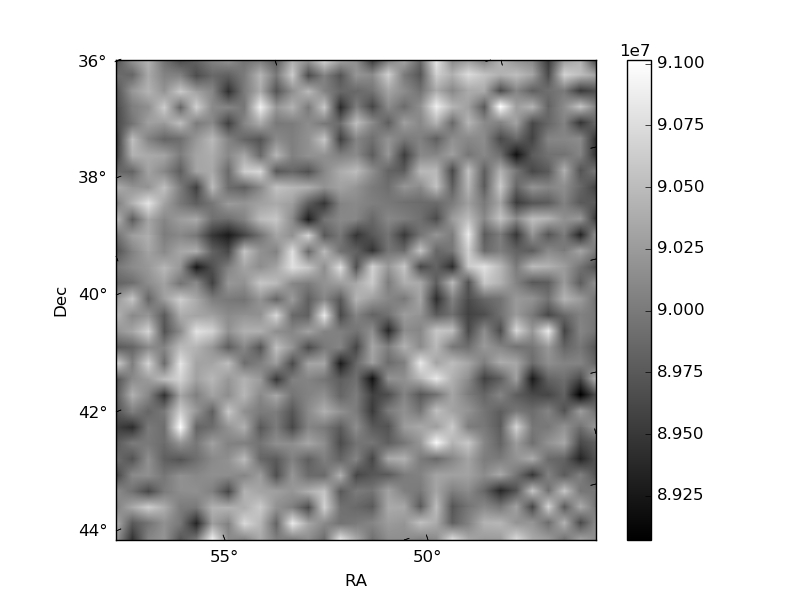
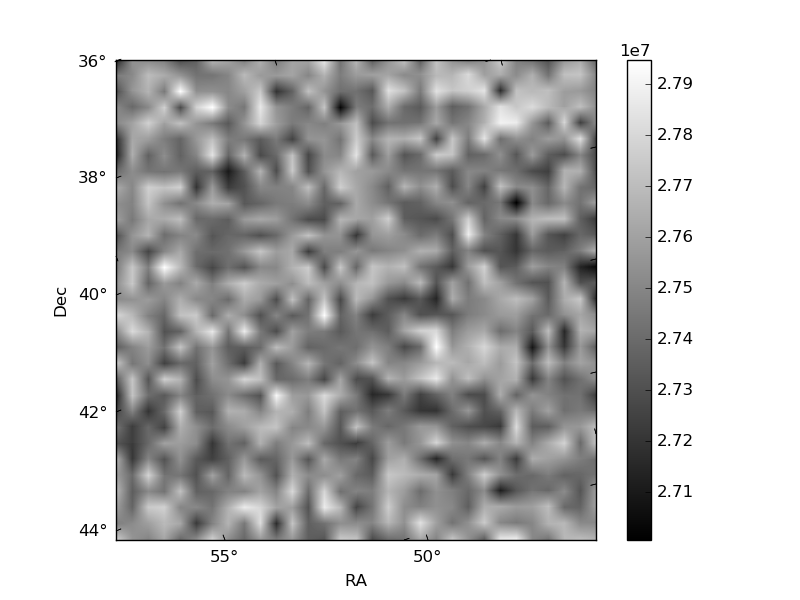
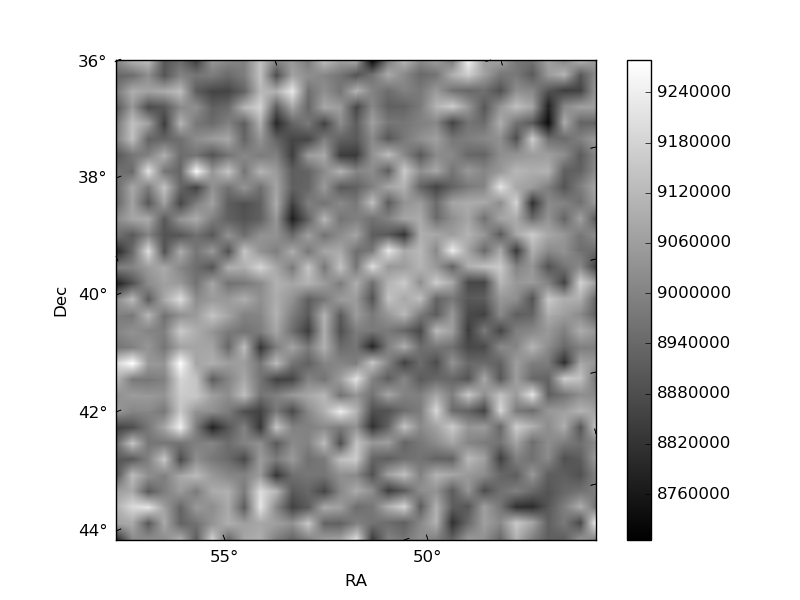
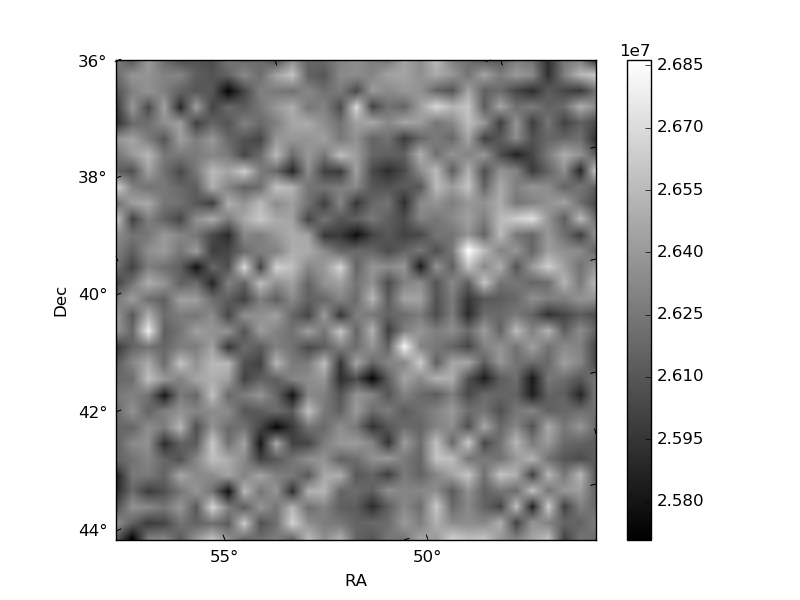
Histogram calculated using DETX and DETY for each event in the final _common_clean file
| Quadrant A | 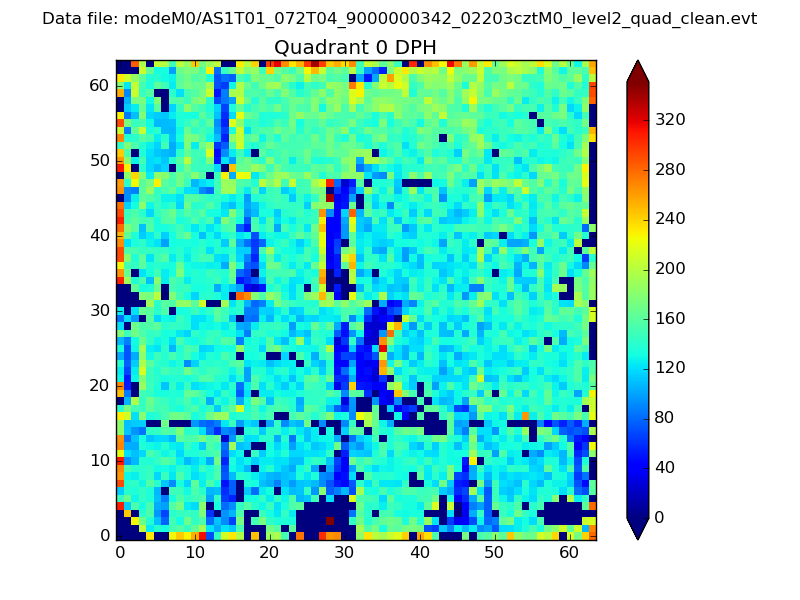 |
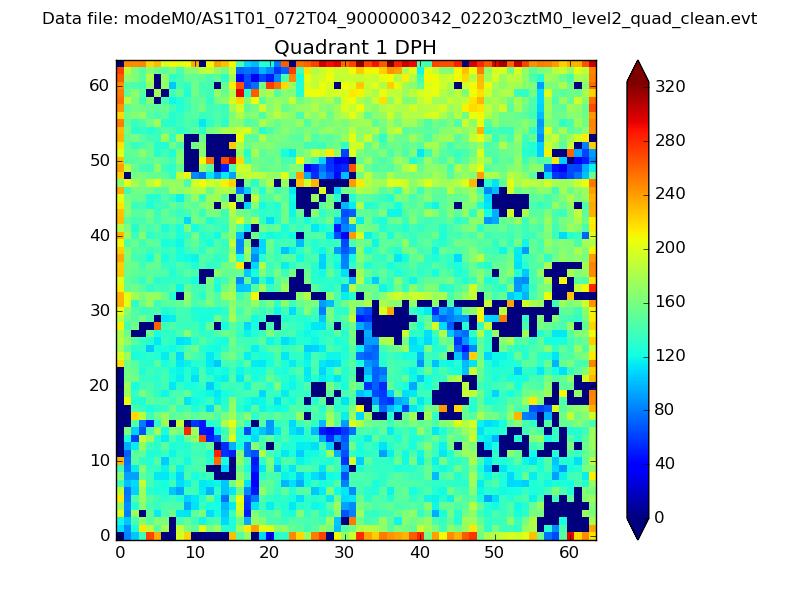 |
Quadrant B |
|---|---|---|---|
| Quadrant D | 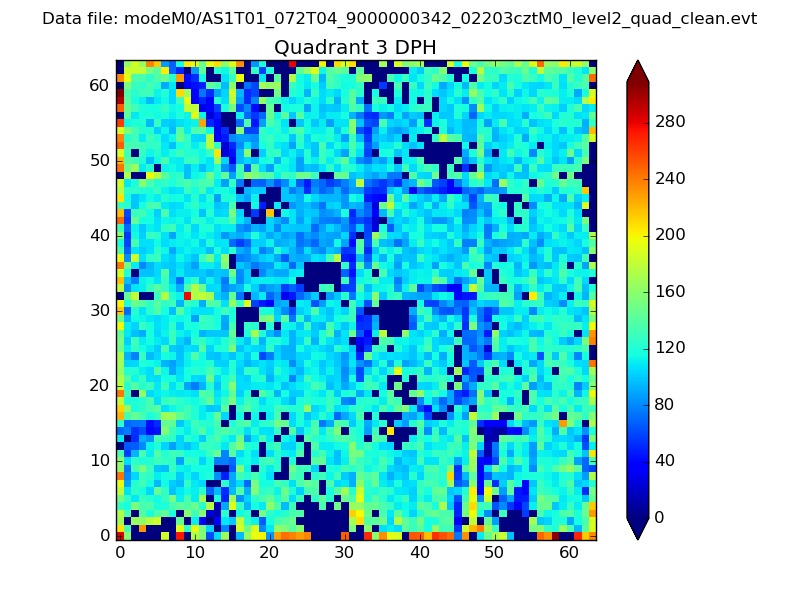 |
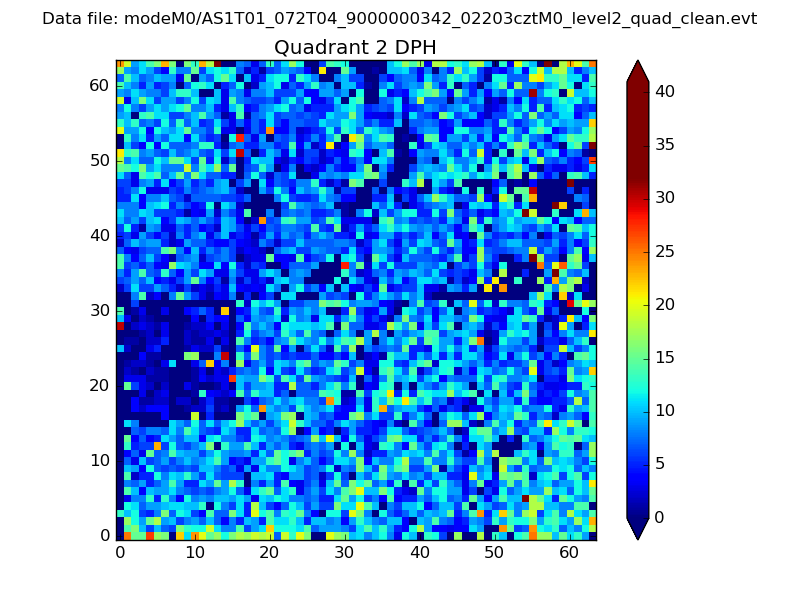 |
Quadrant C |
| Plot type | Count rate plots | Images |
|---|---|---|
| Comparison with Poisson distribution Blue bars denote a histogram of data divided into 1 sec bins. Red curve is a Poisson curve with rate = median count rate of data. |
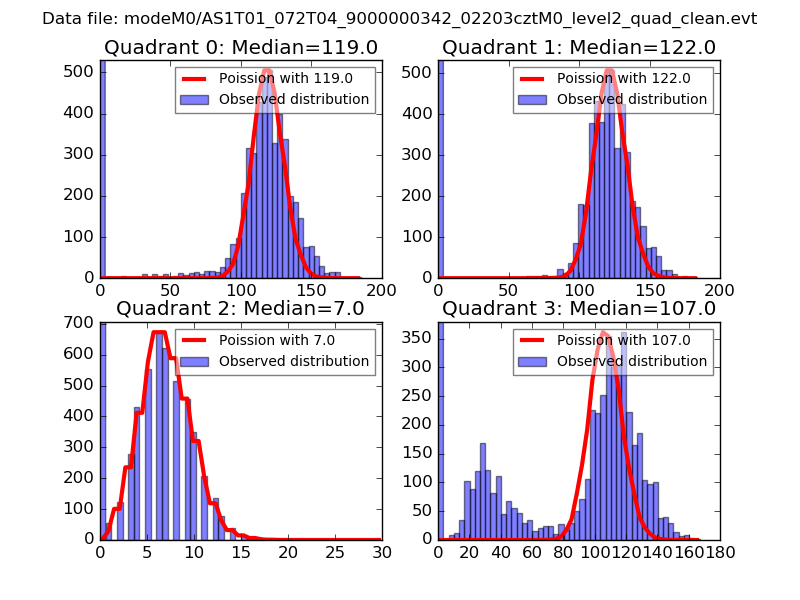 |
 |
| Quadrant-wise count rates Data is divided into 100 sec bins |
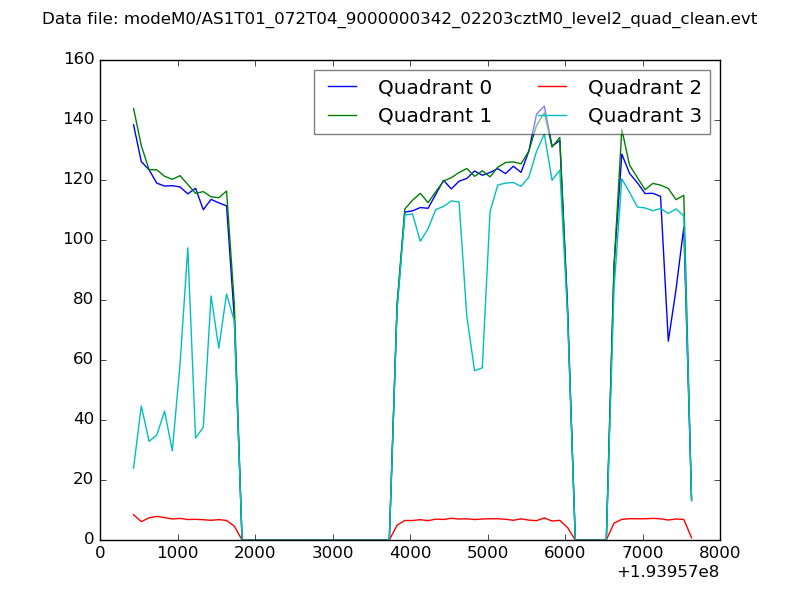 |
|
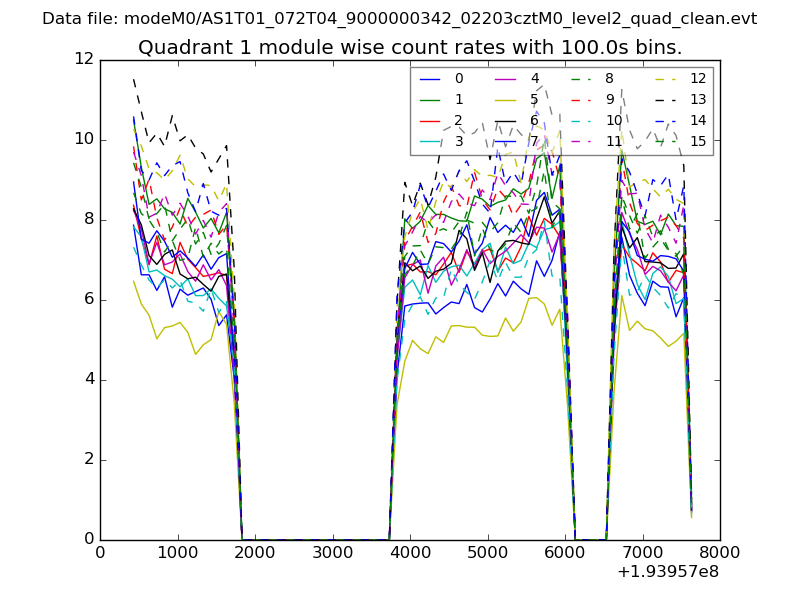
| Module-wise count rates for Quadrant A Data is divided into 100 sec bins |
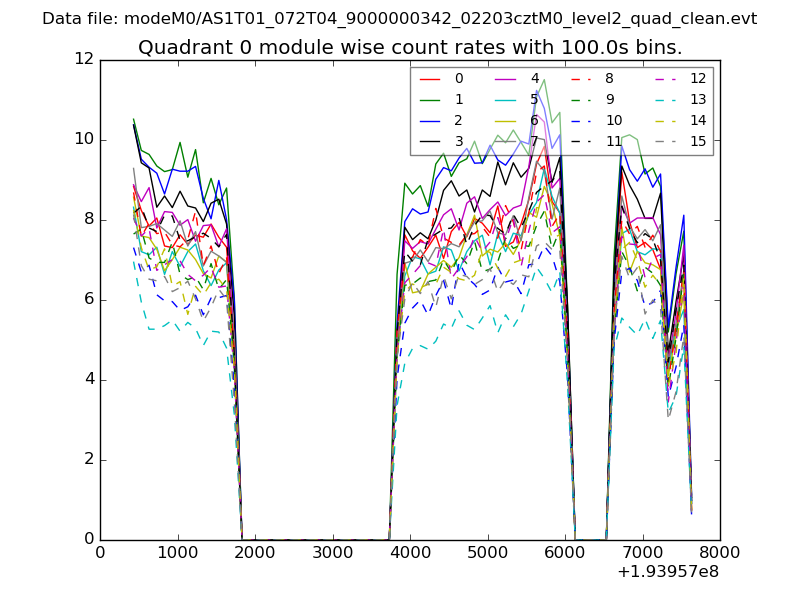 |
 |
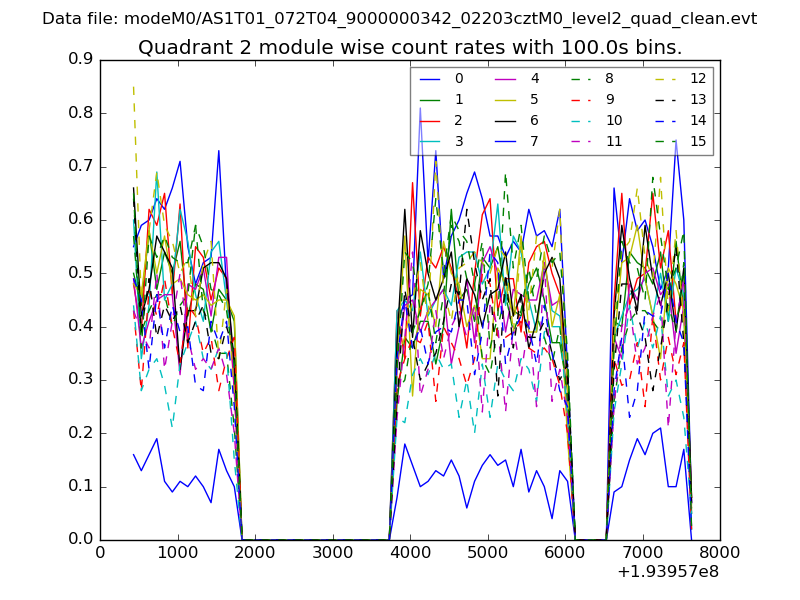
| Module-wise count rates for Quadrant B Data is divided into 100 sec bins |
 |
 |
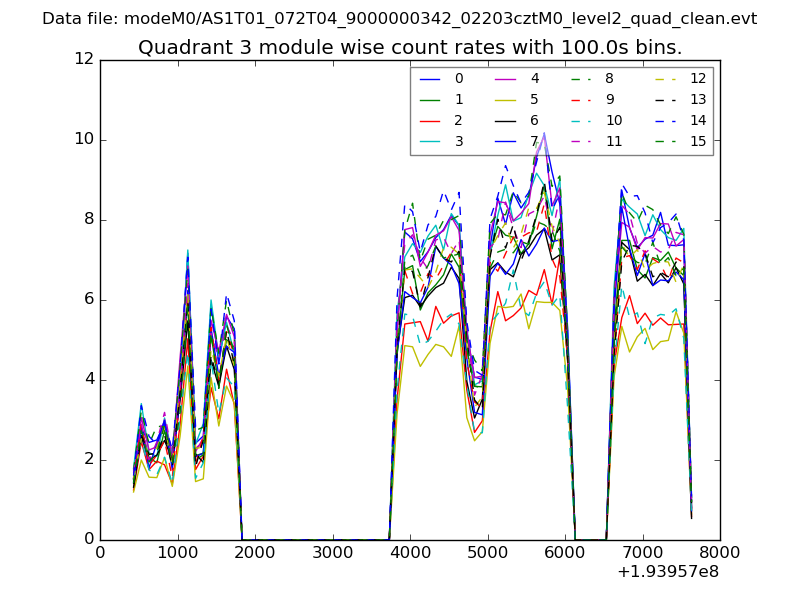
| Module-wise count rates for Quadrant C Data is divided into 100 sec bins |
 |
 |
| Module-wise count rates for Quadrant D Data is divided into 100 sec bins |
 |
 |
| Parameter | Plot |
|---|---|
| CZT HV Monitor | 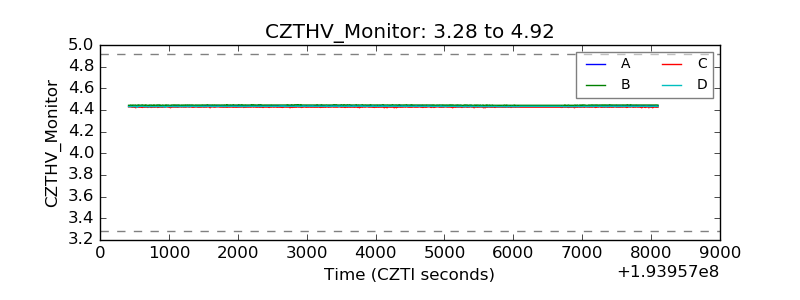 |
| D_VDD | 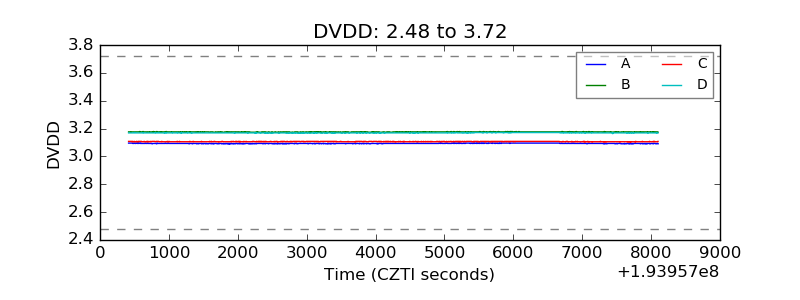 |
| Temperature 1 | 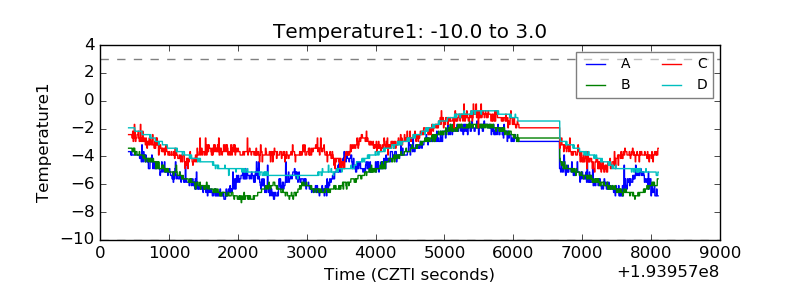 |
| Veto HV Monitor | 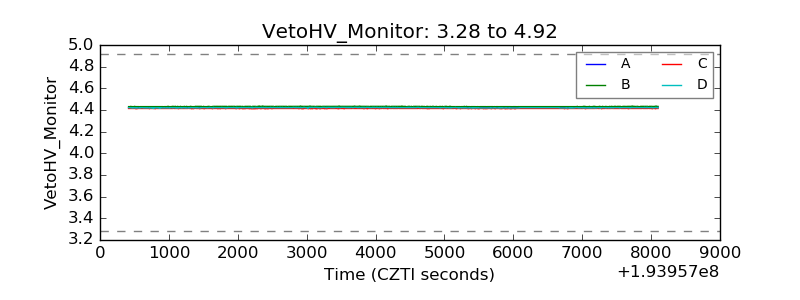 |
| Veto LLD | 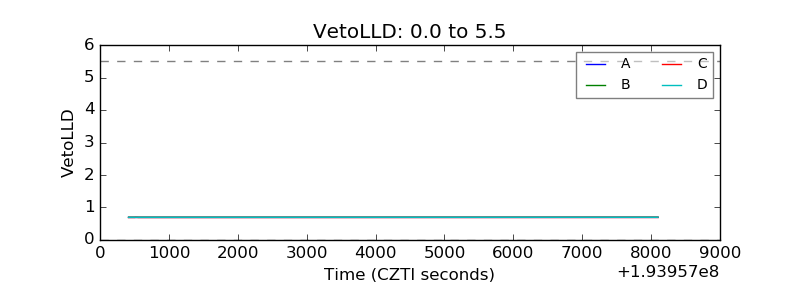 |
| Alpha Counter | 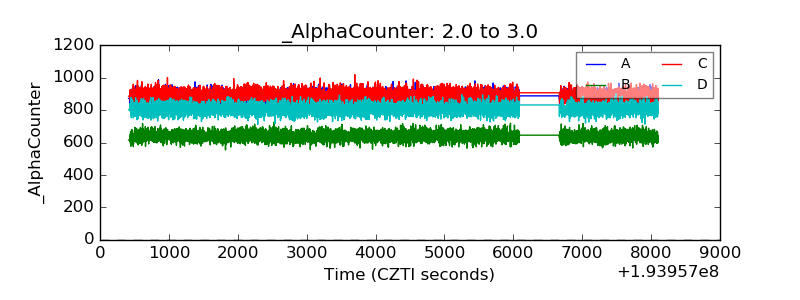 |
| _CPM_Rate | 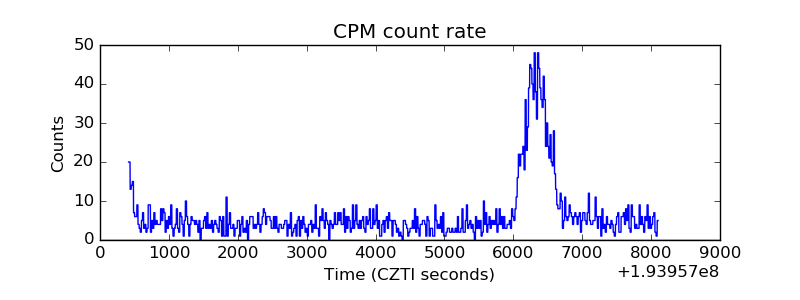 |
| CZT Counter | 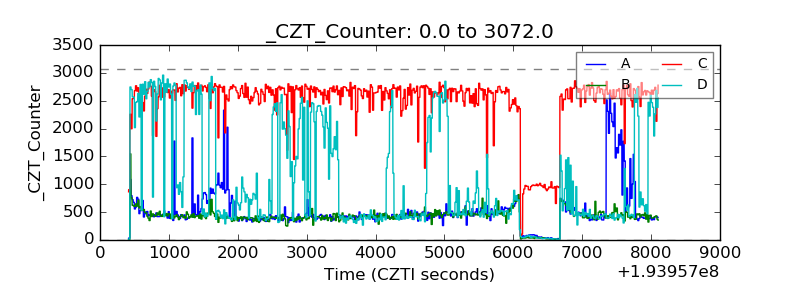 |
| +2.5 Volts monitor |  |
| +5 Volts monitor | 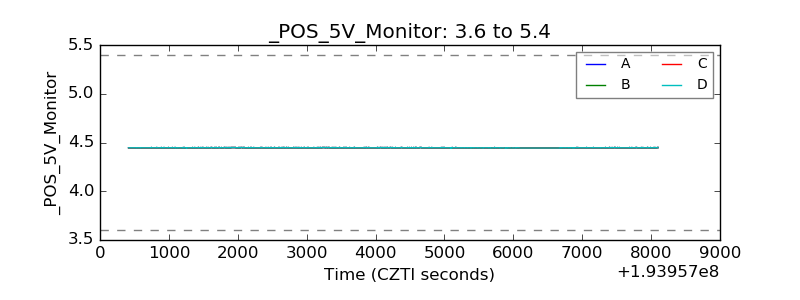 |
| _ROLL_ROT | 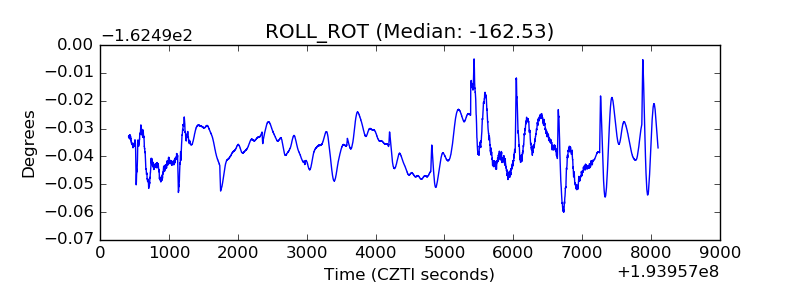 |
| _Roll_DEC | 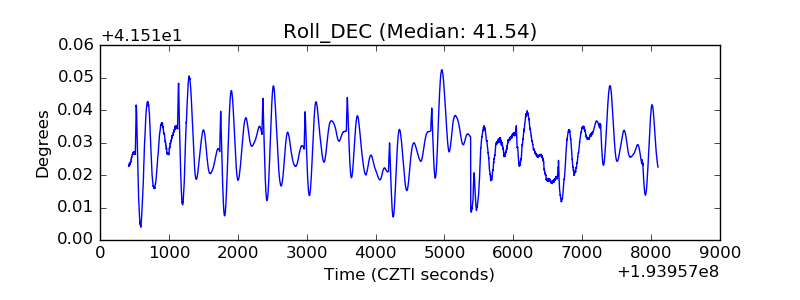 |
| _Roll_RA | 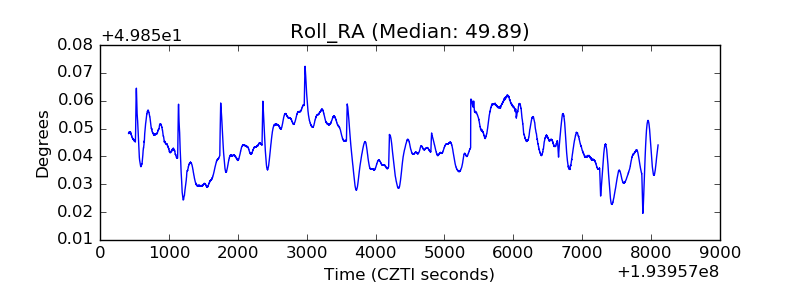 |
| Veto Counter | 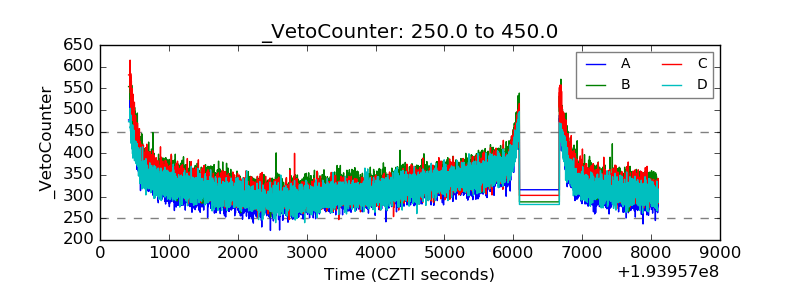 |